Grundlæggende statistik
| Institutionelle ejere | 402 total, 375 long only, 1 short only, 26 long/short - change of -31,16% MRQ |
| Del pris | 131,00 |
| Gennemsnitlig porteføljeallokering | 0.3507 % - change of 15,79% MRQ |
| Institutionelle aktier (lange) | 40.539.271 (ex 13D/G) - change of -7,60MM shares -15,79% MRQ |
| Institutionel værdi (lang) | $ 5.716.628 USD ($1000) |
Institutionelt ejerskab og aktionærer
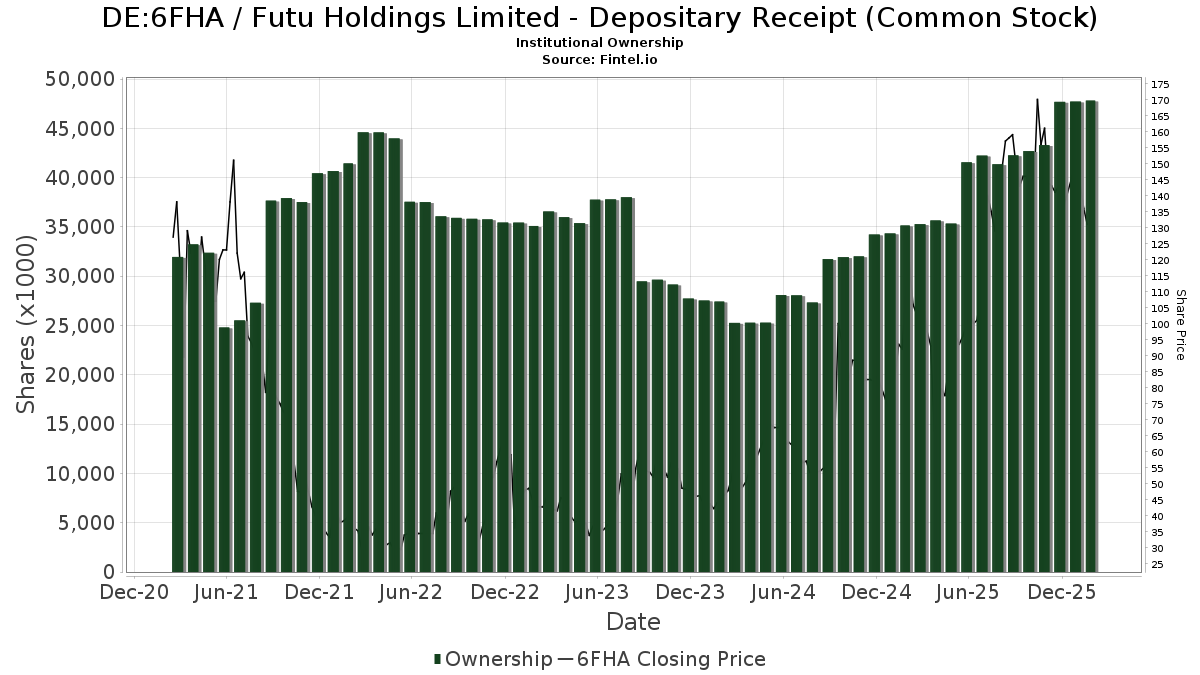
Futu Holdings Limited - Depositary Receipt (Common Stock) (DE:6FHA) har 402 institutionelle ejere og aktionærer, der har indsendt 13D/G- eller 13F-formularer til Securities Exchange Commission (SEC). Disse institutioner har i alt 40,539,271 aktier. Største aktionærer omfatter BlackRock, Inc., Fmr Llc, Aspex Management (HK) Ltd, Susquehanna International Group, Llp, Hillhouse Capital Advisors, Ltd., Morgan Stanley, Arrowstreet Capital, Limited Partnership, Susquehanna International Group, Llp, State Street Corp, and Jane Street Group, Llc .
Futu Holdings Limited - Depositary Receipt (Common Stock) (DB:6FHA) institutionel ejerskabsstruktur viser aktuelle positioner i virksomheden efter institutioner og fonde, samt seneste ændringer i positionsstørrelse. Større aktionærer kan omfatte individuelle investorer, investeringsforeninger, hedgefonde eller institutioner. Skema 13D angiver, at investoren besidder (eller besidder) mere end 5 % af virksomheden og har til hensigt (eller har til hensigt at) aktivt at forfølge en ændring i forretningsstrategi. Skema 13G indikerer en passiv investering på over 5%.
The share price as of April 24, 2026 is 131,00 / share. Previously, on April 28, 2025, the share price was 74,00 / share. This represents an increase of 77,03% over that period.
Fondens stemningsscore
Fund Sentiment Score (fka Ownership Accumulation Score) finder de aktier, der bliver mest købt af fonde. Det er resultatet af en sofistikeret, multi-faktor kvantitativ model, der identificerer virksomheder med de højeste niveauer af institutionel akkumulering. Scoringsmodellen bruger en kombination af den samlede stigning i oplyste ejere, ændringerne i porteføljeallokeringer i disse ejere og andre målinger. Tallet går fra 0 til 100, hvor højere tal indikerer et højere niveau af akkumulering for sine jævnaldrende, og 50 er gennemsnittet.
Opdateringsfrekvens: Dagligt
Se Ownership Explorer, som giver en liste over højest rangerende virksomheder.
AI+ Ask Fintel’s AI assistant about Futu Holdings Limited - Depositary Receipt (Common Stock).
Select a question to share a public post with an AI-crafted answer.
Thinking of good questions…
13F og NPORT arkivering
Detaljer om 13F-arkivering er gratis. Detaljer om NP-ansøgninger kræver et premium-medlemskab. Grønne rækker angiver nye positioner. Røde rækker angiver lukkede positioner. Klik på linket ikon for at se den fulde transaktionshistorik.
Opgrader
for at låse premium-data op og eksportere til Excel ![]() .
.
| Fil dato | Kilde | Investor | Type | Gennemsnitlig pris (Øst) |
Aktier | Δ Aktier (%) |
Rapporteret Værdi ($1000) |
Δ Værdi (%) |
Port Alloc (%) |
|
|---|---|---|---|---|---|---|---|---|---|---|
| 2026-02-12 | 13F | Ensign Peak Advisors, Inc | 3.050 | 1,67 | 501 | -4,03 | ||||
| 2025-11-12 | 13F | Park Square Financial Group, LLC | 0 | -100,00 | 0 | |||||
| 2026-02-13 | 13F | Morgan Stanley | 1.379.876 | -2,91 | 226.590 | -8,33 | ||||
| 2026-02-05 | 13F | Baader Bank INC | 3.000 | 0,00 | 493 | -5,57 | ||||
| 2026-02-11 | 13F | Parallel Advisors, LLC | 1.005 | 2,03 | 165 | -3,51 | ||||
| 2026-02-13 | 13F | Public Employees Retirement Association Of Colorado | 10.791 | 0,00 | 2 | 0,00 | ||||
| 2026-02-13 | 13F | Platinum Investment Management Ltd | 390 | -75,35 | 64 | -76,73 | ||||
| 2026-01-29 | 13F | Rakuten Securities, Inc. | 182 | -45,83 | 30 | -50,00 | ||||
| 2026-02-10 | 13F | Norges Bank | 130.977 | 21.508 | ||||||
| 2026-01-26 | 13F | Asset Dedication, LLC | 3 | 0,00 | 0 | |||||
| 2026-04-20 | 13F | Amiral Gestion | 12.000 | -20,00 | 1.641 | -33,37 | ||||
| 2026-01-30 | 13F | Strategic Blueprint, LLC | 985 | 162 | ||||||
| 2026-02-13 | 13F | Atlas Capital Advisors Llc | 884 | 2,20 | 145 | 36,79 | ||||
| 2026-02-17 | 13F | SummitTX Capital, L.P. | 1.275 | 209 | ||||||
| 2026-02-17 | 13F | Two Sigma Investments, Lp | 46.900 | 134,50 | 7.701 | 121,42 | ||||
| 2026-01-30 | 13F | Strategic Blueprint, LLC | Call | 600 | 99 | |||||
| 2026-02-23 | 13F | Virtu Financial LLC | 2.073 | 0 | ||||||
| 2026-01-07 | 13F | Yeomans Consulting Group, Inc. | 0 | -100,00 | 0 | |||||
| 2026-02-11 | 13F | Fjarde Ap-fonden /fourth Swedish National Pension Fund | 19.198 | 3.153 | ||||||
| 2026-02-17 | 13F | Jones Financial Companies Lllp | 110 | -52,79 | 18 | -55,00 | ||||
| 2026-02-12 | 13F | Jane Street Group, Llc | Put | 911.100 | -20,79 | 149.612 | -25,21 | |||
| 2026-02-17 | 13F | Himension Fund | 56.676 | 45,48 | 9.307 | 37,36 | ||||
| 2025-11-14 | 13F | Bayesian Capital Management, LP | 0 | -100,00 | 0 | -100,00 | ||||
| 2026-01-14 | 13F | ORG Wealth Partners, LLC | 34 | 9,68 | 6 | 0,00 | ||||
| 2026-02-12 | 13F | Jane Street Group, Llc | Call | 1.200.500 | -9,09 | 197.134 | -14,16 | |||
| 2026-02-10 | 13F | Goldman Sachs Group Inc | Put | 0 | -100,00 | 0 | -100,00 | |||
| 2026-02-12 | 13F | Brinker Capital Investments, LLC | 2.391 | 3,33 | 393 | -2,49 | ||||
| 2026-02-06 | 13F | EverSource Wealth Advisors, LLC | 760 | -0,65 | 125 | -6,77 | ||||
| 2026-04-16 | 13F | SG Americas Securities, LLC | 31.685 | -31,34 | 4 | -42,86 | ||||
| 2026-02-13 | 13F | Tree Line Advisors (Hong Kong) Ltd. | 370.000 | 0,00 | 60.758 | -5,44 | ||||
| 2026-01-14 | 13F | Cooper Investors Pty Ltd | 0 | -100,00 | 0 | -100,00 | ||||
| 2026-02-10 | 13F | Jupiter Asset Management Ltd | 60.900 | 3.105,26 | 10.000 | 2.930,30 | ||||
| 2026-02-13 | 13F | Advyzon Investment Management, LLC | 0 | -100,00 | 0 | |||||
| 2026-01-15 | 13F | Burns Matteson Capital Management, LLC | 1.755 | 11,36 | 288 | 5,11 | ||||
| 2026-02-12 | 13F | Mark Sheptoff Financial Planning, Llc | 125 | 0,00 | 21 | -4,76 | ||||
| 2026-02-17 | 13F | Rakuten Investment Management, Inc. | 2.400 | -97,85 | 398 | -95,79 | ||||
| 2026-02-17 | 13F | Amundi | 1.899 | 312 | ||||||
| 2026-02-12 | 13F | BlackRock, Inc. | 4.486.066 | -10,17 | 736.657 | -15,18 | ||||
| 2026-02-03 | 13F | Crossmark Global Holdings, Inc. | 2.690 | 22,00 | 442 | 15,14 | ||||
| 2026-03-06 | 13F | Hsbc Holdings Plc | 310.032 | -46,38 | 50.941 | -49,34 | ||||
| 2026-02-17 | 13F | GAM Holding AG | 21.000 | -59,46 | 3.448 | -61,72 | ||||
| 2026-03-12 | 13F/A | Peak6 Llc | Call | 282.000 | -22,10 | 46.307 | -26,44 | |||
| 2026-03-12 | 13F/A | Peak6 Llc | Put | 673.200 | 28,69 | 110.546 | 21,52 | |||
| 2026-01-20 | 13F | Steel Peak Wealth Management LLC | 0 | -100,00 | 0 | |||||
| 2026-02-17 | 13F | Advisory Services Network, LLC | 0 | -100,00 | 0 | -100,00 | ||||
| 2026-02-12 | 13F | Aviva Plc | 104.192 | 3,54 | 17.109 | -2,23 | ||||
| 2026-02-13 | 13F | Stifel Financial Corp | 4.614 | 6,66 | 758 | 0,66 | ||||
| 2026-02-12 | 13F | CIBC Private Wealth Group, LLC | 0 | -100,00 | 0 | |||||
| 2026-04-13 | 13F | St Germain D J Co Inc | 0 | -100,00 | 0 | |||||
| 2026-02-17 | 13F | Agf Management Ltd | 843.734 | -1,81 | 138.550 | -7,28 | ||||
| 2026-02-17 | 13F | Prelude Capital Management, Llc | 1.468 | -53,51 | 241 | -56,10 | ||||
| 2026-02-03 | 13F | Ballentine Partners, LLC | 0 | -100,00 | 0 | |||||
| 2026-02-11 | 13F | Winton Capital Group Ltd | 1.800 | 296 | ||||||
| 2026-02-13 | 13F | SC CHINA HOLDING Ltd | 0 | -100,00 | 0 | |||||
| 2026-01-07 | 13F | Retirement Wealth Solutions LLC | 0 | -100,00 | 0 | -100,00 | ||||
| 2026-02-18 | 13F | GWM Advisors LLC | 0 | -100,00 | 0 | |||||
| 2026-02-17 | 13F | Philadelphia Financial Management of San Francisco, LLC | Put | 0 | -100,00 | 0 | ||||
| 2026-02-13 | 13F | Citigroup Inc | Call | 25.000 | -83,33 | 4.105 | -84,26 | |||
| 2026-01-29 | 13F | Vanguard Group Inc | 136.891 | -6,55 | 22.479 | -11,76 | ||||
| 2026-02-13 | 13F | Citigroup Inc | Put | 20.000 | 100,00 | 3.284 | 88,84 | |||
| 2026-02-13 | 13F | SPX Equities Gestao de Recursos Ltda | 0 | -100,00 | 0 | |||||
| 2026-02-13 | 13F | Citigroup Inc | 167.064 | 22,26 | 27.434 | 15,44 | ||||
| 2026-02-17 | 13F | D. E. Shaw & Co., Inc. | 1.426 | 234 | ||||||
| 2026-02-17 | 13F | Integrated Advisors Network LLC | 0 | -100,00 | 0 | |||||
| 2026-02-17 | 13F | D. E. Shaw & Co., Inc. | Call | 244.500 | 22,49 | 40.149 | 15,66 | |||
| 2026-02-13 | 13F | Marshall Wace, Llp | Put | 0 | -100,00 | 0 | ||||
| 2026-02-10 | 13F | Ellevest, Inc. | 1.288 | -5,50 | 212 | -10,97 | ||||
| 2026-02-13 | 13F | Marshall Wace, Llp | 0 | -100,00 | 0 | |||||
| 2026-02-13 | 13F | Marshall Wace, Llp | Call | 0 | -100,00 | 0 | ||||
| 2026-02-17 | 13F | D. E. Shaw & Co., Inc. | Put | 331.500 | -30,56 | 54.436 | -34,43 | |||
| 2026-02-10 | 13F | Principia Wealth Advisory, LLC | 5 | 0,00 | 1 | |||||
| 2025-11-14 | 13F | Point72 Hong Kong Ltd | 0 | -100,00 | 0 | -100,00 | ||||
| 2026-04-24 | 13F | TT International Asset Management LTD | 8.565 | 24,93 | 1.171 | 117.000,00 | ||||
| 2026-02-13 | 13F | Great West Life Assurance Co /can/ | 36.021 | -50,21 | 6 | -58,33 | ||||
| 2026-04-08 | 13F | Wealth Enhancement Advisory Services, Llc | 0 | -100,00 | 0 | |||||
| 2026-02-17 | 13F | Lazard Asset Management Llc | 14.730 | -14,84 | 2.419 | -19,59 | ||||
| 2026-02-13 | 13F | Quarry LP | 147 | -49,83 | 24 | -52,00 | ||||
| 2026-01-27 | 13F | Evergreen Capital Management Llc | 1.349 | -12,17 | 222 | -17,23 | ||||
| 2026-02-12 | 13F | Callan Family Office, LLC | 9.476 | 6,01 | 1.556 | 0,13 | ||||
| 2026-02-04 | 13F | Plato Investment Management Ltd | 5.765 | 4,89 | 951 | 0,32 | ||||
| 2026-02-10 | 13F | CIBC Asset Management Inc | 7.352 | 20,62 | 1.207 | 13,98 | ||||
| 2026-02-17 | 13F | SageView Advisory Group, LLC | 13 | 2 | ||||||
| 2026-02-13 | 13F | Allianz Se | 290 | 0,00 | 48 | -6,00 | ||||
| 2026-02-13 | 13F | Wexford Capital Lp | 10.274 | 71,61 | 1.687 | 62,06 | ||||
| 2025-11-14 | 13F | Schonfeld Strategic Advisors LLC | 0 | -100,00 | 0 | -100,00 | ||||
| 2026-04-24 | 13F | Strs Ohio | 21.410 | -5,16 | 2.928 | -21,01 | ||||
| 2026-04-13 | 13F | E Fund Management Co., Ltd. | 256.145 | 261,14 | 35.030 | 299,66 | ||||
| 2026-02-17 | 13F | Citadel Advisors Llc | Put | 281.400 | -52,34 | 46.209 | -55,00 | |||
| 2026-02-19 | 13F | Invesco Ltd. | 47.019 | 15,01 | 7.721 | 8,59 | ||||
| 2026-02-06 | 13F | Leonteq Securities AG | 2.525 | -27,17 | 415 | -31,23 | ||||
| 2026-02-13 | 13F | Barclays Plc | 111.963 | -20,27 | 18.385 | -24,71 | ||||
| 2026-02-17 | 13F | Citadel Advisors Llc | Call | 500.800 | -27,91 | 82.236 | -31,93 | |||
| 2026-02-11 | 13F | Capital International Investors | 941.214 | 0,98 | 154.557 | -4,65 | ||||
| 2026-02-17 | 13F | Citadel Advisors Llc | 23.478 | -1,08 | 3.855 | -6,59 | ||||
| 2026-02-10 | 13F | Daiwa Securities Group Inc. | 5.000 | -15,14 | 1 | -100,00 | ||||
| 2026-02-13 | 13F | Candriam Luxembourg S.C.A. | 184.046 | -0,92 | 30.223 | -6,44 | ||||
| 2026-02-12 | 13F | Marex Group plc | 5.012 | -81,21 | 823 | -82,25 | ||||
| 2026-02-13 | 13F | JustInvest LLC | 5.509 | -10,34 | 905 | -15,36 | ||||
| 2025-11-14 | 13F | Wolverine Trading, Llc | 5.372 | 68,82 | 933 | 142,08 | ||||
| 2026-02-12 | 13F | AI-Squared Management Ltd | 21.400 | 1.088,89 | 3.514 | 1.022,68 | ||||
| 2026-02-17 | 13F | FACT Capital, LP | 29.866 | 1,62 | 4.904 | -4,05 | ||||
| 2025-11-14 | 13F | Wolverine Trading, Llc | Call | 313.300 | -0,22 | 54.405 | 42,92 | |||
| 2025-11-14 | 13F | Wolverine Trading, Llc | Put | 238.100 | 70,07 | 41.346 | 143,61 | |||
| 2026-02-17 | 13F | Oberweis Asset Management Inc/ | 11.000 | 0,00 | 1.806 | -5,59 | ||||
| 2026-01-26 | 13F | KBC Group NV | 30.603 | -28,38 | 5 | -28,57 | ||||
| 2026-02-06 | 13F | Larson Financial Group LLC | 8 | 0,00 | 1 | 0,00 | ||||
| 2026-02-09 | 13F | Hantz Financial Services, Inc. | 1.401 | 73,82 | 0 | |||||
| 2026-02-10 | 13F | NS Partners Ltd | 124.842 | -9,82 | 20.500 | -14,85 | ||||
| 2026-02-17 | 13F | Philadelphia Financial Management of San Francisco, LLC | 60.000 | -34,50 | 9.853 | -38,16 | ||||
| 2026-04-23 | 13F | iA Global Asset Management Inc. | 3.013 | -61,11 | 0 | -100,00 | ||||
| 2025-11-12 | 13F | Quantbot Technologies LP | 0 | -100,00 | 0 | |||||
| 2026-02-02 | 13F | Advisors Preferred, LLC | 2.244 | 60,63 | 400 | 62,60 | ||||
| 2026-02-12 | 13F | Amitell Capital Pte Ltd | 5.377 | 883 | ||||||
| 2026-02-04 | 13F | Swiss Life Asset Management Ltd | 16.225 | -20,15 | 2.664 | -24,60 | ||||
| 2026-02-06 | 13F | Tredje AP-fonden | 532.486 | -22,60 | 87.440 | -26,92 | ||||
| 2026-02-09 | 13F | Geode Capital Management, Llc | 621.466 | -2,25 | 100.861 | -7,66 | ||||
| 2026-04-16 | 13F | E. Ohman J:or Asset Management AB | 3.400 | 36,00 | 465 | 13,17 | ||||
| 2026-04-21 | 13F | Financial Consulate, Inc | 7 | 250,00 | 1 | |||||
| 2026-02-11 | 13F | Simplex Trading, Llc | Put | 250.700 | -29,80 | 41.167 | 66.298,39 | |||
| 2026-02-11 | 13F | Simplex Trading, Llc | 52.535 | 19,80 | 8.627 | 123.128,57 | ||||
| 2026-02-02 | 13F | Principal Financial Group Inc | 10.059 | 30,79 | 1.652 | 23,49 | ||||
| 2026-02-11 | 13F | Simplex Trading, Llc | Call | 160.900 | -10,76 | 26.421 | 85.129,03 | |||
| 2026-04-24 | 13F | Root Financial Partners, LLC | 2 | 100,00 | 0 | |||||
| 2026-02-13 | 13F | Clear Street Group Inc. | 27.587 | 4.530 | ||||||
| 2026-01-23 | 13F | Factory Mutual Insurance Co | 11.992 | 0,00 | 1.969 | -5,56 | ||||
| 2026-02-11 | 13F | Cerity Partners LLC | 2.990 | -4,23 | 491 | -9,59 | ||||
| 2026-01-23 | 13F | Sumitomo Mitsui Trust Holdings, Inc. | 296.240 | -16,41 | 48.646 | -21,07 | ||||
| 2026-02-10 | 13F | National Pension Service | 8.181 | 151,26 | 1.343 | 137,28 | ||||
| 2025-11-12 | 13F | Fox Run Management, L.l.c. | 0 | -100,00 | 0 | -100,00 | ||||
| 2026-02-17 | 13F | Polar Capital Holdings Plc | 33.605 | 5.518 | ||||||
| 2026-02-13 | 13F | BNP Paribas Asset Management Holding S.A. | 12.717 | 2 | ||||||
| 2026-02-13 | 13F | Caitong International Asset Management Co., Ltd | 0 | -100,00 | 0 | |||||
| 2026-04-16 | 13F | Diversified Trust Co | 8.861 | -19,63 | 1.212 | -33,09 | ||||
| 2026-02-13 | 13F | Acumen Wealth Advisors, LLC | 44 | 7 | ||||||
| 2026-02-06 | 13F | Bare Financial Services, Inc | 3 | 0 | ||||||
| 2026-02-13 | 13F | American Century Companies Inc | 8.248 | 1,18 | 1.354 | -4,45 | ||||
| 2025-11-13 | 13F | Connor, Clark & Lunn Investment Management Ltd. | 0 | -100,00 | 0 | -100,00 | ||||
| 2026-02-11 | 13F | Capital Research Global Investors | 35.499 | 0,00 | 5.829 | -5,57 | ||||
| 2025-11-19 | 13F/A | Regions Financial Corp | 0 | -100,00 | 0 | |||||
| 2026-02-17 | 13F | Raymond James Financial Inc | 23.813 | -12,40 | 3.910 | -17,28 | ||||
| 2026-02-13 | 13F | First Trust Advisors Lp | 29.013 | 17,49 | 4.764 | 10,95 | ||||
| 2026-04-22 | 13F | Spire Wealth Management | 800 | 6,67 | 109 | -11,38 | ||||
| 2026-02-13 | 13F | Resources Investment Advisors, LLC. | 1.376 | -21,15 | 226 | -25,74 | ||||
| 2026-04-22 | 13F | Stone House Investment Management, LLC | 2 | 0 | ||||||
| 2026-04-22 | 13F | Pictet Asset Management Holding SA | 125.069 | -0,16 | 17.075 | -17,04 | ||||
| 2026-02-13 | 13F | Police & Firemen's Retirement System of New Jersey | 8.043 | -9,81 | 1.321 | -14,84 | ||||
| 2025-11-05 | 13F | LFA - Lugano Financial Advisors SA | 0 | -100,00 | 0 | |||||
| 2025-11-14 | 13F | Bank Of Nova Scotia | 0 | -100,00 | 0 | -100,00 | ||||
| 2025-11-14 | 13F | Arrowpoint Investment Partners (Singapore) Pte. Ltd. | 0 | -100,00 | 0 | |||||
| 2026-01-15 | 13F | Frank, Rimerman Advisors LLC | 1.518 | 0,00 | 249 | -5,32 | ||||
| 2026-01-28 | 13F | CAPROCK Group, Inc. | 1.297 | 13,08 | 213 | 0,00 | ||||
| 2026-02-06 | 13F | Resona Asset Management Co.,Ltd. | 16.151 | -10,54 | 2.657 | -15,39 | ||||
| 2026-02-06 | 13F | Greenwoods Asset Management Hong Kong Ltd. | 1.135.821 | 14,00 | 186.513 | 7,64 | ||||
| 2026-02-10 | 13F | Gulf International Bank (UK) Ltd | 2.800 | -0,46 | 0 | |||||
| 2026-02-13 | 13F | Ossiam | 2.390 | -6,93 | 392 | -12,11 | ||||
| 2026-01-30 | 13F | Jennison Associates Llc | 161.280 | -24,99 | 26.484 | -29,18 | ||||
| 2026-02-17 | 13F | Nissay Asset Management Corp /japan/ /adv | 7.351 | -5,79 | 1.207 | -11,05 | ||||
| 2026-02-11 | 13F | Syon Capital Llc | 3.615 | 594 | ||||||
| 2026-02-11 | 13F | Myriad Asset Management Advisors LLC | 8.660 | 1.422 | ||||||
| 2026-02-17 | 13F | Jump Financial, LLC | 12.600 | -76,45 | 2.069 | -77,77 | ||||
| 2026-02-20 | 13F/A | CMT Capital Markets Trading GmbH | Put | 26.100 | 0,38 | 4 | 0,00 | |||
| 2026-02-17 | 13F | Liontrust Investment Partners LLP | 3.790 | 152,67 | 622 | 139,23 | ||||
| 2026-02-20 | 13F/A | CMT Capital Markets Trading GmbH | Call | 6.400 | -63,43 | 1 | -66,67 | |||
| 2026-01-30 | 13F | State of New Jersey Common Pension Fund D | 25.960 | -7,81 | 4.263 | -12,97 | ||||
| 2026-04-10 | 13F | Abound Wealth Management | 1 | 0,00 | 0 | |||||
| 2026-02-02 | 13F | Fifth Third Bancorp | 90 | 3,45 | 15 | -6,67 | ||||
| 2026-02-13 | 13F | Banque Transatlantique SA | 0 | -100,00 | 0 | |||||
| 2026-04-15 | 13F | Redhawk Wealth Advisors, Inc. | 13.824 | 72,28 | 1.891 | 43,51 | ||||
| 2026-01-30 | 13F | Mitsubishi UFJ Trust & Banking Corp | 38.519 | 15,75 | 6.325 | 9,30 | ||||
| 2026-04-23 | 13F | Lansforsakringar Fondforvaltning AB (publ) | 12.621 | 0,00 | 1.726 | -16,70 | ||||
| 2026-02-12 | 13F | Principal Securities, Inc. | 0 | -100,00 | 0 | -100,00 | ||||
| 2026-01-21 | 13F | Sound Income Strategies, LLC | 7 | 1 | ||||||
| 2026-02-13 | 13F | Schroder Investment Management Group | 372.876 | 61,94 | 61.230 | 52,90 | ||||
| 2026-02-13 | 13F | Transamerica Financial Advisors, Inc. | 1 | 0 | ||||||
| 2026-02-03 | 13F | ASR Vermogensbeheer N.V. | 6.027 | 40,10 | 990 | 32,22 | ||||
| 2026-02-11 | 13F | Nikko Asset Management Americas, Inc. | 188.707 | 30.993 | ||||||
| 2026-02-11 | 13F | Livforsakringsbolaget Skandia, Omsesidigt | 18.500 | 0,00 | 3.038 | -5,54 | ||||
| 2026-02-12 | 13F | Hollencrest Capital Management | 101 | -59,11 | 17 | -61,90 | ||||
| 2026-02-13 | 13F | State Street Corp | 1.228.491 | -1,14 | 201.731 | -6,65 | ||||
| 2026-02-05 | 13F | DnB Asset Management AS | 20.033 | 71,63 | 3.290 | 62,10 | ||||
| 2026-04-17 | 13F | Bell Investment Advisors, Inc | 11 | 0,00 | 2 | 0,00 | ||||
| 2026-02-17 | 13F | Scientech Research LLC | 1.658 | 272 | ||||||
| 2026-02-05 | 13F | New York Life Investment Management Llc | 0 | -100,00 | 0 | |||||
| 2026-04-14 | 13F | Perpetual Ltd | 0 | -100,00 | 0 | |||||
| 2026-02-17 | 13F | Cetera Investment Advisers | 5.557 | -21,51 | 913 | -25,91 | ||||
| 2026-01-22 | 13F | Personal Cfo Solutions, Llc | 1.713 | 5,09 | 281 | -0,71 | ||||
| 2026-02-06 | 13F | Berbice Capital Management LLC | 120 | 0,00 | 20 | -5,00 | ||||
| 2026-01-29 | 13F | Matthews International Capital Management Llc | 150.906 | 214,47 | 24.780 | 196,94 | ||||
| 2026-02-12 | 13F | Penserra Capital Management LLC | 0 | -100,00 | 0 | |||||
| 2026-02-18 | 13F | Vident Advisory, LLC | 23.251 | 38,04 | 3.818 | 30,35 | ||||
| 2026-02-13 | 13F | Squarepoint Ops LLC | 117.377 | 1.660,04 | 19.274 | 1.562,99 | ||||
| 2026-01-15 | 13F | Nisa Investment Advisors, Llc | 700 | 115 | ||||||
| 2026-01-26 | 13F | Mirae Asset Global Investments Co., Ltd. | 57.437 | 48,10 | 9.432 | 39,84 | ||||
| 2026-02-10 | 13F | State of Wyoming | 1.260 | 9,57 | 207 | 3,52 | ||||
| 2026-02-13 | 13F | Arrowstreet Capital, Limited Partnership | 1.365.680 | -17,74 | 224.258 | -22,33 | ||||
| 2026-02-13 | 13F | Squarepoint Ops LLC | Call | 141.600 | 3,06 | 23.252 | -2,69 | |||
| 2026-02-13 | 13F | Squarepoint Ops LLC | Put | 179.000 | 20,05 | 29.394 | 13,36 | |||
| 2026-02-13 | 13F | Verition Fund Management LLC | Call | 29.000 | -19,67 | 4.762 | -24,15 | |||
| 2026-04-24 | 13F | IFM Investors Pty Ltd | 11.172 | 0,00 | 1.528 | 152.600,00 | ||||
| 2026-02-12 | 13F | Renaissance Technologies Llc | 757.226 | 5,90 | 124.344 | 0,00 | ||||
| 2026-02-13 | 13F | Verition Fund Management LLC | 32.657 | 62,06 | 5.363 | 53,03 | ||||
| 2026-02-13 | 13F | Pinpoint Asset Management (Singapore) Pte. Ltd. | 9.714 | 1,06 | 1.595 | -4,55 | ||||
| 2026-02-13 | 13F | Verition Fund Management LLC | Put | 24.500 | -58,26 | 4.023 | -60,59 | |||
| 2026-03-16 | 13F/A | Rockefeller Capital Management L.P. | 226 | 59,15 | 37 | 54,17 | ||||
| 2025-11-04 | 13F | Lingohr & Partner Asset Management GmbH | 16.800 | 3 | ||||||
| 2026-02-13 | 13F | 1832 Asset Management L.P. | 0 | -100,00 | 0 | -100,00 | ||||
| 2026-01-23 | 13F | Assetmark, Inc | 360 | -43,31 | 59 | -46,36 | ||||
| 2026-02-13 | 13F | Osmosis Investment Management UK Ltd | 3.802 | 624 | ||||||
| 2026-01-30 | 13F | Us Bancorp \de\ | 10.346 | -21,10 | 1.699 | -25,53 | ||||
| 2026-02-02 | 13F | Danske Bank A/s | 31.917 | 4,16 | 5.241 | -1,63 | ||||
| 2026-01-15 | 13F | Allspring Global Investments Holdings, LLC | 9.284 | 77,82 | 1.657 | 79,80 | ||||
| 2026-02-11 | 13F | Vestcor Inc | 907 | 0,00 | 0 | |||||
| 2026-02-17 | 13F | Bank Of America Corp /de/ | 322.670 | 160,74 | 52.986 | 146,20 | ||||
| 2026-04-20 | 13F | Yorktown Management & Research Co Inc | 3.500 | 0,00 | 479 | -16,72 | ||||
| 2025-11-12 | 13F | Capital Markets Trading UK LLP | 0 | -100,00 | 0 | -100,00 | ||||
| 2026-02-05 | 13F | AlphaCore Capital LLC | 1.865 | -6,28 | 306 | -11,56 | ||||
| 2026-04-24 | 13F | Raiffeisen Bank International AG | 116 | -99,56 | 15 | -99,66 | ||||
| 2026-02-17 | 13F | Royal Bank Of Canada | 3.591 | 3,10 | 590 | -2,64 | ||||
| 2026-02-10 | 13F | Westpac Banking Corp | 15.219 | 22,54 | 2.499 | 15,75 | ||||
| 2026-02-10 | 13F | Envestnet Asset Management Inc | 14.591 | -16,72 | 2.396 | -21,37 | ||||
| 2026-02-10 | 13F | Fideuram Asset Management (Ireland) dac | 6.293 | 513 | ||||||
| 2026-02-17 | 13F | Tudor Investment Corp Et Al | Put | 12.900 | 2.118 | |||||
| 2026-01-28 | 13F | B. Metzler seel. Sohn & Co. AG | 4.477 | 190,90 | 735 | 175,28 | ||||
| 2026-02-17 | 13F | Tudor Investment Corp Et Al | Call | 7.200 | 1.182 | |||||
| 2026-02-12 | 13F | Brown Brothers Harriman & Co | 0 | -100,00 | 0 | |||||
| 2026-02-17 | 13F | Tudor Investment Corp Et Al | 3.463 | 569 | ||||||
| 2026-04-24 | 13F | Yousif Capital Management, Llc | 3.572 | 0,00 | 489 | -19,87 | ||||
| 2026-02-13 | 13F | Sei Investments Co | 39.427 | 61,12 | 6.474 | 52,15 | ||||
| 2026-02-12 | 13F | Barings Llc | 1.579 | -5,96 | 259 | -11,00 | ||||
| 2026-02-17 | 13F | Trexquant Investment LP | 4.198 | -71,27 | 689 | -72,87 | ||||
| 2026-01-21 | 13F | Albion Financial Group /ut | 10 | 0,00 | 2 | 0,00 | ||||
| 2026-02-13 | 13F | SRS Capital Advisors, Inc. | 46 | -25,81 | 8 | -30,00 | ||||
| 2026-02-13 | 13F | Neuberger Berman Group LLC | 3.966 | 2,67 | 651 | -2,98 | ||||
| 2026-02-13 | 13F | Toroso Investments, LLC | 11.233 | -1,70 | 1.845 | -7,20 | ||||
| 2026-02-05 | 13F | AustralianSuper Pty Ltd | 131.531 | 113,55 | 21.599 | 101,64 | ||||
| 2026-02-06 | 13F | Gsa Capital Partners Llp | 3.576 | -40,63 | 1 | -100,00 | ||||
| 2026-02-13 | 13F | Polymer Capital Management (HK) LTD | 57.226 | -13,31 | 9.397 | -18,14 | ||||
| 2026-02-17 | 13F | Point72 Asset Management, L.P. | 674.798 | 110.809 | ||||||
| 2026-02-17 | 13F | Point72 Asset Management, L.P. | Put | 128.500 | 21.101 | |||||
| 2026-02-17 | 13F | Point72 Asset Management, L.P. | Call | 301.200 | 7.071,43 | 49.460 | 6.675,34 | |||
| 2026-02-17 | 13F | LMR Partners LLP | Call | 32.000 | 0,00 | 5.255 | -5,59 | |||
| 2026-02-17 | 13F | LMR Partners LLP | Put | 62.000 | 93,75 | 10.181 | 82,95 | |||
| 2026-02-10 | 13F | Savant Capital, LLC | 1.276 | -5,55 | 210 | -10,68 | ||||
| 2026-02-17 | 13F | Edmond De Rothschild Holding S.a. | 7.800 | 56,00 | 1.281 | 47,30 | ||||
| 2025-11-14 | 13F | Susquehanna Fundamental Investments, Llc | 0 | -100,00 | 0 | -100,00 | ||||
| 2026-02-17 | 13F | LMR Partners LLP | 29.362 | -45,39 | 4.822 | -48,44 | ||||
| 2026-04-08 | 13F | NorthCrest Asset Manangement, LLC | 0 | -100,00 | 0 | |||||
| 2026-02-04 | 13F | Beverly Hills Private Wealth, LLC | 1.188 | 0,00 | 207 | 0,00 | ||||
| 2026-03-10 | 13F | MY.Alpha Management HK Advisors Ltd | 249.369 | 47,93 | 40.949 | 39,68 | ||||
| 2026-01-22 | 13F | BOCHK Asset Management Ltd | 6.240 | -0,16 | 1.025 | -5,71 | ||||
| 2026-02-12 | 13F | JPL Wealth Management, LLC | 0 | -100,00 | 0 | |||||
| 2025-11-14 | 13F | Vienna Asset Management LLC | 0 | -100,00 | 0 | -100,00 | ||||
| 2026-02-17 | 13F | Aqr Capital Management Llc | 11.354 | 31,69 | 1.864 | 24,35 | ||||
| 2026-02-13 | 13F | Change Path, LLC | 4.550 | -35,19 | 747 | -38,77 | ||||
| 2026-02-13 | 13F | Wells Fargo & Company/mn | 14.223 | 1,94 | 2.336 | -3,75 | ||||
| 2025-11-07 | 13F | Sierra Ocean, Llc | 0 | -100,00 | 0 | |||||
| 2026-02-20 | 13F/A | CMT Capital Markets Trading GmbH | 6.029 | 107,11 | 1 | |||||
| 2026-02-03 | 13F | Ethic Inc. | 8.733 | -3,58 | 1.434 | -8,95 | ||||
| 2026-04-15 | 13F | Myriad Asset Management US LP | 0 | -100,00 | 0 | |||||
| 2026-02-11 | 13F | IvyRock Asset Management (HK) Ltd | 0 | -100,00 | 0 | |||||
| 2026-02-03 | 13F | Mitsubishi UFJ Kokusai Asset Management Co., Ltd. | 57.015 | -0,16 | 10.175 | 2,45 | ||||
| 2026-02-17 | 13F | Northern Trust Corp | 312.837 | 0,82 | 51.371 | -4,81 | ||||
| 2026-02-17 | 13F | Investment Management Corp of Ontario | 5.158 | 82,71 | 847 | 72,65 | ||||
| 2026-02-04 | 13F | Aubrey Capital Management Ltd | 123.000 | -17,78 | 20.198 | -22,36 | ||||
| 2026-04-15 | 13F | Activest Wealth Management | 0 | 0 | ||||||
| 2026-02-11 | 13F | Jpmorgan Chase & Co | Call | 95.200 | 46,24 | 15.633 | 38,08 | |||
| 2026-02-11 | 13F | Jpmorgan Chase & Co | Put | 4.900 | -77,63 | 805 | -78,89 | |||
| 2026-02-17 | 13F | Ninepoint Partners LP | 21 | 3 | ||||||
| 2026-02-11 | 13F | Jpmorgan Chase & Co | 351.056 | -33,73 | 57.647 | -37,43 | ||||
| 2026-04-21 | 13F | Venturi Wealth Management, LLC | 3.198 | 153,41 | 437 | 111,11 | ||||
| 2026-01-29 | 13F | China Universal Asset Management Co., Ltd. | 15.740 | -20,41 | 2.585 | -24,86 | ||||
| 2026-02-12 | 13F | New York State Common Retirement Fund | 37.022 | 889,63 | 6.079 | 835,23 | ||||
| 2026-02-17 | 13F | Creative Planning | 13.196 | -1,68 | 2.167 | -7,20 | ||||
| 2026-02-17 | 13F | Price T Rowe Associates Inc /md/ | 755.339 | -7,85 | 124 | -12,68 | ||||
| 2025-11-13 | 13F | Aware Super Pty Ltd as trustee of Aware Super | 33.592 | -33,04 | 5.842 | -5,79 | ||||
| 2026-02-10 | 13F | Bnp Paribas Arbitrage, Sa | 348.465 | 28,21 | 57.221 | 21,06 | ||||
| 2026-02-02 | 13F | Horizon Investments, LLC | 3.168 | 197,46 | 520 | 181,08 | ||||
| 2026-02-11 | 13F | ARK Investment Management LLC | 106.024 | -18,30 | 17.410 | -22,86 | ||||
| 2026-02-18 | 13F | Mackenzie Financial Corp | 6.177 | -24,28 | 1.019 | -28,21 | ||||
| 2026-02-17 | 13F | Man Group plc | 75.758 | -80,75 | 12.440 | -81,83 | ||||
| 2026-02-17 | 13F | Moore Capital Management, Lp | 0 | -100,00 | 0 | |||||
| 2026-02-17 | 13F | Coatue Management Llc | 0 | -100,00 | 0 | |||||
| 2026-04-15 | 13F | Gf Fund Management Co. Ltd. | 0 | -100,00 | 0 | |||||
| 2026-02-11 | 13F | Metis Global Partners, LLC | 0 | -100,00 | 0 | |||||
| 2026-02-12 | 13F | BRIGHT VALLEY CAPITAL Ltd | 13.400 | 2.200 | ||||||
| 2026-02-04 | 13F | Pacer Advisors, Inc. | 0 | -100,00 | 0 | |||||
| 2026-02-10 | 13F | Greenwich Wealth Management LLC | 507.500 | 68,33 | 83 | 59,62 | ||||
| 2026-02-13 | 13F | Van Eck Associates Corp | 32.762 | 7,75 | 5 | 0,00 | ||||
| 2026-02-13 | 13F | Cornerstone Financial Management LLC | 9 | 1 | ||||||
| 2026-02-17 | 13F | Fullerton Fund Management Co Ltd | 39.403 | 6.470 | ||||||
| 2026-04-21 | 13F | PharVision Advisers, LLC | 0 | -100,00 | 0 | |||||
| 2026-02-09 | 13F | Legal & General Group Plc | 330.074 | -4,29 | 54.201 | -9,63 | ||||
| 2026-02-13 | 13F | Rhumbline Advisers | 19.739 | -4,82 | 3.241 | -10,12 | ||||
| 2025-11-14 | 13F | AXA Investment Managers S.A. | 2.948 | 513 | ||||||
| 2026-02-06 | 13F | HighTower Advisors, LLC | 9.103 | -5,54 | 1.495 | -10,81 | ||||
| 2026-02-11 | 13F | Westerkirk Capital Inc. | 2.000 | 300,00 | 328 | 281,40 | ||||
| 2026-04-24 | 13F | Ninety One UK Ltd | 4.468 | 611 | ||||||
| 2026-02-17 | 13F | Grantham, Mayo, Van Otterloo & Co. LLC | 6.657 | 0,00 | 1.093 | -5,53 | ||||
| 2026-01-30 | 13F | American Capital Advisory, LLC | 1 | 0,00 | 0 | |||||
| 2026-02-13 | 13F | Oasis Management Co Ltd. | 30.000 | 0,00 | 4.926 | -5,58 | ||||
| 2026-01-08 | 13F | Nordea Investment Management Ab | 6.209 | 18,22 | 1.029 | 12,84 | ||||
| 2026-02-12 | 13F | Integrated Quantitative Investments LLC | 5.604 | -0,36 | 920 | -5,93 | ||||
| 2025-11-04 | 13F | Yong Rong (HK) Asset Management Ltd | 0 | -100,00 | 0 | -100,00 | ||||
| 2026-01-23 | 13F | Diversify Advisory Services, LLC | 3.235 | 10,11 | 556 | -2,63 | ||||
| 2026-02-13 | 13F | Ubs Asset Management Americas Inc | 813 | -99,93 | 134 | -99,93 | ||||
| 2026-04-13 | 13F | True Wealth Design, LLC | 38 | 216,67 | 5 | 400,00 | ||||
| 2026-02-17 | 13F | Symmetry Peak Management Llc | Call | 0 | -100,00 | 0 | ||||
| 2026-02-13 | 13F | Prudential Financial Inc | 38.860 | 0,66 | 6.381 | -4,95 | ||||
| 2026-01-26 | 13F | Cwm, Llc | 2.103 | 429,72 | 0 | |||||
| 2026-02-17 | 13F | Laird Norton Trust Company, Llc | 3.762 | 618 | ||||||
| 2026-02-11 | 13F | Trivest Advisors Ltd | 540.000 | 2,51 | 88.673 | -3,21 | ||||
| 2026-02-13 | 13F | Natixis | 3.553 | 2,57 | 583 | -3,16 | ||||
| 2026-02-17 | 13F | Caisse De Depot Et Placement Du Quebec | 132.218 | -38,67 | 21.712 | -42,09 | ||||
| 2025-10-31 | 13F | AnglePoint Asset Management Ltd | 0 | -100,00 | 0 | |||||
| 2025-11-14 | 13F | Orbis Allan Gray Ltd | 0 | -100,00 | 0 | |||||
| 2026-04-13 | 13F | IFP Advisors, Inc | 8 | 0,00 | 1 | 0,00 | ||||
| 2026-02-05 | 13F | Thrivent Financial For Lutherans | 1.922 | -20,12 | 0 | |||||
| 2026-01-30 | 13F | Sigma Planning Corp | 0 | -100,00 | 0 | |||||
| 2026-02-06 | 13F | Profund Advisors Llc | 3.431 | -37,07 | 563 | -40,61 | ||||
| 2026-02-17 | 13F | Mercer Global Advisors Inc /adv | 11.996 | -56,10 | 1.970 | -58,56 | ||||
| 2026-02-13 | 13F | Y-Intercept (Hong Kong) Ltd | 4.003 | -3,08 | 657 | -8,50 | ||||
| 2026-02-17 | 13F | FIL Ltd | 732.863 | 5,99 | 120.343 | 0,08 | ||||
| 2026-02-10 | 13F | Intech Investment Management Llc | 2.816 | 462 | ||||||
| 2026-02-11 | 13F | Havemeyer Place LP | 2.013 | 331 | ||||||
| 2025-11-14 | 13F | Cubist Systematic Strategies, LLC | Call | 346.500 | 130,23 | 60.260 | 223,97 | |||
| 2025-11-14 | 13F | Cubist Systematic Strategies, LLC | Put | 98.300 | 102,68 | 17.095 | 185,20 | |||
| 2026-02-17 | 13F | Think Investments LP | 156.900 | -29,58 | 25.765 | -33,51 | ||||
| 2026-02-11 | 13F | Capital International Inc /ca/ | 210.209 | -7,14 | 34.518 | -12,32 | ||||
| 2026-02-12 | 13F | Skopos Labs, Inc. | 2.146 | 50,28 | 356 | 43,55 | ||||
| 2026-02-12 | 13F | APG Asset Management N.V. | 40.352 | -10,92 | 5.642 | -15,86 | ||||
| 2026-02-12 | 13F | Bank Of Montreal /can/ | 23.663 | -33,42 | 3.886 | -37,14 | ||||
| 2026-02-10 | 13F/A | Northwestern Mutual Wealth Management Co | 23 | 1.050,00 | 4 | |||||
| 2026-04-08 | 13F | Arlington Trust Co LLC | 13 | 2 | ||||||
| 2026-02-13 | 13F | Macquarie Group Ltd | 3.306 | -45,91 | 543 | -48,96 | ||||
| 2026-02-13 | 13F | Ieq Capital, Llc | 1.680 | 13,36 | 276 | 7,00 | ||||
| 2025-11-10 | 13F | Vestmark Advisory Solutions, Inc. | 0 | -100,00 | 0 | -100,00 | ||||
| 2026-04-13 | 13F | Global X Japan Co., Ltd. | 776 | 106 | ||||||
| 2026-02-11 | 13F | Group One Trading, L.p. | Put | 282.400 | -5,33 | 46.373 | -10,61 | |||
| 2026-02-11 | 13F | Group One Trading, L.p. | Call | 318.700 | 6,77 | 52.334 | 0,81 | |||
| 2026-02-12 | 13F | Barometer Capital Management Inc. | 0 | -100,00 | 0 | |||||
| 2026-02-17 | 13F | Jain Global LLC | 33.514 | 5.503 | ||||||
| 2026-02-11 | 13F | Group One Trading, L.p. | 85.957 | -43,64 | 14.115 | -46,79 | ||||
| 2025-11-12 | 13F | HAP Trading, LLC | Put | 20.400 | 345 | |||||
| 2026-02-05 | 13F | Atria Investments Llc | 3.320 | -0,81 | 545 | -6,36 | ||||
| 2026-02-17 | 13F | Hillhouse Capital Advisors, Ltd. | 1.630.249 | -49,66 | 267.703 | -52,46 | ||||
| 2026-02-10 | 13F | Goldman Sachs Group Inc | Call | 0 | -100,00 | 0 | -100,00 | |||
| 2026-02-13 | 13F | Strategic Global Advisors, LLC | 2.912 | -26,50 | 478 | -30,62 | ||||
| 2026-02-02 | 13F | Montag A & Associates Inc | 0 | -100,00 | 0 | |||||
| 2026-02-13 | 13F | Manufacturers Life Insurance Company, The | 0 | -100,00 | 0 | |||||
| 2026-02-12 | 13F | Hrt Financial Lp | 0 | -100,00 | 0 | -100,00 | ||||
| 2026-02-10 | 13F | AdvisorShares Investments LLC | 7.030 | 2,93 | 1.154 | -2,78 | ||||
| 2026-02-10 | 13F | Commonwealth Of Pennsylvania Public School Empls Retrmt Sys | 9.256 | -7,70 | 1.520 | -12,85 | ||||
| 2026-02-13 | 13F | Healthcare Of Ontario Pension Plan Trust Fund | 42.400 | 91,62 | 6.963 | 80,93 | ||||
| 2026-02-13 | 13F | Public Sector Pension Investment Board | 44.014 | -17,29 | 7.228 | -21,90 | ||||
| 2025-11-14 | 13F | Old Mission Capital Llc | 0 | -100,00 | 0 | |||||
| 2026-02-05 | 13F | Bessemer Group Inc | 47 | 67,86 | 0 | |||||
| 2026-02-13 | 13F | Headlands Technologies LLC | 7.247 | 31,12 | 1.190 | 23,83 | ||||
| 2026-02-10 | 13F | Rothschild Investment Llc | 12 | 0,00 | 2 | -50,00 | ||||
| 2026-02-17 | 13F | Susquehanna International Group, Llp | Put | 1.662.000 | -22,14 | 272.917 | -26,48 | |||
| 2026-04-17 | 13F | AdvisorNet Financial, Inc | 0 | -100,00 | 0 | |||||
| 2026-02-17 | 13F | Susquehanna International Group, Llp | Call | 1.307.000 | -33,21 | 214.622 | -36,93 | |||
| 2026-02-17 | 13F | Persistent Asset Partners Ltd | 0 | -100,00 | 0 | |||||
| 2026-02-17 | 13F | Susquehanna International Group, Llp | 2.462 | -97,84 | 404 | -97,96 | ||||
| 2026-02-13 | 13F | Caxton Associates Llp | 1.633 | -85,89 | 268 | -86,69 | ||||
| 2026-02-12 | 13F | MetLife Investment Management, LLC | 4.900 | -18,33 | 805 | -22,91 | ||||
| 2026-02-17 | 13F | Quadrature Capital Ltd | 133.495 | -36,85 | 21.921 | -40,38 | ||||
| 2026-02-09 | 13F | Wcm Investment Management, Llc | 1.304 | 3,00 | 216 | -1,83 | ||||
| 2025-11-13 | 13F | Tairen Capital Ltd | 0 | -100,00 | 0 | -100,00 | ||||
| 2026-02-11 | 13F | CenterBook Partners LP | 12.987 | 2.133 | ||||||
| 2026-02-18 | 13F/A | Alberta Investment Management Corp | 9.000 | 0,00 | 1.478 | -5,62 | ||||
| 2026-02-17 | 13F | Credit Agricole S A | 82.794 | 55,22 | 13.596 | 46,56 | ||||
| 2026-01-30 | 13F | FengHe Fund Management Pte. Ltd. | 0 | -100,00 | 0 | |||||
| 2026-02-17 | 13F | Arrow Capital Pty Ltd | 0 | -100,00 | 0 | -100,00 | ||||
| 2025-11-13 | 13F | Fore Capital, LLC | 0 | -100,00 | 0 | -100,00 | ||||
| 2026-02-14 | 13F | Taikang Asset Management (Hong Kong) Co Ltd | 182.605 | 29.986 | ||||||
| 2026-02-13 | 13F | Mml Investors Services, Llc | 0 | -100,00 | 0 | |||||
| 2026-02-13 | 13F | Sompo Japan Nipponkoa Asset Management Co.,ltd. | 4.300 | -8,51 | 706 | -13,59 | ||||
| 2026-02-17 | 13F | Holocene Advisors, LP | 166.800 | 0,00 | 27.390 | -5,58 | ||||
| 2026-02-18 | 13F | Achmea Investment Management B.V. | 2.961 | 0 | ||||||
| 2025-11-14 | 13F | Aigen Investment Management, Lp | 0 | -100,00 | 0 | |||||
| 2026-02-11 | 13F | Franklin Resources Inc | 2.556 | -24,47 | 420 | -28,74 | ||||
| 2025-11-14 | 13F | Cubist Systematic Strategies, LLC | 0 | -100,00 | 0 | -100,00 | ||||
| 2026-02-10 | 13F | Dynasty Wealth Management, Llc | 3.362 | 2,94 | 552 | -2,65 | ||||
| 2026-04-10 | 13F | Lifestyle Asset Management, Inc. | 3.448 | 0,82 | 472 | -16,04 | ||||
| 2026-04-21 | 13F | Aaron Wealth Advisors LLC | 1.681 | 21,28 | 230 | 0,88 | ||||
| 2026-02-13 | 13F | Panagora Asset Management Inc | 0 | -100,00 | 0 | |||||
| 2026-04-20 | 13F | Hilton Head Capital Partners, LLC | 0 | -100,00 | 0 | |||||
| 2026-02-13 | 13F | Vontobel Holding Ltd. | 6.682 | -18,17 | 1.097 | -22,75 | ||||
| 2026-01-26 | 13F | La Banque Postale Asset Management SA | 0 | -100,00 | 0 | |||||
| 2026-02-19 | 13F | Mcguire Capital Advisors Inc | 18 | 3 | ||||||
| 2026-02-10 | 13F | Acadian Asset Management Llc | 541.617 | 45,03 | 89 | 37,50 | ||||
| 2026-02-11 | 13F | Allianz Asset Management GmbH | 53.305 | 3,26 | 8.753 | -2,50 | ||||
| 2026-04-24 | 13F | USS Investment Management Ltd | 13.631 | 0,69 | 1.865 | -16,15 | ||||
| 2026-02-11 | 13F | Zions Bancorporation, National Association /ut/ | 96 | 0,00 | 16 | -6,25 | ||||
| 2026-02-17 | 13F/A | Intesa Sanpaolo S.p.a. | 1.600 | 263 | ||||||
| 2026-02-17 | 13F | Russell Investments Group, Ltd. | 20.547 | -56,66 | 3.377 | -59,04 | ||||
| 2026-02-06 | 13F | Fairtree Asset Management (Pty) Ltd | 2.985 | 490 | ||||||
| 2026-02-11 | 13F | Harvest Fund Management Co., Ltd | 55.843 | -1,87 | 9 | 0,00 | ||||
| 2026-02-13 | 13F | Avenir Tech Ltd | 1 | 0,00 | 0 | |||||
| 2026-02-17 | 13F | Zurich Insurance Group Ltd/FI | 89.165 | -20,27 | 14.642 | -24,72 | ||||
| 2026-03-04 | 13F | SHP Wealth Management | 10 | 2 | ||||||
| 2026-04-20 | 13F | Ronald Blue Trust, Inc. | 1.151 | -11,94 | 157 | -26,64 | ||||
| 2026-04-24 | 13F | Retirement Systems of Alabama | 17.050 | -5,95 | 2.332 | -21,67 | ||||
| 2026-02-03 | 13F | SBI Securities Co., Ltd. | 920 | -45,50 | 151 | -48,46 | ||||
| 2026-02-06 | 13F | Pnc Financial Services Group, Inc. | 2.942 | 5,45 | 483 | -0,41 | ||||
| 2026-02-17 | 13F | Advisor Group Holdings, Inc. | 953 | 5,30 | 156 | -4,88 | ||||
| 2026-04-24 | 13F | Vision Financial Markets Llc | 75 | 0,00 | 10 | -16,67 | ||||
| 2026-02-03 | 13F | Diversify Wealth Management, Llc | 9.466 | 5,62 | 1.742 | 0,11 | ||||
| 2026-01-27 | 13F | Zurcher Kantonalbank (Zurich Cantonalbank) | 23.830 | -3,73 | 3.913 | -9,08 | ||||
| 2026-04-08 | 13F | E Fund Management (Hong Kong) Co., Ltd. | 145 | 20 | ||||||
| 2026-04-13 | 13F | Creative Financial Designs Inc /adv | 0 | -100,00 | 0 | |||||
| 2026-02-13 | 13F | Pinnacle Wealth Planning Services, Inc. | 537 | 88 | ||||||
| 2026-02-17 | 13F | Parallax Volatility Advisers, L.P. | Put | 127.900 | 149,32 | 21.002 | 135,42 | |||
| 2026-02-02 | 13F | APEIRON CAPITAL Ltd | 0 | -100,00 | 0 | |||||
| 2026-02-17 | 13F | Parallax Volatility Advisers, L.P. | Call | 85.900 | -17,24 | 14.106 | -21,86 | |||
| 2026-02-12 | 13F | Voya Investment Management Llc | 26.177 | -82,08 | 4.299 | -83,08 | ||||
| 2026-02-17 | 13F | Lighthouse Investment Partners, LLC | 16.804 | 2.759 | ||||||
| 2026-02-02 | 13F | Truist Financial Corp | 0 | -100,00 | 0 | |||||
| 2026-02-13 | 13F | Parkside Financial Bank & Trust | 301 | 30.000,00 | 49 | |||||
| 2026-01-28 | 13F | Oversea-Chinese Banking CORP Ltd | 37.648 | 225,76 | 6.182 | 207,82 | ||||
| 2025-11-13 | 13F | Canada Pension Plan Investment Board | 0 | -100,00 | 0 | -100,00 | ||||
| 2026-02-10 | 13F | Eurizon Capital SGR S.p.A. | 15.212 | 2.499 | ||||||
| 2026-02-12 | 13F | Commonwealth Equity Services, Llc | 2.346 | 385 | ||||||
| 2026-04-07 | 13F | Farther Finance Advisors, LLC | 395 | 19,34 | 55 | 1,85 | ||||
| 2026-02-05 | 13F | Central Asset Investments & Management Holdings (HK) Ltd | 15.768 | -8,71 | 2.589 | -13,79 | ||||
| 2026-04-07 | 13F | CoreCap Advisors, LLC | 0 | -100,00 | 0 | |||||
| 2025-10-28 | 13F | BRYN MAWR TRUST Co | 84 | 0,00 | 15 | 40,00 | ||||
| 2026-01-27 | 13F | Asset Management One Co., Ltd. | 24.953 | 3,53 | 4.143 | -1,17 | ||||
| 2026-02-17 | 13F | Delaware Management Holdings, Inc. | 3.036 | 499 | ||||||
| 2026-02-17 | 13F | Qube Research & Technologies Ltd | 103.920 | -45,91 | 17.065 | -48,93 | ||||
| 2026-02-13 | 13F | Quinn Opportunity Partners LLC | 16.000 | 0,00 | 2.627 | -5,57 | ||||
| 2026-01-20 | 13F | Cromwell Holdings LLC | 339 | 0,00 | 56 | -5,17 | ||||
| 2026-02-10 | 13F | Bank of New York Mellon Corp | 144.331 | 1,22 | 23.701 | -4,43 | ||||
| 2026-02-19 | 13F | CI Private Wealth, LLC | 1.489 | 0,81 | 242 | -5,47 | ||||
| 2026-02-04 | 13F | Bailard, Inc. | 0 | -100,00 | 0 | |||||
| 2026-03-02 | 13F | Tobam | 58 | 0 | ||||||
| 2026-02-20 | 13F | Dorsey Wright & Associates | 10.494 | 3,51 | 1.723 | -2,27 | ||||
| 2026-02-17 | 13F | Boothbay Fund Management, Llc | 0 | -100,00 | 0 | |||||
| 2025-11-14 | 13F | Wetherby Asset Management Inc | 2.485 | -0,28 | 432 | 40,72 | ||||
| 2026-04-24 | 13F | Sumitomo Mitsui DS Asset Management Company, Ltd | 15.635 | 1,84 | 2.138 | -15,19 | ||||
| 2026-02-10 | 13F | Goldman Sachs Group Inc | 452.070 | -14,63 | 74.234 | -19,39 | ||||
| 2026-01-29 | 13F | UBS Group AG | Put | 15.000 | -80,47 | 2.463 | -81,56 | |||
| 2026-01-29 | 13F | UBS Group AG | Call | 714.883 | -3,32 | 117.391 | -8,71 | |||
| 2026-01-29 | 13F | UBS Group AG | 772.149 | 45,88 | 126.795 | 37,74 | ||||
| 2026-02-13 | 13F | Walleye Trading LLC | Call | 161.100 | -2,01 | 26.454 | -7,47 | |||
| 2026-04-16 | 13F | Franchise GP Ltd | 29.330 | 4.011 | ||||||
| 2026-02-13 | 13F | Walleye Trading LLC | 266.517 | 10,77 | 43.765 | 4,59 | ||||
| 2026-02-13 | 13F | Walleye Trading LLC | Put | 253.700 | 6,78 | 41.660 | 0,82 | |||
| 2026-01-27 | 13F | Bayforest Capital Ltd | 0 | -100,00 | 0 | |||||
| 2026-02-02 | 13F | Qrg Capital Management, Inc. | 3.269 | -57,92 | 537 | -60,33 | ||||
| 2026-01-28 | 13F | Salomon & Ludwin, LLC | 51 | 0,00 | 9 | 12,50 | ||||
| 2026-02-13 | 13F | Umb Bank N A/mo | 26 | 0,00 | 4 | 0,00 | ||||
| 2026-02-17 | 13F | Numerai GP LLC | 0 | -100,00 | 0 | |||||
| 2026-01-22 | 13F | Massachusetts Financial Services Co /ma/ | 11.056 | 1.816 | ||||||
| 2026-02-10 | 13F | Td Asset Management Inc | 19.760 | -5,75 | 3.245 | -11,03 | ||||
| 2026-01-27 | 13F | Optas, LLC | 1.359 | -50,55 | 223 | -53,25 | ||||
| 2026-02-13 | 13F | Mariner, LLC | 17.391 | 5,87 | 2.856 | -0,04 | ||||
| 2026-02-11 | 13F | LPL Financial LLC | 24.018 | 36,19 | 3.944 | 28,56 | ||||
| 2026-02-17 | 13F | Fmr Llc | 3.485.777 | 20,90 | 572.400 | 14,15 | ||||
| 2026-02-13 | 13F | Victory Capital Management Inc | 10.042 | 139,10 | 1.649 | 673,71 | ||||
| 2026-02-17 | 13F | Toronto Dominion Bank | 20.907 | 138,07 | 3.432 | 124,75 | ||||
| 2026-02-17 | 13F | Alliancebernstein L.p. | 46.748 | 312,86 | 7.676 | 289,84 | ||||
| 2026-02-13 | 13F | Eschler Asset Management LLP | 11.000 | 1.806 | ||||||
| 2026-02-11 | 13F | Prudential Plc | 61.258 | -42,18 | 10.059 | -45,41 | ||||
| 2026-02-12 | 13F | Jane Street Group, Llc | 0 | -100,00 | 0 | -100,00 | ||||
| 2026-02-17 | 13F | California State Teachers Retirement System | 64.386 | -11,02 | 10.573 | -15,99 | ||||
| 2026-02-17 | 13F | Cederberg Capital Ltd | 181.105 | 0,00 | 31 | 0,00 | ||||
| 2026-02-12 | 13F | Federated Hermes, Inc. | 8.188 | -9,05 | 1.345 | -14,12 | ||||
| 2026-02-13 | 13F | Aspex Management (HK) Ltd | 3.371.597 | 37,51 | 554 | 29,81 | ||||
| 2026-02-05 | 13F | Td Private Client Wealth Llc | 152 | -38,46 | 25 | -42,86 | ||||
| 2026-02-09 | 13F | Mediolanum International Funds Ltd | 24.597 | 8,39 | 4.065 | 3,17 | ||||
| 2026-04-06 | 13F | Versant Capital Management, Inc | 1.059 | 10,89 | 145 | -7,69 | ||||
| 2026-04-23 | 13F | SJS Investment Consulting Inc. | 0 | -100,00 | 0 | |||||
| 2026-02-17 | 13F | Public Employees Retirement System Of Ohio | 19.148 | 68,30 | 3.144 | 58,95 | ||||
| 2026-01-28 | 13F | Klp Kapitalforvaltning As | 46.500 | 87,50 | 7.636 | 77,06 | ||||
| 2026-02-17 | 13F | Tower Research Capital LLC (TRC) | 455 | 78,43 | 75 | 68,18 | ||||
| 2026-02-13 | 13F | Royal London Asset Management Ltd | 2.747 | -14,85 | 451 | -19,61 | ||||
| 2026-02-11 | 13F | Erste Asset Management GmbH | 10.000 | 1.660 | ||||||
| 2026-02-13 | 13F | Ubs Oconnor Llc | 36.021 | 5.915 | ||||||
| 2025-11-07 | 13F | Shell Asset Management Co | 1.413 | -68,16 | 0 | |||||
| 2026-02-11 | 13F | O'shaughnessy Asset Management, Llc | 2.496 | -4,07 | 410 | -9,51 | ||||
| 2026-02-17 | 13F | Two Sigma Advisers, Lp | 144.200 | -43,74 | 23.679 | -46,88 | ||||
| 2026-02-13 | 13F | Charles Schwab Investment Management Inc | 62.372 | -6,23 | 10.242 | -11,46 | ||||
| 2025-11-13 | 13F | Quantitative Investment Management, LLC | 0 | -100,00 | 0 | -100,00 | ||||
| 2026-02-06 | 13F | Csenge Advisory Group | 1.676 | 16,15 | 275 | 10,00 | ||||
| 2026-02-13 | 13F | Korea Investment CORP | 266.855 | 176,30 | 43.820 | 160,90 | ||||
| 2026-03-24 | 13F/A | Barclays Plc | Put | 0 | -100,00 | 0 | -100,00 | |||
| 2026-03-24 | 13F/A | Barclays Plc | Call | 0 | -100,00 | 0 | -100,00 | |||
| 2026-02-12 | 13F | Quadrant Capital Group Llc | 6.530 | -0,14 | 1.072 | -5,72 | ||||
| 2026-04-06 | 13F | GAMMA Investing LLC | 1.066 | 8,11 | 146 | -9,94 | ||||
| 2026-02-17 | 13F | Quantinno Capital Management LP | 45.854 | 6,14 | 7.530 | 0,21 | ||||
| 2026-04-16 | 13F | XML Financial, LLC | 1.900 | -16,30 | 260 | -30,38 | ||||
| 2025-11-14 | 13F | Capula Management Ltd | 0 | -100,00 | 0 | -100,00 | ||||
| 2026-02-13 | 13F | Smartleaf Asset Management LLC | 700 | 207,02 | 116 | 194,87 | ||||
| 2026-02-17 | 13F | Janus Henderson Group Plc | 39.177 | -7,58 | 6.434 | -12,69 | ||||
| 2026-02-20 | 13F/A | Capital Markets Trading UK LLP | Put | 113.100 | 0,00 | 19 | -5,26 | |||
| 2026-02-20 | 13F/A | Capital Markets Trading UK LLP | Call | 52.000 | 0,00 | 9 | -11,11 | |||
| 2026-02-17 | 13F | DZ BANK AG Deutsche Zentral Genossenschafts Bank, Frankfurt am Main | 0 | -100,00 | 0 | |||||
| 2026-01-29 | 13F | Sanctuary Advisors, LLC | 8.735 | -4,90 | 1.434 | 52,55 | ||||
| 2026-02-26 | 13F | TD Capital Management LLC | 1 | 0 | ||||||
| 2026-02-13 | 13F | Centiva Capital, LP | Call | 7.600 | 0,00 | 1.248 | -5,60 | |||
| 2026-02-13 | 13F | Centiva Capital, LP | Put | 26.300 | 0,00 | 4.319 | -5,58 | |||
| 2026-02-11 | 13F | GW&K Investment Management, LLC | 10 | 0 | ||||||
| 2026-02-17 | 13F | Nomura Holdings Inc | 69.744 | -10,62 | 11.453 | -15,61 | ||||
| 2026-02-03 | 13F | Sequoia Financial Advisors, LLC | 4.316 | -0,05 | 709 | -5,60 | ||||
| 2026-02-10 | 13F | Nomura Asset Management Co Ltd | 19.877 | -10,52 | 3.264 | -15,51 | ||||
| 2026-02-17 | 13F | Veritas Asset Management LLP | 0 | -100,00 | 0 | |||||
| 2026-02-17 | 13F | XTX Topco Ltd | 11.776 | -36,62 | 1.934 | |||||
| 2026-02-13 | 13F | MAI Capital Management | 58 | 26,09 | 10 | 12,50 | ||||
| 2026-02-05 | 13F | Allworth Financial LP | 43 | -18,87 | 7 | -22,22 | ||||
| 2026-02-17 | 13F | Munro Partners | 39.150 | 6.429 | ||||||
| 2026-01-16 | 13F | Standard Life Aberdeen plc | 50.219 | 19,07 | 8.246 | 13,11 | ||||
| 2026-02-13 | 13F | Integrated Wealth Concepts LLC | 0 | -100,00 | 0 | |||||
| 2026-02-17 | 13F | MIRAE ASSET GLOBAL ETFS HOLDINGS Ltd. | 5.546 | 1.223,63 | 911 | 1.165,28 | ||||
| 2026-02-09 | 13F | AIA Group Ltd | 6.606 | 200,55 | 1.085 | 183,77 | ||||
| 2026-02-17 | 13F | Wellington Management Group Llp | 49.024 | 118,00 | 8.050 | 105,88 | ||||
| 2026-01-29 | 13F | IMC-Chicago, LLC | 63.628 | 59,13 | 10.448 | 50,27 | ||||
| 2026-01-29 | 13F | IMC-Chicago, LLC | Put | 343.400 | -28,23 | 56.390 | -32,24 | |||
| 2026-01-29 | 13F | IMC-Chicago, LLC | Call | 284.200 | -44,25 | 46.668 | -47,36 | |||
| 2026-02-13 | 13F | Kestra Advisory Services, LLC | 0 | -100,00 | 0 | |||||
| 2026-02-11 | 13F | Deutsche Bank Ag\ | 350.000 | -37,04 | 57.474 | -40,56 | ||||
| 2026-02-13 | 13F | Pathstone Holdings, LLC | 8.222 | -2,66 | 1.350 | -8,10 | ||||
| 2026-04-15 | 13F | Exchange Traded Concepts, Llc | 19.588 | -19,75 | 2.679 | -33,18 | ||||
| 2026-02-12 | 13F | DRW Securities, LLC | 0 | -100,00 | 0 | |||||
| 2026-02-17 | 13F | Voloridge Investment Management, Llc | 150.807 | -63,94 | 24.764 | -65,96 | ||||
| 2026-02-17 | 13F | Millennium Management Llc | 108.914 | 137,37 | 17.885 | 124,14 | ||||
| 2026-02-17 | 13F | Balyasny Asset Management Llc | Put | 20.800 | 3.416 | |||||
| 2026-02-12 | 13F | Federation des caisses Desjardins du Quebec | 3.452 | -39,29 | 567 | -42,71 | ||||
| 2026-02-17 | 13F | Balyasny Asset Management Llc | 62.494 | 10.262 | ||||||
| 2026-02-10 | 13F | Parametrica Management Ltd | 39.834 | 91,20 | 6.541 | 80,54 | ||||
| 2026-02-17 | 13F | Millennium Management Llc | Call | 9.400 | 91,84 | 1.544 | 81,10 | |||
| 2026-04-06 | 13F | Highline Wealth Partners Llc | 6 | 0,00 | 1 | |||||
| 2026-02-12 | 13F | Nuveen, LLC | 140.597 | -7,45 | 23.087 | -12,61 | ||||
| 2026-02-17 | 13F | Millennium Management Llc | Put | 52.900 | -21,04 | 8.687 | -25,45 | |||
| 2026-02-17 | 13F | State Of Wisconsin Investment Board | 25.580 | -36,18 | 4.200 | -39,74 | ||||
| 2026-02-17 | 13F | Balyasny Asset Management Llc | Call | 2.400 | 394 | |||||
| 2026-02-17 | 13F | Ameriprise Financial Inc | 164.568 | 7,94 | 27.024 | 1,92 | ||||
| 2026-02-18 | 13F | VGI Partners Ltd | 0 | -100,00 | 0 | |||||
| 2026-02-13 | 13F | Walleye Capital LLC | Call | 56.900 | 260,13 | 9.344 | 240,12 | |||
| 2026-02-13 | 13F | Walleye Capital LLC | Put | 102.700 | 132,88 | 16.864 | 119,90 | |||
| 2026-02-13 | 13F | National Bank Of Canada /fi/ | 888.120 | 11,37 | 145.838 | 5,16 | ||||
| 2026-02-13 | 13F | Walleye Capital LLC | 24.186 | 177,14 | 3.972 | 161,77 | ||||
| 2025-11-21 | 13F | Yunqi Capital Ltd | 0 | -100,00 | 0 | |||||
| 2026-04-07 | 13F | Signaturefd, Llc | 3.070 | 0,89 | 420 | -16,03 | ||||
| 2026-01-28 | 13F | DekaBank Deutsche Girozentrale | 7.408 | 0,00 | 1 | -100,00 | ||||
| 2026-02-06 | 13F | Global Retirement Partners, LLC | 987 | 84,83 | 162 | 76,09 | ||||
| 2026-02-13 | 13F | PCM Encore, LLC | 3.679 | 604 | ||||||
| 2026-02-09 | 13F/A | Swedbank AB | 68.000 | 6,58 | 11.166 | 0,64 |