Grundlæggende statistik
| Institutionelle ejere | 161 total, 152 long only, 0 short only, 9 long/short - change of -5,29% MRQ |
| Gennemsnitlig porteføljeallokering | 0.3566 % - change of -51,11% MRQ |
| Institutionelle aktier (lange) | 104.459.286 (ex 13D/G) - change of -43,88MM shares -29,58% MRQ |
| Institutionel værdi (lang) | $ 1.491.584 USD ($1000) |
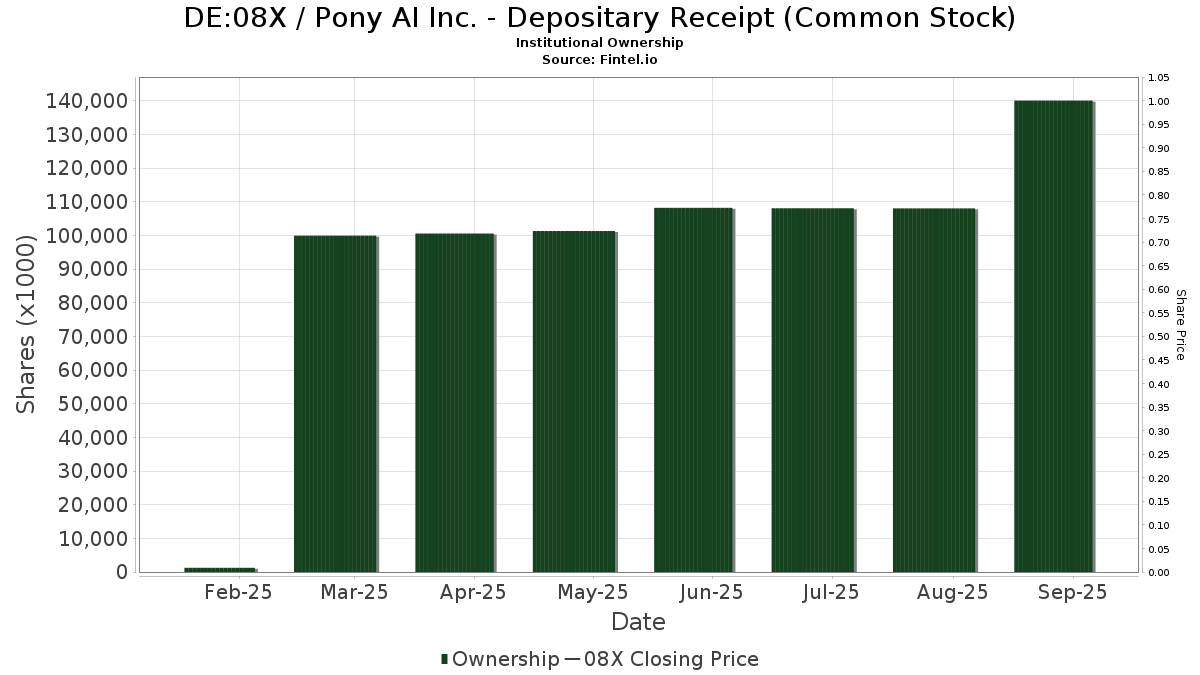
Institutionelt ejerskab og aktionærer
Pony AI Inc. - Depositary Receipt (Common Stock) (DE:08X) har 161 institutionelle ejere og aktionærer, der har indsendt 13D/G- eller 13F-formularer til Securities Exchange Commission (SEC). Disse institutioner har i alt 104,459,286 aktier. Største aktionærer omfatter Fmr Llc, Ontario Teachers Pension Plan Board, Baillie Gifford & Co, Point72 Hong Kong Ltd, MIRAE ASSET GLOBAL ETFS HOLDINGS Ltd., Aspex Management (HK) Ltd, Exor Capital LLP, Point72 Asset Management, L.P., Morgan Stanley, and Tiger Global Management Llc .
Pony AI Inc. - Depositary Receipt (Common Stock) (DUSE:08X) institutionel ejerskabsstruktur viser aktuelle positioner i virksomheden efter institutioner og fonde, samt seneste ændringer i positionsstørrelse. Større aktionærer kan omfatte individuelle investorer, investeringsforeninger, hedgefonde eller institutioner. Skema 13D angiver, at investoren besidder (eller besidder) mere end 5 % af virksomheden og har til hensigt (eller har til hensigt at) aktivt at forfølge en ændring i forretningsstrategi. Skema 13G indikerer en passiv investering på over 5%.
Fondens stemningsscore
Fund Sentiment Score (fka Ownership Accumulation Score) finder de aktier, der bliver mest købt af fonde. Det er resultatet af en sofistikeret, multi-faktor kvantitativ model, der identificerer virksomheder med de højeste niveauer af institutionel akkumulering. Scoringsmodellen bruger en kombination af den samlede stigning i oplyste ejere, ændringerne i porteføljeallokeringer i disse ejere og andre målinger. Tallet går fra 0 til 100, hvor højere tal indikerer et højere niveau af akkumulering for sine jævnaldrende, og 50 er gennemsnittet.
Opdateringsfrekvens: Dagligt
Se Ownership Explorer, som giver en liste over højest rangerende virksomheder.
AI+ Ask Fintel’s AI assistant about Pony AI Inc. - Depositary Receipt (Common Stock).
Select a question to share a public post with an AI-crafted answer.
Thinking of good questions…
13F og NPORT arkivering
Detaljer om 13F-arkivering er gratis. Detaljer om NP-ansøgninger kræver et premium-medlemskab. Grønne rækker angiver nye positioner. Røde rækker angiver lukkede positioner. Klik på linket ikon for at se den fulde transaktionshistorik.
Opgrader
for at låse premium-data op og eksportere til Excel ![]() .
.
| Fil dato | Kilde | Investor | Type | Gennemsnitlig pris (Øst) |
Aktier | Δ Aktier (%) |
Rapporteret Værdi ($1000) |
Δ Værdi (%) |
Port Alloc (%) |
|
|---|---|---|---|---|---|---|---|---|---|---|
| 2026-02-12 | 13F | Marex Group plc | 566.871 | 8.220 | ||||||
| 2025-09-26 | NP | FBGRX - Fidelity Blue Chip Growth Fund This fund is a listed as child fund of Fmr Llc and if that institution has disclosed ownership in this security, then these positions will not be double counted when calculating total shares and total value | 1.921.873 | 49,95 | 25.830 | 121,71 | ||||
| 2026-02-11 | 13F | Group One Trading, L.p. | 21.705 | -73,32 | 315 | -82,83 | ||||
| 2025-11-14 | 13F | Yaupon Capital Management LP | 0 | -100,00 | 0 | -100,00 | ||||
| 2026-01-12 | 13F | Horizon Financial Services, Llc | 1.000 | 0,00 | 14 | -36,36 | ||||
| 2026-02-17 | 13F | Balyasny Asset Management Llc | Put | 250.000 | 0,00 | 3.625 | -35,52 | |||
| 2026-02-17 | 13F | Balyasny Asset Management Llc | 414.819 | 61,27 | 6.015 | 3,98 | ||||
| 2025-11-13 | 13F | Mission Creek Capital Partners, Inc. | 0 | -100,00 | 0 | |||||
| 2026-02-06 | 13F | EverSource Wealth Advisors, LLC | 0 | -100,00 | 0 | |||||
| 2025-09-23 | NP | MYINX - MainStay MacKay International Opportunities Fund Investor Class | 16.208 | 4,91 | 218 | 55,00 | ||||
| 2026-02-13 | 13F | Walleye Trading LLC | Put | 24.100 | -83,48 | 349 | -89,36 | |||
| 2026-02-17 | 13F | Lighthouse Investment Partners, LLC | 19.828 | -19,78 | 288 | -48,29 | ||||
| 2026-02-13 | 13F | Golden State Wealth Management, LLC | 100 | 0,00 | 1 | -50,00 | ||||
| 2026-02-13 | 13F | Walleye Trading LLC | Call | 176.400 | 51,03 | 2.558 | -2,63 | |||
| 2025-09-25 | NP | TLTE - FlexShares Morningstar Emerging Markets Factor Tilt Index Fund | 2.208 | 30 | ||||||
| 2026-02-17 | 13F | Cresset Asset Management, LLC | 102.991 | 2,49 | 1.493 | -33,94 | ||||
| 2026-02-13 | 13F | Rhumbline Advisers | 5 | 0 | ||||||
| 2026-02-17 | 13F | Cetera Investment Advisers | 25.019 | 111,74 | 363 | 36,60 | ||||
| 2026-02-17 | 13F | Tiger Global Management Llc | 2.900.000 | 683,78 | 42.050 | 405,35 | ||||
| 2025-10-15 | 13F | Cwm, Llc | 0 | -100,00 | 0 | |||||
| 2026-02-17 | 13F | Susquehanna International Group, Llp | 1.026.591 | 14.886 | ||||||
| 2025-09-26 | NP | PGJ - Invesco Golden Dragon China ETF This fund is a listed as child fund of Invesco Ltd. and if that institution has disclosed ownership in this security, then these positions will not be double counted when calculating total shares and total value | 15.399 | 207 | ||||||
| 2026-02-17 | 13F | Susquehanna International Group, Llp | Put | 216.600 | -53,65 | 3.141 | -70,12 | |||
| 2026-02-17 | 13F | Susquehanna International Group, Llp | Call | 210.200 | -92,91 | 3.048 | -95,43 | |||
| 2025-11-13 | 13F | MY.Alpha Management HK Advisors Ltd | 0 | -100,00 | 0 | |||||
| 2026-02-13 | 13F | Hel Ved Capital Management Ltd | 778.879 | 47,52 | 11.294 | -4,89 | ||||
| 2025-11-14 | 13F | Point72 (DIFC) Ltd | 0 | -100,00 | 0 | -100,00 | ||||
| 2026-02-17 | 13F | Millennium Management Llc | 687.817 | 9.973 | ||||||
| 2026-02-13 | 13F | Clear Street Group Inc. | 381.068 | 19,31 | 5.525 | -23,08 | ||||
| 2025-11-10 | 13F | Eleva Capital SAS | 68.462 | -13,10 | 1.540 | 48,12 | ||||
| 2026-01-30 | 13F | Delta Investment Management, LLC | 10.100 | 0,00 | 146 | -35,68 | ||||
| 2026-02-13 | 13F | Walleye Capital LLC | 51.020 | 740 | ||||||
| 2026-02-13 | 13F | Walleye Capital LLC | Call | 65.400 | -64,57 | 948 | -77,16 | |||
| 2026-01-21 | 13F | Sound Income Strategies, LLC | 300 | 5 | ||||||
| 2026-02-11 | 13F | Allianz Asset Management GmbH | 42.287 | 75,08 | 613 | 12,89 | ||||
| 2026-02-12 | 13F | Banco BTG Pactual S.A. | 0 | -100,00 | 0 | |||||
| 2026-02-12 | 13F | Principal Securities, Inc. | 0 | -100,00 | 0 | |||||
| 2026-02-17 | 13F | Symmetry Peak Management Llc | Call | 0 | -100,00 | 0 | ||||
| 2026-02-13 | 13F | Wexford Capital Lp | 98.627 | 2,74 | 1.430 | -33,77 | ||||
| 2026-02-13 | 13F | Walleye Capital LLC | Put | 39.000 | -84,57 | 566 | -90,06 | |||
| 2025-11-07 | 13F | Gf Fund Management Co. Ltd. | 0 | -100,00 | 0 | -100,00 | ||||
| 2025-11-04 | 13F | IMC-Chicago, LLC | 0 | -100,00 | 0 | -100,00 | ||||
| 2026-02-09 | 13F | Themes Management Co LLC | 25.101 | 364 | ||||||
| 2026-02-23 | 13F | Virtu Financial LLC | 50.738 | 92,03 | 1 | |||||
| 2025-09-26 | NP | BKEM - BNY Mellon Emerging Markets Equity ETF | 962 | -43,51 | 13 | -20,00 | ||||
| 2026-02-17 | 13F | D. E. Shaw & Co., Inc. | 54.586 | 29,46 | 791 | -16,56 | ||||
| 2026-02-11 | 13F | Havemeyer Place LP | 11.786 | 171 | ||||||
| 2026-02-13 | 13F | Y-Intercept (Hong Kong) Ltd | 23.787 | -94,37 | 345 | -96,38 | ||||
| 2026-02-13 | 13F | Keystone Investors Pte Ltd | 668.658 | 202,00 | 9.696 | 94,72 | ||||
| 2025-09-26 | NP | FPBFX - Fidelity Pacific Basin Fund This fund is a listed as child fund of Fmr Llc and if that institution has disclosed ownership in this security, then these positions will not be double counted when calculating total shares and total value | 333.056 | 89,56 | 4.476 | 180,28 | ||||
| 2026-02-11 | 13F | Krane Funds Advisors LLC | 35.568 | 516 | ||||||
| 2026-02-17 | 13F | Masters Capital Management Llc | Call | 750.000 | 10.875 | |||||
| 2026-02-17 | 13F | Masters Capital Management Llc | 1.200.000 | 20,00 | 17.400 | -22,63 | ||||
| 2026-02-06 | 13F | Handelsbanken Fonder AB | 13.700 | 0 | ||||||
| 2026-02-13 | 13F | Citigroup Inc | 193.128 | 73,03 | 2.800 | 11,55 | ||||
| 2026-01-30 | 13F | TMT General Partner Ltd | 1.917.414 | -39,20 | 27.803 | -60,80 | ||||
| 2026-02-17 | 13F | Point72 Asset Management, L.P. | 3.209.963 | 43,96 | 46.544 | -7,19 | ||||
| 2026-02-12 | 13F | AlphaCentric Advisors LLC | 25.000 | 362 | ||||||
| 2025-11-17 | 13F | Johns Hopkins University | 0 | -100,00 | 0 | -100,00 | ||||
| 2026-02-12 | 13F | Hrt Financial Lp | 47.353 | -91,48 | 1 | -100,00 | ||||
| 2025-11-14 | 13F | DRW Securities, LLC | Call | 0 | -100,00 | 0 | ||||
| 2026-02-13 | 13F | SC CHINA HOLDING Ltd | 0 | -100,00 | 0 | -100,00 | ||||
| 2026-02-17 | 13F | Capital Fund Management S.a. | Call | 55.900 | -72,89 | 811 | -82,53 | |||
| 2026-02-17 | 13F | Capital Fund Management S.a. | Put | 58.600 | -63,19 | 850 | -76,28 | |||
| 2026-02-13 | 13F | Hudson Bay Capital Management LP | 66.149 | -70,14 | 959 | -80,75 | ||||
| 2026-02-12 | 13F | BlackRock, Inc. | 3.801 | -91,00 | 55 | -94,21 | ||||
| 2026-02-10 | 13F | CIBC World Markets Inc. | 29.754 | -0,43 | 431 | -35,86 | ||||
| 2026-02-17 | 13F | Royal Bank Of Canada | 5.594 | -29,32 | 81 | -54,49 | ||||
| 2026-01-30 | 13F | Pekin Hardy Strauss, Inc. | 0 | -100,00 | 0 | -100,00 | ||||
| 2026-02-13 | 13F | Colony Group, LLC | 21.906 | -6,41 | 318 | -39,73 | ||||
| 2026-02-12 | 13F | Federation des caisses Desjardins du Quebec | 5.953 | -16,23 | 86 | -45,91 | ||||
| 2025-09-26 | NP | FBCG - Fidelity Blue Chip Growth ETF This fund is a listed as child fund of Fmr Llc and if that institution has disclosed ownership in this security, then these positions will not be double counted when calculating total shares and total value | 204.457 | 5,59 | 2.748 | 56,08 | ||||
| 2025-11-07 | 13F | Sierra Ocean, Llc | 0 | -100,00 | 0 | |||||
| 2026-02-10 | 13F | Goldman Sachs Group Inc | 242.724 | -69,24 | 3.519 | -80,17 | ||||
| 2026-01-23 | 13F | Assetmark, Inc | 64 | 72,97 | 1 | |||||
| 2025-11-14 | 13F | Strategic Wealth Partners, Ltd. | 124 | 3 | ||||||
| 2026-01-26 | 13F | Mirae Asset Global Investments Co., Ltd. | 898.409 | 7,37 | 13.027 | -30,78 | ||||
| 2026-02-12 | 13F | Lansforsakringar Fondforvaltning AB (publ) | 84.359 | 49,08 | 1.223 | -3,85 | ||||
| 2026-02-10 | 13F | Daiwa Securities Group Inc. | 4.561 | 2,26 | 0 | |||||
| 2025-11-14 | 13F | Peak6 Llc | 0 | -100,00 | 0 | -100,00 | ||||
| 2025-10-29 | 13F | HHM Wealth Advisors, LLC | 0 | -100,00 | 0 | |||||
| 2026-02-10 | 13F | Exor Capital LLP | 4.107.512 | 72,59 | 59.559 | 11,28 | ||||
| 2026-01-08 | 13F | Neumann Advisory Hong Kong Ltd | 0 | -100,00 | 0 | |||||
| 2026-02-13 | 13F | Pathstone Holdings, LLC | 31.338 | 454 | ||||||
| 2026-02-17 | 13F | Voloridge Investment Management, Llc | 0 | -100,00 | 0 | |||||
| 2026-02-12 | 13F | CIBC Private Wealth Group, LLC | 544 | 0,00 | 8 | -41,67 | ||||
| 2026-02-17 | 13F | Ghisallo Capital Management LLC | 0 | -100,00 | 0 | -100,00 | ||||
| 2025-09-29 | NP | EVAV - Direxion Daily Electric and Autonomous Vehicles Bull 2X Shares | 20.423 | 274 | ||||||
| 2026-02-17 | 13F | Bank Of America Corp /de/ | 296.720 | 553,58 | 4.302 | 321,35 | ||||
| 2026-02-17 | 13F | Quadrature Capital Ltd | 0 | -100,00 | 0 | |||||
| 2026-02-13 | 13F | Peak6 Llc | Call | 0 | -100,00 | 0 | ||||
| 2026-02-11 | 13F | Deutsche Bank Ag\ | 1.151 | 16,62 | 17 | -27,27 | ||||
| 2026-02-17 | 13F | SageView Advisory Group, LLC | 6 | 0 | ||||||
| 2025-11-14 | 13F | Common Fund For Nonprofit Organizations | 0 | -100,00 | 0 | |||||
| 2026-01-07 | 13F | Green Alpha Advisors, LLC | 42.708 | 619 | ||||||
| 2026-02-11 | 13F | LPL Financial LLC | 18.674 | 14,42 | 271 | -26,43 | ||||
| 2025-11-14 | 13F | Polymer Capital Management (US) LLC | Call | 0 | -100,00 | 0 | ||||
| 2026-02-09 | 13F | Harbour Investments, Inc. | 134 | 3,88 | 2 | -50,00 | ||||
| 2025-11-14 | 13F | Polymer Capital Management (US) LLC | 0 | -100,00 | 0 | |||||
| 2026-02-05 | 13F | Bank Julius Baer & Co. Ltd, Zurich | 54.000 | 783 | ||||||
| 2026-02-17 | 13F | Man Group plc | Call | 423.400 | 6.139 | |||||
| 2026-02-17 | 13F | Man Group plc | 148.161 | 168,23 | 2.148 | 72,95 | ||||
| 2026-02-10 | 13F | Bnp Paribas Arbitrage, Sa | 2.100 | 30 | ||||||
| 2025-11-14 | 13F | SRS Capital Advisors, Inc. | 0 | -100,00 | 0 | |||||
| 2026-02-13 | 13F | Verition Fund Management LLC | 915.346 | 13.273 | ||||||
| 2026-02-17 | 13F | Tudor Investment Corp Et Al | Call | 12.100 | 175 | |||||
| 2025-09-26 | NP | FBCGX - Fidelity Blue Chip Growth K6 Fund This fund is a listed as child fund of Fmr Llc and if that institution has disclosed ownership in this security, then these positions will not be double counted when calculating total shares and total value | 419.242 | 43,61 | 5.635 | 112,36 | ||||
| 2026-02-17 | 13F | Tudor Investment Corp Et Al | Put | 13.300 | 193 | |||||
| 2026-02-13 | 13F | Stifel Financial Corp | 83.334 | 1.208 | ||||||
| 2026-02-17 | 13F | D. E. Shaw & Co., Inc. | Put | 0 | -100,00 | 0 | ||||
| 2026-02-06 | 13F | Global Retirement Partners, LLC | 30 | 0 | ||||||
| 2026-02-06 | 13F | Profund Advisors Llc | 45.926 | 334,62 | 666 | 180,59 | ||||
| 2026-02-17 | 13F | D. E. Shaw & Co., Inc. | Call | 0 | -100,00 | 0 | ||||
| 2026-02-06 | 13F | Pnc Financial Services Group, Inc. | 130.000 | 333,33 | 1.885 | 179,67 | ||||
| 2026-02-06 | 13F | Leonteq Securities AG | 2.590 | 0,00 | 38 | -36,21 | ||||
| 2025-11-06 | 13F | Bp Plc | 0 | -100,00 | 0 | -100,00 | ||||
| 2026-02-13 | 13F | Toyota Motor Corp/ | 0 | -100,00 | 0 | -100,00 | ||||
| 2026-02-09 | 13F | Geode Capital Management, Llc | 11.318 | 0,00 | 164 | -35,43 | ||||
| 2026-02-17 | 13F | Advisor Group Holdings, Inc. | 5.649 | 19,63 | 82 | 12,50 | ||||
| 2026-02-13 | 13F | Carlyle Group Inc. | 2.362.447 | 0,00 | 34.255 | -35,53 | ||||
| 2026-01-14 | 13F | Nova Wealth Management, Inc. | 1 | 0,00 | 0 | |||||
| 2026-01-29 | 13F | UBS Group AG | Call | 75.000 | 219,15 | 1.088 | 105,87 | |||
| 2026-01-29 | 13F | UBS Group AG | 1.155.207 | -3,89 | 16.751 | -38,04 | ||||
| 2025-11-14 | 13F | Wolverine Trading, Llc | 77.343 | 128,36 | 1.757 | 280,30 | ||||
| 2025-11-14 | 13F | Wolverine Trading, Llc | Call | 183.100 | 52,71 | 4.160 | 154,12 | |||
| 2026-02-24 | 13F | Bell Investment Advisors, Inc | 38 | 0,00 | 1 | |||||
| 2025-11-14 | 13F | Wolverine Trading, Llc | Put | 144.000 | 48,61 | 3.272 | 147,24 | |||
| 2026-02-17 | 13F | XTX Topco Ltd | 0 | -100,00 | 0 | |||||
| 2026-02-06 | 13F | IFP Advisors, Inc | 6.051 | 784,65 | 88 | 480,00 | ||||
| 2026-02-11 | 13F | Nikko Asset Management Americas, Inc. | 1.974.499 | 28.630 | ||||||
| 2026-02-17 | 13F | Tower Research Capital LLC (TRC) | 3.331 | -52,44 | 48 | -69,43 | ||||
| 2026-02-17 | 13F | Shay Capital LLC | 20.000 | 290 | ||||||
| 2026-02-17 | 13F | Weiss Asset Management LP | 0 | -100,00 | 0 | -100,00 | ||||
| 2026-01-23 | 13F | Baillie Gifford & Co | 6.301.650 | -2,46 | 91.374 | -37,11 | ||||
| 2026-02-17 | 13F | BlueCrest Capital Management Ltd | Call | 0 | -100,00 | 0 | -100,00 | |||
| 2026-02-17 | 13F | FIL Ltd | 2.284.012 | 466,92 | 33.118 | 265,54 | ||||
| 2026-02-13 | 13F | Kestra Advisory Services, LLC | 5.151 | 75 | ||||||
| 2025-11-14 | 13F | Prudential Plc | 0 | -100,00 | 0 | -100,00 | ||||
| 2026-02-17 | 13F | Bamco Inc /ny/ | 2.586.581 | 10,76 | 37.505 | -28,59 | ||||
| 2026-02-13 | 13F | Ontario Teachers Pension Plan Board | 6.492.530 | 0,00 | 94.142 | -35,53 | ||||
| 2026-02-13 | 13F | Bridgefront Capital, LLC | 11.277 | 164 | ||||||
| 2025-10-21 | 13F | Tradewinds Capital Management, LLC | 0 | -100,00 | 0 | |||||
| 2026-02-13 | 13F | Centiva Capital, LP | 0 | -100,00 | 0 | -100,00 | ||||
| 2026-01-15 | 13F | Affinity Wealth Management Llc | 0 | -100,00 | 0 | |||||
| 2026-02-17 | 13F | Covalis Capital Llp | 0 | -100,00 | 0 | |||||
| 2026-02-13 | 13F | Marshall Wace, Llp | 2.502.711 | 36.289 | ||||||
| 2026-02-13 | 13F | Aspex Management (HK) Ltd | 4.140.447 | 0,00 | 60 | -35,48 | ||||
| 2026-02-13 | 13F | Eschler Asset Management LLP | 34.700 | -23,23 | 503 | -50,49 | ||||
| 2026-02-13 | 13F | Barclays Plc | Put | 0 | -100,00 | 0 | -100,00 | |||
| 2026-01-27 | 13F | Zurcher Kantonalbank (Zurich Cantonalbank) | 628 | 9 | ||||||
| 2026-02-17 | 13F | Flight Deck Capital, LP | 853.900 | 26,96 | 12.382 | -18,15 | ||||
| 2026-02-17 | 13F | Schonfeld Strategic Advisors LLC | 533.945 | 1.150,75 | 7.742 | 706,46 | ||||
| 2025-11-12 | 13F | HAP Trading, LLC | Call | 15.500 | 25 | |||||
| 2026-02-13 | 13F | IDG China Capital Fund III Associates L.P. | 0 | -100,00 | 0 | -100,00 | ||||
| 2025-09-26 | NP | FSBDX - Fidelity Series Blue Chip Growth Fund This fund is a listed as child fund of Fmr Llc and if that institution has disclosed ownership in this security, then these positions will not be double counted when calculating total shares and total value | 337.700 | 47,66 | 4.539 | 118,38 | ||||
| 2026-02-17 | 13F | Nomura Holdings Inc | 66.940 | 426,92 | 971 | 240,35 | ||||
| 2026-01-23 | 13F | Farther Finance Advisors, LLC | 380 | 406,67 | 6 | 400,00 | ||||
| 2025-10-24 | 13F | JGP Global Gestao de Recursos Ltda. | 0 | -100,00 | 0 | |||||
| 2025-11-12 | 13F | Erste Asset Management GmbH | 6 | 280 | ||||||
| 2026-02-06 | 13F | Carrhae Capital LLP | 0 | -100,00 | 0 | |||||
| 2026-02-17 | 13F | Temasek Holdings (Private) Ltd | 14.510 | 0,00 | 210 | -35,58 | ||||
| 2025-11-14 | 13F | Luminist Capital LLC | 0 | -100,00 | 0 | -100,00 | ||||
| 2026-02-17 | 13F | Scientech Research LLC | 0 | -100,00 | 0 | |||||
| 2026-02-17 | 13F | Ameriprise Financial Inc | 10.831 | -1,43 | 157 | -36,44 | ||||
| 2026-02-17 | 13F | Citadel Advisors Llc | Put | 456.200 | -52,89 | 6.615 | -69,63 | |||
| 2026-02-17 | 13F | Citadel Advisors Llc | Call | 345.700 | -69,16 | 5.013 | -80,12 | |||
| 2026-02-17 | 13F | Legend Capital Advisors LLC | 21.980 | 319 | ||||||
| 2026-02-17 | 13F | Wellington Management Group Llp | 2.840.863 | 30,96 | 41.193 | -15,57 | ||||
| 2026-02-17 | 13F | Citadel Advisors Llc | 2.607.874 | 14,08 | 37.814 | -26,45 | ||||
| 2026-02-13 | 13F | National Bank Of Canada /fi/ | 0 | -100,00 | 0 | |||||
| 2026-02-03 | 13F | SBI Securities Co., Ltd. | 19.127 | -3,76 | 277 | -37,89 | ||||
| 2026-02-17 | 13F | Two Sigma Investments, Lp | 0 | -100,00 | 0 | |||||
| 2026-02-12 | 13F | Ci Investments Inc. | 0 | -100,00 | 0 | |||||
| 2026-02-17 | 13F | Alliancebernstein L.p. | 218.737 | 40,33 | 3.172 | -9,53 | ||||
| 2026-02-13 | 13F | Toroso Investments, LLC | Put | 0 | -100,00 | 0 | -100,00 | |||
| 2026-02-13 | 13F | Toroso Investments, LLC | 0 | -100,00 | 0 | -100,00 | ||||
| 2025-09-29 | NP | TRFM - AAM Transformers ETF | 0 | -100,00 | 0 | -100,00 | ||||
| 2026-02-17 | 13F | Cantor Fitzgerald, L. P. | 0 | -100,00 | 0 | |||||
| 2026-02-17 | 13F | Mubadala Investment Co PJSC | 0 | -100,00 | 0 | -100,00 | ||||
| 2026-01-09 | 13F | SG Americas Securities, LLC | 543.825 | 10.441,29 | 8 | |||||
| 2026-02-13 | 13F | Schroder Investment Management Group | 152.420 | 9,78 | 2.210 | -29,21 | ||||
| 2026-02-03 | 13F | Mitsubishi UFJ Kokusai Asset Management Co., Ltd. | 142.282 | 24,28 | 2.286 | -11,19 | ||||
| 2026-02-13 | 13F | Caitong International Asset Management Co., Ltd | 0 | -100,00 | 0 | -100,00 | ||||
| 2026-02-06 | 13F | Banque Cantonale Vaudoise | 2.741 | -25,15 | 40 | |||||
| 2026-02-10 | 13F | Quantbot Technologies LP | 5.493 | 80 | ||||||
| 2026-02-13 | 13F | Barclays Plc | 8.809 | -96,84 | 128 | -97,97 | ||||
| 2026-02-04 | 13F | Money Concepts Capital Corp | 93.546 | 2,05 | 1.356 | -34,21 | ||||
| 2026-02-09 | 13F | Legal & General Group Plc | 158.430 | 14,57 | 2.297 | -26,12 | ||||
| 2026-02-13 | 13F | Ubs Oconnor Llc | 0 | -100,00 | 0 | -100,00 | ||||
| 2025-11-14 | 13F | Cubist Systematic Strategies, LLC | 167.997 | 3.778 | ||||||
| 2026-01-16 | 13F | FNY Investment Advisers, LLC | 0 | -100,00 | 0 | |||||
| 2025-11-14 | 13F | Point72 Hong Kong Ltd | 5.522.833 | 124.208 | ||||||
| 2026-02-13 | 13F | State Street Corp | 463.546 | -33,13 | 6.721 | -56,89 | ||||
| 2025-11-14 | 13F | Raymond James Financial Inc | 0 | -100,00 | 0 | |||||
| 2026-02-17 | 13F | MIRAE ASSET GLOBAL ETFS HOLDINGS Ltd. | 4.232.995 | 6,76 | 61.382 | -31,17 | ||||
| 2026-02-17 | 13F | Fmr Llc | 17.615.617 | 6,97 | 255.426 | -31,03 | ||||
| 2026-02-17 | 13F | Price T Rowe Associates Inc /md/ | 30.114 | -17,86 | 0 | |||||
| 2026-02-13 | 13F | Ubs Asset Management Americas Inc | 175.035 | 2.538 | ||||||
| 2025-09-17 | NP | NWXSX - Nationwide International Small Cap Fund Class A | 14.653 | -31,42 | 197 | 1,03 | ||||
| 2026-02-13 | 13F | Intercapital, Llc | 76.400 | 1.108 | ||||||
| 2026-02-12 | 13F | Jane Street Group, Llc | 2.004.782 | -2,81 | 29.069 | -37,34 | ||||
| 2026-02-12 | 13F | Jane Street Group, Llc | Call | 196.200 | -69,76 | 2.845 | -80,51 | |||
| 2026-01-26 | 13F | Provenance Wealth Advisors, LLC | 6.168 | -15,66 | 89 | -45,73 | ||||
| 2026-02-17 | 13F | Armistice Capital, Llc | 468.000 | 87,73 | 6.786 | 21,05 | ||||
| 2026-02-05 | 13F | Baader Bank INC | 229.732 | 0,67 | 3.330 | -34,56 | ||||
| 2026-02-11 | 13F | Jpmorgan Chase & Co | 19.881 | 842,23 | 288 | 512,77 | ||||
| 2026-02-12 | 13F | Jane Street Group, Llc | Put | 541.100 | -44,34 | 7.846 | -64,12 | |||
| 2026-02-19 | 13F | Invesco Ltd. | 68.152 | 340,88 | 988 | 184,73 | ||||
| 2026-02-13 | 13F | First Trust Advisors Lp | 10.028 | -8,74 | 145 | -41,30 | ||||
| 2026-02-06 | 13F | Larson Financial Group LLC | 100 | 0,00 | 1 | -50,00 | ||||
| 2026-02-13 | 13F | Platinum Investment Management Ltd | 16.552 | 240 | ||||||
| 2025-09-25 | NP | AGRFX - AB Growth Fund Class A | 332.847 | -27,13 | 4.473 | 7,73 | ||||
| 2026-02-17 | 13F | Jones Financial Companies Lllp | 2.171 | -1,18 | 31 | -32,61 | ||||
| 2026-02-13 | 13F | Soros Fund Management Llc | Call | 1.000.000 | 14.500 | |||||
| 2026-02-17 | 13F | Evergreen Quality Fund GP, Ltd. | 100.000 | 0,00 | 1.450 | -35,53 | ||||
| 2026-01-23 | 13F | Sumitomo Mitsui Trust Holdings, Inc. | 1.974.499 | 266,23 | 28.630 | 136,12 | ||||
| 2026-02-10 | 13F | Hershey Trust Co | 0 | -100,00 | 0 | |||||
| 2026-02-13 | 13F | Soros Fund Management Llc | 1.231.714 | -40,75 | 17.860 | -61,80 | ||||
| 2026-02-17 | 13F | Capital Fund Management S.a. | 378.529 | -1,95 | 5.489 | -36,79 | ||||
| 2025-09-26 | NP | FEMSX - Fidelity Series Emerging Markets Opportunities Fund This fund is a listed as child fund of Fmr Llc and if that institution has disclosed ownership in this security, then these positions will not be double counted when calculating total shares and total value | 2.512.608 | 61,76 | 33.769 | 139,17 | ||||
| 2026-02-13 | 13F | Wells Fargo & Company/mn | 14.515 | -80,06 | 210 | -87,17 | ||||
| 2026-01-29 | 13F | Renaissance Capital LLC | 16.881 | -49,89 | 245 | -67,77 | ||||
| 2026-02-11 | 13F | Simplex Trading, Llc | 86.008 | 1.247 | ||||||
| 2026-02-13 | 13F | IDG China Venture Capital Fund IV Associates L.P. | 2.216.250 | -76,14 | 32.136 | -84,62 | ||||
| 2026-02-13 | 13F | Tairen Capital Ltd | 15.760 | 229 | ||||||
| 2026-02-12 | 13F | M&G Plc | 444.157 | 6.662 | ||||||
| 2026-01-20 | 13F | Signaturefd, Llc | 0 | -100,00 | 0 | |||||
| 2026-02-11 | 13F | ARK Investment Management LLC | 1.651.452 | 29,76 | 23.946 | -16,34 | ||||
| 2026-02-13 | 13F | Morgan Stanley | 3.024.346 | -8,64 | 43.853 | -41,10 | ||||
| 2026-02-13 | 13F | Hudson Bay Capital Management LP | Call | 2.000 | 29 | |||||
| 2026-02-17 | 13F | Yiheng Capital Management, L.P. | 653.215 | 226,12 | 9.472 | 110,28 | ||||
| 2026-01-29 | 13F | Calamos Advisors LLC | 20.820 | 44,58 | 302 | -6,81 | ||||
| 2025-11-03 | 13F | Washington University | 0 | -100,00 | 0 | -100,00 | ||||
| 2026-02-10 | 13F | Yunqi Capital Ltd | 415.000 | 6.018 | ||||||
| 2026-01-22 | 13F | Financial Consulate, Inc | 100 | 1 | ||||||
| 2026-02-13 | 13F | Manufacturers Life Insurance Company, The | 0 | -100,00 | 0 | -100,00 | ||||
| 2026-02-13 | 13F | Squarepoint Ops LLC | 45.277 | -48,98 | 657 | -67,12 | ||||
| 2026-02-13 | 13F | Ieq Capital, Llc | 23.929 | 94,54 | 347 | 25,36 | ||||
| 2025-11-14 | 13F | Point72 Europe (London) LLP | 0 | -100,00 | 0 | -100,00 | ||||
| 2026-02-11 | 13F | Gordian Capital Singapore Pte Ltd | 1.100 | 1.000,00 | 16 | 650,00 | ||||
| 2026-02-17 | 13F | Electron Capital Partners, LLC | 50.076 | 726 | ||||||
| 2026-02-17 | 13F | Old Mission Capital Llc | 386.835 | 5.609 | ||||||
| 2026-02-17 | 13F | Advisory Services Network, LLC | 0 | -100,00 | 0 | |||||
| 2026-01-15 | 13F | J. Safra Sarasin Holding AG | 0 | -100,00 | 0 | |||||
| 2026-02-13 | 13F | Rafferty Asset Management, LLC | 21.266 | 308 |
Other Listings
| US:PONY | 12,48 $ |