Grundlæggende statistik
| Institutionelle aktier (lange) | 299.046.762 - 75,29% (ex 13D/G) - change of -22,09MM shares -6,88% MRQ |
| Institutionel værdi (lang) | $ 5.669.163 USD ($1000) |
Institutionelt ejerskab og aktionærer
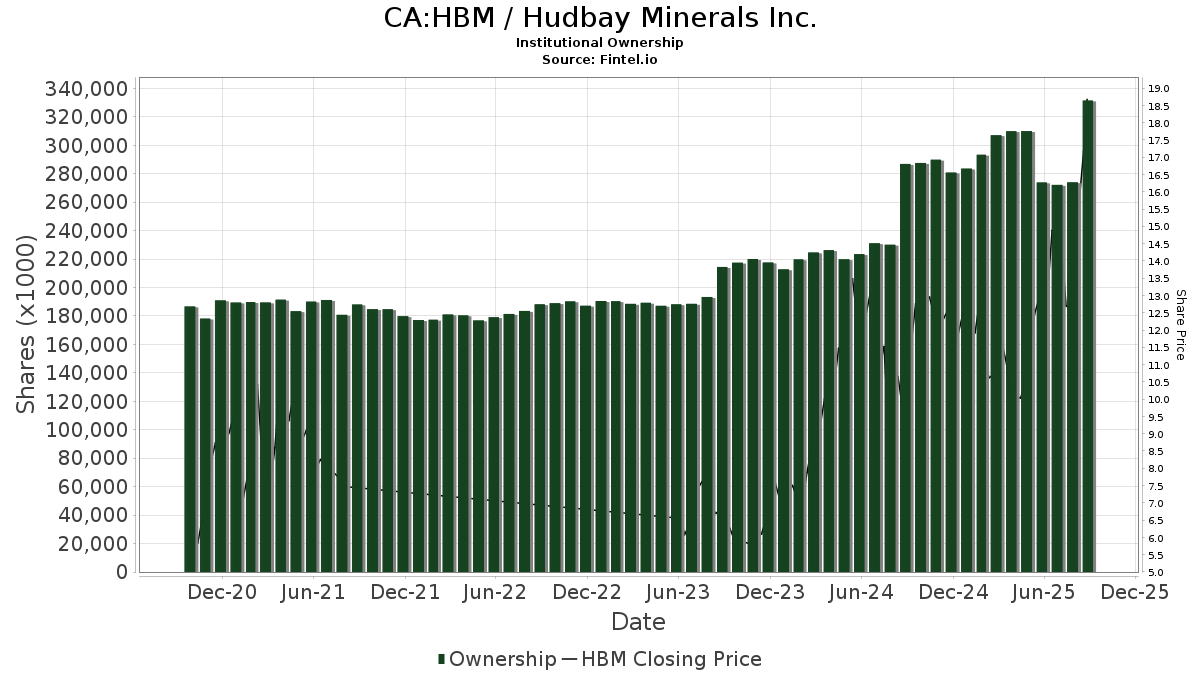
Hudbay Minerals Inc. (CA:HBM) har 283 institutionelle ejere og aktionærer, der har indsendt 13D/G- eller 13F-formularer til Securities Exchange Commission (SEC). Disse institutioner har i alt 299,046,762 aktier. Største aktionærer omfatter FIL Ltd, Gmt Capital Corp, Vanguard Group Inc, Hancock Prospecting Pty Ltd, MIRAE ASSET GLOBAL ETFS HOLDINGS Ltd., Dimensional Fund Advisors Lp, Mackenzie Financial Corp, Acadian Asset Management Llc, Arrowstreet Capital, Limited Partnership, and Invesco Ltd. .
Hudbay Minerals Inc. (TSX:HBM) institutionel ejerskabsstruktur viser aktuelle positioner i virksomheden efter institutioner og fonde, samt seneste ændringer i positionsstørrelse. Større aktionærer kan omfatte individuelle investorer, investeringsforeninger, hedgefonde eller institutioner. Skema 13D angiver, at investoren besidder (eller besidder) mere end 5 % af virksomheden og har til hensigt (eller har til hensigt at) aktivt at forfølge en ændring i forretningsstrategi. Skema 13G indikerer en passiv investering på over 5%.
The share price as of April 24, 2026 is 33,18 / share. Previously, on April 28, 2025, the share price was 10,29 / share. This represents an increase of 222,45% over that period.
Fondens stemningsscore
Fund Sentiment Score (fka Ownership Accumulation Score) finder de aktier, der bliver mest købt af fonde. Det er resultatet af en sofistikeret, multi-faktor kvantitativ model, der identificerer virksomheder med de højeste niveauer af institutionel akkumulering. Scoringsmodellen bruger en kombination af den samlede stigning i oplyste ejere, ændringerne i porteføljeallokeringer i disse ejere og andre målinger. Tallet går fra 0 til 100, hvor højere tal indikerer et højere niveau af akkumulering for sine jævnaldrende, og 50 er gennemsnittet.
Opdateringsfrekvens: Dagligt
Se Ownership Explorer, som giver en liste over højest rangerende virksomheder.
AI+ Ask Fintel’s AI assistant about Hudbay Minerals Inc..
Select a question to share a public post with an AI-crafted answer.
Thinking of good questions…
13F og NPORT arkivering
Detaljer om 13F-arkivering er gratis. Detaljer om NP-ansøgninger kræver et premium-medlemskab. Grønne rækker angiver nye positioner. Røde rækker angiver lukkede positioner. Klik på linket ikon for at se den fulde transaktionshistorik.
Opgrader
for at låse premium-data op og eksportere til Excel ![]() .
.
| Fil dato | Kilde | Investor | Type | Gennemsnitlig pris (Øst) |
Aktier | Δ Aktier (%) |
Rapporteret Værdi ($1000) |
Δ Værdi (%) |
Port Alloc (%) |
|
|---|---|---|---|---|---|---|---|---|---|---|
| 2026-02-13 | 13F | OMERS ADMINISTRATION Corp | 0 | -100,00 | 0 | |||||
| 2026-02-17 | 13F | Lazard Asset Management Llc | 168.426 | -76,84 | 3.344 | -69,64 | ||||
| 2026-02-13 | 13F | American Century Companies Inc | 6.455.534 | 14,41 | 128.165 | 49,97 | ||||
| 2026-02-17 | 13F | Hartree Partners, LP | 0 | -100,00 | 0 | |||||
| 2025-11-10 | 13F | Waratah Capital Advisors Ltd. | 0 | -100,00 | 0 | |||||
| 2026-02-13 | 13F | Great West Life Assurance Co /can/ | 157.938 | 4,26 | 3 | 50,00 | ||||
| 2026-01-30 | 13F | Kiker Wealth Management, LLC | 0 | -100,00 | 0 | |||||
| 2026-04-02 | 13F | Marex Group plc | 0 | -100,00 | 0 | -100,00 | ||||
| 2026-02-17 | 13F | Polygon Management Ltd. | 0 | -100,00 | 0 | -100,00 | ||||
| 2026-04-24 | 13F | Triasima Portfolio Management inc. | 573.232 | -2,01 | 11.965 | 2,90 | ||||
| 2026-02-13 | 13F | Morgan Stanley | 7.528.284 | -2,71 | 149.436 | 27,39 | ||||
| 2026-02-17 | 13F | Royal Bank Of Canada | Put | 0 | -100,00 | 0 | ||||
| 2026-02-17 | 13F | Royal Bank Of Canada | Call | 0 | -100,00 | 0 | ||||
| 2026-02-17 | 13F | Numerai GP LLC | 20.179 | -43,03 | 401 | -25,37 | ||||
| 2026-02-17 | 13F | Greenland Capital Management LP | 105.000 | 40,11 | 2.084 | 83,45 | ||||
| 2026-02-10 | 13F | Jupiter Asset Management Ltd | 0 | -100,00 | 0 | |||||
| 2026-02-13 | 13F | JustInvest LLC | 74.154 | 3,89 | 1.472 | 35,95 | ||||
| 2025-11-14 | 13F | Skopos Labs, Inc. | 0 | -100,00 | 0 | |||||
| 2026-02-05 | 13F | Baader Bank INC | 50.805 | 6,79 | 1.002 | 43,35 | ||||
| 2026-02-13 | 13F | Sei Investments Co | 35.561 | 8,51 | 706 | 42,14 | ||||
| 2026-03-03 | 13F/A | Caitong International Asset Management Co., Ltd | 7.204 | 143 | ||||||
| 2025-10-31 | 13F | Whittier Trust Co | 0 | -100,00 | 0 | |||||
| 2026-02-13 | 13F | Macquarie Group Ltd | 0 | -100,00 | 0 | -100,00 | ||||
| 2026-02-17 | 13F | Royal Bank Of Canada | 7.657.409 | 17,02 | 152.000 | 53,23 | ||||
| 2026-02-13 | 13F | Thomist Capital Management, LP | 599.600 | 11.932 | ||||||
| 2026-02-10 | 13F | Bank of New York Mellon Corp | 971.761 | -23,21 | 19.289 | 0,55 | ||||
| 2026-02-12 | 13F | Aristides Capital LLC | 0 | -100,00 | 0 | |||||
| 2026-02-13 | 13F | Sofos Investments, Inc. | 3 | 0,00 | 0 | |||||
| 2026-02-11 | 13F | Empowered Funds, LLC | 23.903 | 104,74 | 474 | 169,32 | ||||
| 2026-02-13 | 13F | Mudita Advisors LLP | 0 | -100,00 | 0 | |||||
| 2026-02-11 | 13F | Winton Capital Group Ltd | 12.100 | 240 | ||||||
| 2026-02-12 | 13F | Brown Brothers Harriman & Co | 0 | -100,00 | 0 | |||||
| 2026-02-17 | 13F | CastleKnight Management LP | 1.166.200 | -11,08 | 23.162 | 16,60 | ||||
| 2026-02-10 | 13F | Clear Harbor Asset Management, LLC | 33.000 | 0,00 | 655 | 31,00 | ||||
| 2026-04-15 | 13F | Addenda Capital Inc. | 617.158 | 4.298,85 | 17.978 | 4.606,02 | ||||
| 2026-02-17 | 13F | Toronto Dominion Bank | Put | 67.700 | 910,45 | 1.344 | 1.230,69 | |||
| 2026-02-17 | 13F | Toronto Dominion Bank | 1.388.117 | 33,11 | 27.560 | 74,51 | ||||
| 2026-02-13 | 13F | Change Path, LLC | 0 | -100,00 | 0 | |||||
| 2026-02-17 | 13F | Toronto Dominion Bank | Call | 17.000 | -90,96 | 338 | -88,16 | |||
| 2026-04-02 | 13F | Byrne Asset Management LLC | 800 | 17 | ||||||
| 2026-04-13 | 13F | JCIC Asset Management Inc. | 161.831 | 3.382 | ||||||
| 2025-11-21 | 13F/A | CIBC Bancorp USA Inc. | Call | 49.800 | 755 | |||||
| 2026-02-17 | 13F | Brevan Howard Capital Management LP | 169.725 | 3.369 | ||||||
| 2026-01-27 | 13F | Waterfront Wealth Inc. | 39.451 | 1,02 | 1.023 | 73,81 | ||||
| 2026-02-10 | 13F | 1492 Capital Management LLC | 0 | -100,00 | 0 | -100,00 | ||||
| 2026-02-12 | 13F | Sprott Inc. | 84.913 | 61,94 | 1.687 | 112,34 | ||||
| 2026-02-11 | 13F | Tradition Wealth Management, LLC | 10.000 | 0,00 | 198 | 31,13 | ||||
| 2026-01-27 | 13F | Evergreen Capital Management Llc | 61.127 | -0,55 | 1.213 | 30,29 | ||||
| 2026-02-10 | 13F | Easterly Investment Partners Llc | 283.865 | -1,05 | 5.635 | 29,58 | ||||
| 2026-02-13 | 13F | First Trust Advisors Lp | 169.923 | 3.374 | ||||||
| 2025-11-13 | 13F | Eisler Capital Management Ltd. | 0 | -100,00 | 0 | -100,00 | ||||
| 2026-04-20 | 13F | Banque Cantonale Vaudoise | 36.640 | 116,52 | 766 | 127,98 | ||||
| 2026-02-17 | 13F | Agf Management Ltd | 651.457 | -55,05 | 12.934 | -41,08 | ||||
| 2026-02-17 | 13F | State Of Wisconsin Investment Board | 10.047 | 200 | ||||||
| 2026-02-13 | 13F | L1 Capital Pty Ltd | 0 | -100,00 | 0 | |||||
| 2026-02-10 | 13F | CIBC Asset Management Inc | 523.061 | -1,31 | 10.391 | 29,58 | ||||
| 2026-02-10 | 13F | CIBC World Markets Inc. | Call | 128.800 | -72,60 | 2.558 | -64,07 | |||
| 2026-02-10 | 13F | CIBC World Markets Inc. | 817.352 | -16,01 | 16.233 | 10,14 | ||||
| 2026-02-17 | 13F | Millennium Management Llc | 1.203.806 | -0,33 | 23.896 | 30,52 | ||||
| 2025-11-13 | 13F | Marshall Wace, Llp | 0 | -100,00 | 0 | |||||
| 2026-02-17 | 13F | SIG North Trading, ULC | Put | 94.800 | -29,93 | 1.882 | -8,29 | |||
| 2026-02-17 | 13F | SIG North Trading, ULC | Call | 331.400 | -3,63 | 6.578 | 26,18 | |||
| 2026-02-12 | 13F | Hrt Financial Lp | 0 | -100,00 | 0 | |||||
| 2026-04-09 | 13F | Pacifica Partners Inc. | 11.061 | -57,33 | 231 | -55,49 | ||||
| 2026-02-05 | 13F | Allworth Financial LP | 2.214 | 11,26 | 44 | 43,33 | ||||
| 2026-02-13 | 13F | BNP Paribas Asset Management Holding S.A. | 441.332 | 12 | ||||||
| 2026-02-03 | 13F | Ballentine Partners, LLC | 15.981 | -30,29 | 317 | -8,65 | ||||
| 2026-02-13 | 13F | FORA Capital, LLC | 12.824 | -62,66 | 379 | -27,31 | ||||
| 2026-02-13 | 13F | Bank Of Nova Scotia | 7.659.783 | 79,24 | 152.047 | 134,70 | ||||
| 2026-02-17 | 13F | Balyasny Asset Management Llc | 0 | -100,00 | 0 | |||||
| 2026-02-18 | 13F | GWM Advisors LLC | 476 | 9 | ||||||
| 2026-04-21 | 13F | Vise Technologies, Inc. | 13.296 | 0,00 | 264 | 0,00 | ||||
| 2026-02-04 | 13F | Plato Investment Management Ltd | 0 | -100,00 | 0 | |||||
| 2026-02-13 | 13F | Blueshift Asset Management, LLC | 18.401 | 365 | ||||||
| 2025-10-28 | 13F | BRYN MAWR TRUST Co | 545 | 0,00 | 8 | 60,00 | ||||
| 2026-04-24 | 13F | Root Financial Partners, LLC | 104 | 42,47 | 2 | 100,00 | ||||
| 2026-01-23 | 13F | Sumitomo Mitsui Trust Holdings, Inc. | 101.719 | 0,22 | 2.019 | 31,27 | ||||
| 2026-02-17 | 13F | Alliancebernstein L.p. | 144.446 | -8,76 | 2.867 | 19,46 | ||||
| 2026-04-13 | 13F | Whalen Wealth Management Inc. | 0 | -100,00 | 0 | |||||
| 2026-02-04 | 13F | Swiss Life Asset Management Ltd | 32.358 | 75,95 | 642 | 130,94 | ||||
| 2026-02-12 | 13F | Dimensional Fund Advisors Lp | 11.130.803 | -1,80 | 220.948 | 28,58 | ||||
| 2026-02-13 | 13F | Aviso Financial Inc. | 0 | -100,00 | 0 | |||||
| 2026-02-17 | 13F | Ancora Advisors, LLC | 30.500 | 0,00 | 605 | 30,95 | ||||
| 2026-02-17 | 13F | Two Sigma Securities, Llc | 0 | -100,00 | 0 | |||||
| 2025-11-14 | 13F | Graham Capital Management, L.P. | 0 | -100,00 | 0 | -100,00 | ||||
| 2026-02-17 | 13F | Two Sigma Advisers, Lp | 17.843 | -75,97 | 354 | -68,53 | ||||
| 2026-02-13 | 13F | Kestra Advisory Services, LLC | 3.552 | 71 | ||||||
| 2026-02-10 | 13F | Connor, Clark & Lunn Investment Management Ltd. | 8.831.733 | 35,83 | 175.345 | 78,08 | ||||
| 2026-02-17 | 13F | Oxford Asset Management Llp | 10.153 | 202 | ||||||
| 2026-02-17 | 13F | Advisor Group Holdings, Inc. | 21.822 | 48,29 | 433 | 139,23 | ||||
| 2026-02-17 | 13F | Lighthouse Investment Partners, LLC | 63.654 | 1.264 | ||||||
| 2026-02-12 | 13F | Nuveen, LLC | 295.655 | 0,00 | 5.878 | 31,21 | ||||
| 2026-02-12 | 13F | CoreCommodity Management, LLC | 388.462 | -11,28 | 7.718 | 16,48 | ||||
| 2026-04-09 | 13F | Park Place Capital Corp | 661 | -7,68 | 14 | -7,14 | ||||
| 2026-02-13 | 13F | Aigen Investment Management, Lp | 0 | -100,00 | 0 | |||||
| 2026-01-27 | 13F | WealthCollab, LLC | 2.100 | 11,05 | 42 | 46,43 | ||||
| 2026-02-13 | 13F | National Bank Of Canada /fi/ | 3.644.729 | 41,87 | 71.620 | 85,26 | ||||
| 2026-02-13 | 13F | Walleye Capital LLC | 141.294 | -78,68 | 2.805 | -72,09 | ||||
| 2026-02-17 | 13F | MIRAE ASSET GLOBAL ETFS HOLDINGS Ltd. | 12.462.676 | 18,67 | 247.752 | 55,71 | ||||
| 2026-04-17 | 13F | AdvisorNet Financial, Inc | 519 | -49,81 | 11 | -50,00 | ||||
| 2026-02-17 | 13F | Orion Resource Partners LP | 0 | -100,00 | 0 | |||||
| 2026-02-12 | 13F | Amitell Capital Pte Ltd | 0 | -100,00 | 0 | |||||
| 2026-02-13 | 13F | Rhumbline Advisers | 13 | 0,00 | 0 | |||||
| 2026-02-12 | 13F | Federated Hermes, Inc. | 528 | -99,60 | 10 | -99,50 | ||||
| 2026-02-17 | 13F | Quantinno Capital Management LP | 10.940 | 6,27 | 217 | 39,10 | ||||
| 2026-02-12 | 13F | CIBC Private Wealth Group, LLC | 9.714 | 0,00 | 193 | 30,61 | ||||
| 2026-02-17 | 13F | Gotham Asset Management, LLC | 128.025 | -31,44 | 2.541 | -10,24 | ||||
| 2026-02-13 | 13F | Smartleaf Asset Management LLC | 824 | 16 | ||||||
| 2026-02-17 | 13F | Delaware Management Holdings, Inc. | 741.141 | 14.711 | ||||||
| 2026-02-13 | 13F | Acasta Partners UK LLP | 91.700 | 1.820 | ||||||
| 2026-02-17 | 13F | Jones Financial Companies Lllp | 173 | 3 | ||||||
| 2026-01-29 | 13F | Rakuten Securities, Inc. | 478 | 9 | ||||||
| 2025-10-31 | 13F | Y-Intercept (Hong Kong) Ltd | 0 | -100,00 | 0 | |||||
| 2026-02-13 | 13F | Manufacturers Life Insurance Company, The | 0 | -100,00 | 0 | |||||
| 2026-02-13 | 13F | Citigroup Inc | 653.381 | -2,85 | 12.989 | 27,47 | ||||
| 2026-02-17 | 13F | Two Sigma Investments, Lp | 118.441 | -54,74 | 2.351 | -40,74 | ||||
| 2026-02-11 | 13F | Nikko Asset Management Americas, Inc. | 91.919 | 1.825 | ||||||
| 2026-02-17 | 13F | PenderFund Capital Management Ltd. | 0 | -100,00 | 0 | |||||
| 2026-01-30 | 13F | Jennison Associates Llc | 249.345 | -8,96 | 4.949 | 19,22 | ||||
| 2026-02-17 | 13F | Scientech Research LLC | 10.773 | 214 | ||||||
| 2025-10-27 | 13F | Decker Retirement Planning Inc. | 0 | -100,00 | 0 | |||||
| 2026-02-10 | 13F | Savant Capital, LLC | 34.332 | 8,01 | 681 | 41,58 | ||||
| 2026-02-02 | 13F | New England Capital Financial Advisors LLC | 540 | 5,88 | 11 | 42,86 | ||||
| 2026-02-12 | 13F | BlackRock, Inc. | 546.403 | -16,63 | 10.846 | 9,17 | ||||
| 2026-02-13 | 13F | Ridge Creek Global, Inc | 41.115 | 816 | ||||||
| 2026-01-20 | 13F | Wall Street Access Asset Management, LLC | 4.410 | 0,00 | 88 | 31,82 | ||||
| 2026-02-13 | 13F | Barclays Plc | 127.190 | 48,34 | 2.525 | 94,30 | ||||
| 2026-02-17 | 13F | Cinctive Capital Management LP | 74.365 | -24,39 | 1.477 | -0,87 | ||||
| 2025-11-14 | 13F | ExodusPoint Capital Management, LP | 730.499 | -38,71 | 11.074 | 92.183,33 | ||||
| 2026-02-13 | 13F | Oceanic Investment Management LTD | 10.619 | 211 | ||||||
| 2026-02-17 | 13F | D. E. Shaw & Co., Inc. | 2.406.336 | -33,49 | 47.780 | -12,79 | ||||
| 2026-02-03 | 13F | Maxi Investments CY Ltd | 50.000 | 1 | ||||||
| 2026-02-17 | 13F | Millennium Management Llc | Call | 0 | -100,00 | 0 | ||||
| 2026-04-08 | 13F | Ausbil Investment Management Ltd | 0 | -100,00 | 0 | |||||
| 2026-02-17 | 13F | Man Group plc | 2.745.663 | -27,24 | 54.531 | -4,67 | ||||
| 2026-04-14 | 13F | Shrier Wealth Management, Llc | 24.175 | 17,18 | 505 | 23,47 | ||||
| 2026-02-11 | 13F | Letko, Brosseau & Associates Inc | 1.569.583 | -55,56 | 31.203 | -41,69 | ||||
| 2026-02-17 | 13F | Susquehanna International Group, Llp | 211.548 | 36,74 | 4.199 | 79,06 | ||||
| 2025-11-12 | 13F | Smith, Moore & Co. | 0 | -100,00 | 0 | |||||
| 2026-02-13 | 13F | SRS Capital Advisors, Inc. | 348 | 7 | ||||||
| 2026-02-17 | 13F | Susquehanna International Group, Llp | Put | 72.500 | -4,48 | 1.439 | 25,13 | |||
| 2026-02-17 | 13F | Susquehanna International Group, Llp | Call | 370.000 | -30,16 | 7.344 | -8,55 | |||
| 2025-11-20 | 13F | First Affirmative Financial Network | 17.290 | -7,28 | 262 | 32,99 | ||||
| 2026-04-21 | 13F | Pinnacle Associates Ltd | 17.365 | -2,55 | 363 | 2,55 | ||||
| 2026-01-15 | 13F | J. Safra Sarasin Holding AG | 15.500 | 308 | ||||||
| 2025-11-14 | 13F | Prelude Capital Management, Llc | 0 | -100,00 | 0 | -100,00 | ||||
| 2026-02-13 | 13F | Neuberger Berman Group LLC | 146.487 | 434,70 | 2.912 | 601,69 | ||||
| 2026-02-13 | 13F | Toroso Investments, LLC | 216.108 | -0,13 | 4.290 | 30,76 | ||||
| 2026-02-13 | 13F | National Bank Of Canada /fi/ | Call | 720 | -26,98 | 1.429 | -4,29 | |||
| 2026-02-18 | 13F | Guardian Capital Lp | 601.889 | 11.965 | ||||||
| 2026-04-21 | 13F | Robeco Institutional Asset Management B.V. | 652.488 | 311,23 | 13.637 | 333,06 | ||||
| 2026-02-12 | 13F | M&G Plc | 0 | -100,00 | 0 | |||||
| 2026-02-17 | 13F | Trexquant Investment LP | 0 | -100,00 | 0 | |||||
| 2026-01-20 | 13F | Stratos Wealth Advisors, LLC | 0 | -100,00 | 0 | |||||
| 2026-02-17 | 13F | Clear Street Markets Llc | 20.000 | 38,89 | 397 | 82,11 | ||||
| 2026-02-11 | 13F | Simplex Trading, Llc | 48.814 | 969 | ||||||
| 2026-02-11 | 13F | Simplex Trading, Llc | Call | 180.000 | -9,23 | 3.573 | 119.000,00 | |||
| 2026-02-11 | 13F | Simplex Trading, Llc | Put | 15.200 | -35,32 | 302 | ||||
| 2026-02-06 | 13F | Carrhae Capital LLP | 802.513 | 15.930 | ||||||
| 2026-04-16 | 13F | Toth Financial Advisory Corp | 100 | 2 | ||||||
| 2025-11-13 | 13F | Spark Investment Management LLC | 0 | -100,00 | 0 | -100,00 | ||||
| 2026-02-13 | 13F | National Bank Of Canada /fi/ | Put | 494 | -46,48 | 981 | -29,90 | |||
| 2026-02-09 | 13F | Employees Retirement System of Texas | 255.046 | 0,00 | 5 | 66,67 | ||||
| 2026-02-17 | 13F | Guggenheim Capital Llc | 18.875 | -17,95 | 375 | 7,47 | ||||
| 2026-04-20 | 13F | Ronald Blue Trust, Inc. | 0 | -100,00 | 0 | |||||
| 2026-02-17 | 13F | Shelton Capital Management | 10.944 | -57,65 | 217 | -44,50 | ||||
| 2026-02-17 | 13F | Caption Management, LLC | 0 | -100,00 | 0 | |||||
| 2026-04-08 | 13F | Wealth Enhancement Trust Services, Inc. | 0 | -100,00 | 0 | |||||
| 2026-04-13 | 13F | Artemis Investment Management LLP | 1.673.054 | -70,70 | 35.041 | -69,09 | ||||
| 2025-11-14 | 13F | Ameriprise Financial Inc | 0 | -100,00 | 0 | -100,00 | ||||
| 2026-01-28 | 13F | U S Global Investors Inc | 95.000 | 0,00 | 1.886 | 30,90 | ||||
| 2026-02-17 | 13F | Woodline Partners LP | 448.553 | 10,38 | 8.904 | 44,53 | ||||
| 2026-02-17 | 13F | Raymond James Financial Inc | 137.948 | 119,06 | 2.738 | 187,00 | ||||
| 2026-04-03 | 13F | Adirondack Trust Co | 568 | 0,00 | 12 | 0,00 | ||||
| 2026-02-17 | 13F | Bayesian Capital Management, LP | 0 | -100,00 | 0 | |||||
| 2026-02-14 | 13F | Rockefeller Capital Management L.P. | 4.933 | 24,98 | 98 | 64,41 | ||||
| 2026-02-19 | 13F | Invesco Ltd. | 9.395.299 | -17,52 | 186.497 | 7,99 | ||||
| 2026-02-17 | 13F | Tower Research Capital LLC (TRC) | 2.894 | -33,87 | 57 | -13,64 | ||||
| 2026-03-12 | 13F/A | Peak6 Llc | Call | 188.900 | -82,24 | 3.750 | -76,75 | |||
| 2025-11-14 | 13F | Ubs Asset Management Americas Inc | 0 | -100,00 | 0 | |||||
| 2026-01-30 | 13F | Wealth High Governance Capital Ltda | 732.314 | 103,42 | 14.544 | 166,52 | ||||
| 2026-02-17 | 13F | Susquehanna Portfolio Strategies, LLC | 80.300 | 0,00 | 1.594 | 30,90 | ||||
| 2026-02-17 | 13F | Amundi | 400.003 | -16,56 | 7.940 | 5,84 | ||||
| 2026-02-03 | 13F | Lumbard & Kellner, LLC | 519.436 | -2,66 | 10.311 | 27,46 | ||||
| 2026-02-12 | 13F | Orchard Capital Managment, LLC | 285.674 | -34,71 | 5.671 | -14,51 | ||||
| 2026-04-10 | 13F | Affinity Wealth Management Llc | 221.526 | 14,01 | 4.630 | 20,05 | ||||
| 2026-02-10 | 13F | Daiwa Securities Group Inc. | 15.300 | 0,00 | 0 | |||||
| 2026-02-06 | 13F | Larson Financial Group LLC | 116 | 22,11 | 2 | 100,00 | ||||
| 2026-02-17 | 13F | Schonfeld Strategic Advisors LLC | 0 | -100,00 | 0 | |||||
| 2026-02-17 | 13F | SummitTX Capital, L.P. | 119.664 | -48,33 | 2.375 | -32,36 | ||||
| 2026-02-17 | 13F | Qube Research & Technologies Ltd | 0 | -100,00 | 0 | |||||
| 2026-02-13 | 13F | Entropy Technologies, LP | 0 | -100,00 | 0 | |||||
| 2026-02-11 | 13F | Group One Trading, L.p. | Put | 28.000 | 150,00 | 556 | 228,40 | |||
| 2026-02-18 | 13F | State of Tennessee, Treasury Department | 100.750 | -12,50 | 2.398 | 37,44 | ||||
| 2026-02-17 | 13F | Investment Management Corp of Ontario | 48.603 | 234,11 | 965 | 338,18 | ||||
| 2026-02-11 | 13F | Group One Trading, L.p. | Call | 356.500 | 160,41 | 7.077 | 241,01 | |||
| 2026-02-10 | 13F | Norges Bank | 5.304.538 | 105.315 | ||||||
| 2026-02-10 | 13F | Goldman Sachs Group Inc | 924.095 | -75,70 | 18.343 | -68,19 | ||||
| 2026-02-09 | 13F | Geode Capital Management, Llc | 267.941 | 14,70 | 5.434 | 52,87 | ||||
| 2026-02-17 | 13F | Fmr Llc | 7.089.254 | 139,19 | 140.742 | 213,51 | ||||
| 2025-11-14 | 13F | Engineers Gate Manager LP | 0 | -100,00 | 0 | |||||
| 2026-02-11 | 13F | Metis Global Partners, LLC | 17.450 | 0,00 | 346 | 31,06 | ||||
| 2026-02-11 | 13F | Donald Smith & Co., Inc. | 35.913 | 713 | ||||||
| 2026-02-12 | 13F | Northwest & Ethical Investments L.P. | 220.135 | -30,18 | 4.374 | -8,78 | ||||
| 2026-02-06 | 13F | EverSource Wealth Advisors, LLC | 3.126 | 1,03 | 62 | 34,78 | ||||
| 2026-04-10 | 13F | Finivi Inc. | 23.635 | -13,48 | 494 | -9,04 | ||||
| 2026-02-11 | 13F | LPL Financial LLC | 162.229 | 45,87 | 3.220 | 91,10 | ||||
| 2026-02-11 | 13F | Picton Mahoney Asset Management | 5.034.287 | -20,73 | 100.090 | 104.159,38 | ||||
| 2026-02-13 | 13F | Charles Schwab Investment Management Inc | 1.449.565 | 7,94 | 28.817 | 41,64 | ||||
| 2025-11-21 | 13F/A | CIBC Bancorp USA Inc. | 25.000 | 379 | ||||||
| 2026-02-10 | 13F | Semanteon Capital Management, LP | 0 | -100,00 | 0 | |||||
| 2026-02-13 | 13F | Wells Fargo & Company/mn | 5.851 | 178,09 | 116 | 274,19 | ||||
| 2026-01-29 | 13F | Vanguard Group Inc | 15.842.258 | -2,20 | 314.532 | 28,20 | ||||
| 2026-02-17 | 13F | Caisse De Depot Et Placement Du Quebec | 941.623 | 18.719 | ||||||
| 2026-04-16 | 13F | Strong Tower Advisory Services | 94.974 | 0,22 | 1.985 | 5,48 | ||||
| 2026-02-13 | 13F | Public Sector Pension Investment Board | 22.985 | 456 | ||||||
| 2026-02-03 | 13F | Robeco Schweiz AG | 1.155.000 | 0,00 | 22.927 | 30,94 | ||||
| 2026-02-17 | 13F | FIL Ltd | 33.143.172 | 202,02 | 658.010 | 295,87 | ||||
| 2026-02-13 | 13F | Goehring & Rozencwajg Associates, LLC | 824.951 | 6,64 | 16.380 | 39,83 | ||||
| 2026-02-13 | 13F | Boston Partners | 595.447 | -30,51 | 16.226 | -10,17 | ||||
| 2026-04-13 | 13F | Wolff Wiese Magana Llc | 20 | 0 | ||||||
| 2026-01-27 | 13F | Zurcher Kantonalbank (Zurich Cantonalbank) | 122.032 | -4,57 | 2.426 | 25,19 | ||||
| 2026-02-03 | 13F | SBI Securities Co., Ltd. | 9.434 | -31,42 | 187 | -10,10 | ||||
| 2026-02-17 | 13F | Jain Global LLC | 43.630 | 866 | ||||||
| 2026-02-17 | 13F | EdgePoint Investment Group Inc. | 3.193.806 | -38,87 | 63.410 | -19,85 | ||||
| 2026-02-12 | 13F | Quadrant Capital Group Llc | 8.083 | 0,00 | 160 | 31,15 | ||||
| 2026-02-11 | 13F | Jpmorgan Chase & Co | 3.155.540 | -18,28 | 62.637 | 7,01 | ||||
| 2026-02-17 | 13F | Boothbay Fund Management, Llc | 30.534 | -72,93 | 606 | -64,52 | ||||
| 2026-02-12 | 13F | Barometer Capital Management Inc. | 0 | -100,00 | 0 | |||||
| 2025-11-13 | 13F | PCJ Investment Counsel Ltd. | 0 | -100,00 | 0 | -100,00 | ||||
| 2026-02-17 | 13F | Cetera Investment Advisers | 141.074 | 644,30 | 2.800 | 875,61 | ||||
| 2026-02-12 | 13F | Robotti Robert | 55.000 | 0,00 | 1.092 | 30,97 | ||||
| 2026-02-02 | 13F | Intact Investment Management Inc. | 4.620 | 92 | ||||||
| 2026-01-30 | 13F | Us Bancorp \de\ | 30.656 | -0,90 | 609 | 29,91 | ||||
| 2026-02-10 | 13F | Hillsdale Investment Management Inc. | 628.600 | -38,56 | 12.502 | -19,31 | ||||
| 2026-02-18 | 13F | VGI Partners Ltd | 339.975 | -47,04 | 6.749 | -30,66 | ||||
| 2026-04-08 | 13F | Oliver Luxxe Assets LLC | 139.349 | -37,16 | 2.912 | -33,83 | ||||
| 2026-02-10 | 13F | Bnp Paribas Arbitrage, Sa | 1.094.978 | -22,51 | 21.735 | 1,47 | ||||
| 2026-02-13 | 13F | Police & Firemen's Retirement System of New Jersey | 143.755 | 2,83 | 2.858 | 34,89 | ||||
| 2026-02-11 | 13F | Parallel Advisors, LLC | 1.456 | 19,74 | 29 | 55,56 | ||||
| 2025-11-13 | 13F | Dynamic Technology Lab Private Ltd | 0 | -100,00 | 0 | |||||
| 2026-01-23 | 13F | Assetmark, Inc | 47 | 0,00 | 1 | |||||
| 2026-04-24 | 13F | Abacus Wealth Partners, LLC | 41.184 | -5,28 | 861 | -0,35 | ||||
| 2026-02-11 | 13F | Allianz Asset Management GmbH | 2.329.580 | 14,93 | 46.311 | 50,80 | ||||
| 2026-02-17 | 13F | Quadrature Capital Ltd | 659.800 | 49,09 | 13.117 | 95,59 | ||||
| 2026-02-13 | 13F | SIR Capital Management, L.P. | 744.517 | 65,89 | 14.779 | 117,23 | ||||
| 2026-02-06 | 13F | Global Retirement Partners, LLC | 403 | -86,39 | 8 | -81,82 | ||||
| 2026-02-18 | 13F/A | Alberta Investment Management Corp | 396.500 | 14,79 | 7.872 | 50,52 | ||||
| 2026-02-17 | 13F | Hancock Prospecting Pty Ltd | 14.535.729 | 0,00 | 288.997 | 31,30 | ||||
| 2026-02-10 | 13F | Acadian Asset Management Llc | 9.786.000 | 92,15 | 194 | 151,95 | ||||
| 2026-02-17 | 13F | Credit Agricole S A | 352.207 | 70,77 | 6.991 | 123,64 | ||||
| 2026-02-09 | 13F | Beck Bode, LLC | 12.669 | 251 | ||||||
| 2026-04-22 | 13F | Pictet Asset Management Holding SA | 82.194 | 10,96 | 1.716 | 16,51 | ||||
| 2026-02-13 | 13F | Mariner, LLC | 76.915 | 7,23 | 1.527 | 40,39 | ||||
| 2026-02-18 | 13F | Caitlin John, LLC | 200 | 4 | ||||||
| 2026-02-13 | 13F | BRITISH COLUMBIA INVESTMENT MANAGEMENT Corp | 210.433 | -8,72 | 4.178 | 19,65 | ||||
| 2026-04-07 | 13F | Farther Finance Advisors, LLC | 0 | -100,00 | 0 | |||||
| 2026-02-17 | 13F | Optiver Holding B.V. | 37 | -98,80 | 1 | -100,00 | ||||
| 2026-02-11 | 13F | CenterBook Partners LP | 38.535 | 765 | ||||||
| 2026-02-13 | 13F | Bridgewater Associates, LP | 144.349 | -8,76 | 2.870 | 19,74 | ||||
| 2026-03-04 | 13F | SHP Wealth Management | 1.150 | 23 | ||||||
| 2026-02-18 | 13F | Mackenzie Financial Corp | 10.178.626 | 116,08 | 202.327 | 183,63 | ||||
| 2026-02-17 | 13F | Creative Planning | 31.295 | 7,20 | 621 | 40,50 | ||||
| 2026-02-10 | 13F | Envestnet Asset Management Inc | 76.476 | 23,64 | 1.518 | 62,01 | ||||
| 2026-02-17 | 13F | Persistent Asset Partners Ltd | 0 | -100,00 | 0 | -100,00 | ||||
| 2026-02-12 | 13F | Renaissance Technologies Llc | 2.191.909 | -44,54 | 43.509 | -27,38 | ||||
| 2026-02-13 | 13F | Vontobel Holding Ltd. | 126.090 | 0,59 | 2.503 | 31,88 | ||||
| 2026-02-05 | 13F | Heathbridge Capital Management Ltd. | 211.910 | -19,43 | 4.213 | 5,80 | ||||
| 2026-02-12 | 13F | Ironwood Investment Management Llc | 27.581 | 0,00 | 547 | 30,86 | ||||
| 2026-02-12 | 13F | Alps Advisors Inc | 408.578 | 120,79 | 8.110 | 189,13 | ||||
| 2026-02-12 | 13F | Scotia Capital Inc. | 173.934 | -5,38 | 3.417 | 23,14 | ||||
| 2026-02-17 | 13F | PharVision Advisers, LLC | 0 | -100,00 | 0 | |||||
| 2026-02-23 | 13F | Virtu Financial LLC | 0 | -100,00 | 0 | |||||
| 2026-02-17 | 13F | Point72 Asset Management, L.P. | 998.673 | 19.825 | ||||||
| 2026-02-17 | 13F | Point72 Asset Management, L.P. | Call | 26.900 | 534 | |||||
| 2025-11-12 | 13F | Cambridge Investment Research Advisors, Inc. | 0 | -100,00 | 0 | |||||
| 2026-02-24 | 13F | DGS Capital Management, LLC | 10.656 | 212 | ||||||
| 2025-11-13 | 13F | Prudential Financial Inc | 0 | -100,00 | 0 | |||||
| 2026-02-12 | 13F | EAM Global Investors LLC | 209.237 | -10,55 | 4.160 | 17,39 | ||||
| 2025-11-12 | 13F | Impala Asset Management LLC | 0 | -100,00 | 0 | |||||
| 2026-04-17 | 13F | Bell Investment Advisors, Inc | 117 | -35,36 | 2 | -33,33 | ||||
| 2026-04-22 | 13F | Stone House Investment Management, LLC | 15 | 0,00 | 0 | |||||
| 2026-02-17 | 13F | Leonteq Securities AG | 0 | -100,00 | 0 | |||||
| 2025-11-07 | 13F | Shell Asset Management Co | 5.982 | -71,36 | 0 | |||||
| 2025-11-14 | 13F | Axa S.a. | 0 | -100,00 | 0 | |||||
| 2025-11-14 | 13F | Point72 (DIFC) Ltd | 59 | 1 | ||||||
| 2026-02-03 | 13F | K.J. Harrison & Partners Inc | 90.600 | -16,84 | 1.801 | 7,01 | ||||
| 2025-11-17 | 13F | PDT Partners, LLC | 0 | -100,00 | 0 | |||||
| 2026-01-29 | 13F | UBS Group AG | 799.864 | 25,94 | 15.877 | 64,90 | ||||
| 2026-02-12 | 13F | Advisors Asset Management, Inc. | 23.665 | -0,87 | 470 | 29,92 | ||||
| 2026-02-13 | 13F | Arrowstreet Capital, Limited Partnership | 9.457.298 | 15,84 | 187.743 | 51,73 | ||||
| 2026-02-05 | 13F | Leuthold Group, Llc | 138.738 | 2.754 | ||||||
| 2026-02-17 | 13F | Susquehanna Fundamental Investments, Llc | 422.600 | 0,00 | 8.389 | 30,94 | ||||
| 2026-02-18 | 13F | Vident Advisory, LLC | 107.296 | -18,96 | 2.130 | 6,08 | ||||
| 2026-03-12 | 13F/A | Peak6 Llc | Put | 0 | -100,00 | 0 | -100,00 | |||
| 2025-11-14 | 13F | Cubist Systematic Strategies, LLC | 156.718 | -92,34 | 2.371 | -89,08 | ||||
| 2026-02-06 | 13F | Texas Bank & Trust Co | 25.600 | 508 | ||||||
| 2025-11-21 | 13F | Nebula Research & Development LLC | 0 | -100,00 | 0 | -100,00 | ||||
| 2026-03-06 | 13F | Hsbc Holdings Plc | 0 | -100,00 | 0 | |||||
| 2026-02-17 | 13F | Citadel Advisors Llc | Put | 57.200 | -30,58 | 1.135 | -9,13 | |||
| 2026-02-10 | 13F | Td Asset Management Inc | 2.122.744 | 0,28 | 42.199 | 31,59 | ||||
| 2026-02-17 | 13F | Citadel Advisors Llc | Call | 165.200 | 26,11 | 3.279 | 65,19 | |||
| 2026-04-07 | 13F | Signaturefd, Llc | 34.047 | -1,13 | 712 | 4,10 | ||||
| 2026-02-17 | 13F | Citadel Advisors Llc | 472.233 | -14,44 | 9.374 | 12,04 | ||||
| 2026-04-22 | 13F | Spire Wealth Management | 146 | 0,00 | 3 | 50,00 | ||||
| 2026-01-22 | 13F | Bfsg, Llc | 88.390 | -0,90 | 1.755 | 29,73 | ||||
| 2026-02-17 | 13F | Nokomis Capital, L.L.C. | 868.230 | 0,00 | 17.234 | 30,94 | ||||
| 2026-01-06 | 13F | Sanctuary Advisors, LLC | 0 | -100,00 | 0 | |||||
| 2026-02-17 | 13F | Blackstone Group Inc | 0 | -100,00 | 0 | |||||
| 2026-02-17 | 13F | Price T Rowe Associates Inc /md/ | 879.900 | 17 | ||||||
| 2026-02-12 | 13F | EAM Investors, LLC | 250.645 | -12,06 | 4.983 | 15,40 | ||||
| 2026-02-11 | 13F | Deutsche Bank Ag\ | 35.565 | -11,91 | 706 | 15,20 | ||||
| 2026-01-20 | 13F | Savvy Advisors, Inc. | 10.193 | -18,95 | 202 | 6,32 | ||||
| 2026-02-11 | 13F | O'shaughnessy Asset Management, Llc | 391.140 | 111,73 | 7.766 | 177,62 | ||||
| 2026-01-30 | 13F | Precision Wealth Strategies, LLC | 73.683 | 30,70 | 1.463 | 71,19 | ||||
| 2026-02-12 | 13F | Federation des caisses Desjardins du Quebec | 251.658 | 25,89 | 4.971 | 64,55 | ||||
| 2026-02-17 | 13F | Polar Asset Management Partners Inc. | 80.000 | 60,00 | 1.588 | 109,78 | ||||
| 2026-01-29 | 13F | IMC-Chicago, LLC | Put | 28.500 | 80,38 | 566 | 136,40 | |||
| 2026-01-29 | 13F | IMC-Chicago, LLC | Call | 104.800 | 44,75 | 2.080 | 89,61 | |||
| 2026-01-27 | 13F | TD Waterhouse Canada Inc. | 478.434 | -4,50 | 9.398 | 21,91 | ||||
| 2026-01-28 | 13F | Eagle Global Advisors Llc | 22.600 | -22,87 | 449 | 0,90 | ||||
| 2026-04-13 | 13F | IFP Advisors, Inc | 237 | 5 | ||||||
| 2026-02-10 | 13F | Verus Capital Partners, Llc | 10.000 | 0,00 | 198 | 31,13 | ||||
| 2026-02-06 | 13F | Cumberland Partners Ltd | 232.800 | -36,17 | 4.627 | -16,21 | ||||
| 2026-02-12 | 13F | Jane Street Group, Llc | 59.498 | -84,43 | 1.181 | -79,62 | ||||
| 2026-02-10 | 13F | State of Wyoming | 0 | -100,00 | 0 | |||||
| 2025-11-14 | 13F | Condire Management, LP | 0 | -100,00 | 0 | |||||
| 2026-02-12 | 13F | Jane Street Group, Llc | Put | 21.800 | -68,22 | 433 | -58,42 | |||
| 2026-02-12 | 13F | Jane Street Group, Llc | Call | 325.100 | 289,34 | 6.453 | 410,12 | |||
| 2026-02-11 | 13F | Clearbridge Investments, LLC | 356.561 | 3,20 | 7.078 | 35,13 | ||||
| 2026-02-13 | 13F | 1832 Asset Management L.P. | 470.000 | 9.330 | ||||||
| 2026-04-14 | 13F | Wealthcare Advisory Partners LLC | 36.774 | 200,44 | 769 | 217,36 | ||||
| 2026-02-13 | 13F | Pathstone Holdings, LLC | 10.200 | -0,62 | 202 | 30,32 | ||||
| 2026-02-10 | 13F/A | Northwestern Mutual Wealth Management Co | 214 | 4 | ||||||
| 2026-02-11 | 13F | Group One Trading, L.p. | 0 | -100,00 | 0 | -100,00 | ||||
| 2026-02-09 | 13F | Legal & General Group Plc | 386.828 | -2,11 | 7.690 | 28,43 | ||||
| 2026-02-17 | 13F | Voloridge Investment Management, Llc | 1.383.056 | -25,60 | 27.454 | -2,59 | ||||
| 2026-02-17 | 13F | Canada Pension Plan Investment Board | 52.000 | -93,02 | 1.032 | -90,86 | ||||
| 2026-04-15 | 13F | FNY Investment Advisers, LLC | 0 | -100,00 | 0 | |||||
| 2026-02-13 | 13F | Centiva Capital, LP | 25.272 | -69,56 | 502 | -60,17 | ||||
| 2026-02-17 | 13F | Temasek Holdings (Private) Ltd | 800.528 | 0,00 | 15.890 | 30,93 | ||||
| 2026-02-17 | 13F | Covalis Capital Llp | 130.166 | 2.584 | ||||||
| 2026-04-22 | 13F | Gemmer Asset Management LLC | 18.601 | 389 | ||||||
| 2026-02-06 | 13F | HighTower Advisors, LLC | 244.410 | -5,49 | 4.852 | 23,75 | ||||
| 2026-02-11 | 13F | Twin Tree Management, LP | 24.369 | 484 | ||||||
| 2026-02-13 | 13F | Quarry LP | 0 | -100,00 | 0 | |||||
| 2026-02-13 | 13F | Ceredex Value Advisors LLC | 527.550 | 10.472 | ||||||
| 2026-02-17 | 13F | Yaupon Capital Management LP | 1.051.553 | 33,04 | 20.873 | 74,20 | ||||
| 2026-02-12 | 13F | Bank Of Montreal /can/ | Call | 300.400 | -43,69 | 5.964 | -26,18 | |||
| 2026-02-17 | 13F | New Vernon Capital Holdings II LLC | 660 | 18 | ||||||
| 2026-04-16 | 13F | SG Americas Securities, LLC | 532.090 | 11 | ||||||
| 2026-02-12 | 13F | Bank Of Montreal /can/ | 7.134.513 | 13,41 | 141.648 | 48,68 | ||||
| 2026-02-11 | 13F | 111 Capital | 0 | -100,00 | 0 | -100,00 | ||||
| 2025-11-14 | 13F | Gts Securities Llc | 0 | -100,00 | 0 | -100,00 | ||||
| 2026-01-07 | 13F | Harbour Capital Advisors, LLC | 21.065 | 423 | ||||||
| 2026-02-10 | 13F | SCP Investment, LP | 0 | -100,00 | 0 | |||||
| 2026-02-12 | 13F | Swiss National Bank | 783.700 | 1,48 | 15.591 | 33,22 | ||||
| 2026-02-17 | 13F | Bank Of America Corp /de/ | 1.228.390 | -33,61 | 24.384 | -13,08 | ||||
| 2025-11-14 | 13F | Decade Renewable Partners Lp | 0 | -100,00 | 0 | |||||
| 2026-02-17 | 13F | Public Employees Retirement System Of Ohio | 715.430 | 87,61 | 14.222 | 146,12 | ||||
| 2026-02-13 | 13F | Mountaineer Partners Management, LLC | 787.247 | -17,60 | 15.627 | 7,88 | ||||
| 2026-02-12 | 13F | Canopy Partners, LLC | 0 | -100,00 | 0 | |||||
| 2026-02-17 | 13F | XTX Topco Ltd | 0 | -100,00 | 0 | |||||
| 2026-02-05 | 13F | HighMark Wealth Management LLC | 0 | -100,00 | 0 | |||||
| 2026-02-17 | 13F | Moore Capital Management, Lp | 782.099 | -39,15 | 15.529 | -20,27 | ||||
| 2026-02-13 | 13F | Headlands Technologies LLC | 0 | -100,00 | 0 | |||||
| 2026-02-13 | 13F | Verition Fund Management LLC | 0 | -100,00 | 0 | |||||
| 2026-02-17 | 13F | Russell Investments Group, Ltd. | 470.235 | -0,34 | 9.340 | 30,60 | ||||
| 2026-04-22 | 13F | Louisbourg Investments Inc. | 285.900 | 8,34 | 5.975 | 13,88 | ||||
| 2025-11-14 | 13F | AXA Investment Managers S.A. | 433.978 | 6.579 | ||||||
| 2026-04-16 | 13F | Vaughan Nelson Investment Management, L.p. | 1.185.045 | 24.767 | ||||||
| 2026-02-09 | 13F | AIA Group Ltd | 81.149 | -26,37 | 1.611 | -3,59 | ||||
| 2026-02-13 | 13F | Van Eck Associates Corp | 1.941.974 | 87,23 | 39 | 153,33 | ||||
| 2026-02-10 | 13F | CIBC World Markets Inc. | Put | 0 | -100,00 | 0 | -100,00 | |||
| 2026-02-17 | 13F | Jump Financial, LLC | 0 | -100,00 | 0 | |||||
| 2026-02-17 | 13F | Driehaus Capital Management Llc | 1.977.986 | -3,68 | 39.263 | 26,12 | ||||
| 2026-02-13 | 13F | Hudson Bay Capital Management LP | 75.000 | 1.489 | ||||||
| 2025-11-14 | 13F | Wolverine Trading, Llc | 19.042 | 290 | ||||||
| 2025-11-14 | 13F | Wolverine Trading, Llc | Call | 48.200 | 30,98 | 733 | 88,92 | |||
| 2025-11-14 | 13F | Wolverine Trading, Llc | Put | 14.900 | 19,20 | 227 | 71,21 | |||
| 2026-02-11 | 13F | Tacita Capital Inc | 2 | 0,00 | 0 | |||||
| 2026-01-30 | 13F | Carrera Capital Advisors | 158.385 | -11,37 | 3.144 | 16,02 | ||||
| 2026-02-13 | 13F | Bard Associates Inc | 28.449 | -10,38 | 565 | 17,26 | ||||
| 2026-02-13 | 13F | Gallo Partners, LP | 58.573 | 1.163 | ||||||
| 2026-02-13 | 13F | Healthcare Of Ontario Pension Plan Trust Fund | 14.600 | 0,00 | 290 | 30,77 | ||||
| 2026-02-11 | 13F | Renaissance Group Llc | 340.979 | 6.768 | ||||||
| 2026-02-12 | 13F | Campbell & CO Investment Adviser LLC | 64.849 | -32,38 | 1.287 | -11,42 | ||||
| 2026-02-13 | 13F | Squarepoint Ops LLC | 0 | -100,00 | 0 | |||||
| 2026-02-13 | 13F | Gmt Capital Corp | 24.641.220 | -12,32 | 489.858 | 15,05 | ||||
| 2025-11-14 | 13F | Capstone Investment Advisors, Llc | 15.183 | -69,14 | 230 | -55,94 | ||||
| 2026-02-13 | 13F | Cornerstone Financial Management LLC | 1.042 | 21 | ||||||
| 2026-02-11 | 13F | Franklin Resources Inc | 615.678 | 104,89 | 12.223 | 168,62 |