Grundlæggende statistik
| Institutionelle aktier (lange) | 61.042.471 - 102,56% (ex 13D/G) - change of -14,93MM shares -19,65% MRQ |
| Institutionel værdi (lang) | $ 1.673.603 USD ($1000) |
Institutionelt ejerskab og aktionærer
Yelp Inc. (US:YELP) har 316 institutionelle ejere og aktionærer, der har indsendt 13D/G- eller 13F-formularer til Securities Exchange Commission (SEC). Disse institutioner har i alt 61,042,471 aktier. Største aktionærer omfatter BlackRock, Inc., Vanguard Group Inc, Lsv Asset Management, State Street Corp, Acadian Asset Management Llc, Dimensional Fund Advisors Lp, Arrowstreet Capital, Limited Partnership, Geode Capital Management, Llc, Allianz Asset Management GmbH, and River Road Asset Management, LLC .
Yelp Inc. (NYSE:YELP) institutionel ejerskabsstruktur viser aktuelle positioner i virksomheden efter institutioner og fonde, samt seneste ændringer i positionsstørrelse. Større aktionærer kan omfatte individuelle investorer, investeringsforeninger, hedgefonde eller institutioner. Skema 13D angiver, at investoren besidder (eller besidder) mere end 5 % af virksomheden og har til hensigt (eller har til hensigt at) aktivt at forfølge en ændring i forretningsstrategi. Skema 13G indikerer en passiv investering på over 5%.
The share price as of April 20, 2026 is 28,16 / share. Previously, on April 21, 2025, the share price was 32,56 / share. This represents a decline of 13,51% over that period.

Fondens stemningsscore
Fund Sentiment Score (fka Ownership Accumulation Score) finder de aktier, der bliver mest købt af fonde. Det er resultatet af en sofistikeret, multi-faktor kvantitativ model, der identificerer virksomheder med de højeste niveauer af institutionel akkumulering. Scoringsmodellen bruger en kombination af den samlede stigning i oplyste ejere, ændringerne i porteføljeallokeringer i disse ejere og andre målinger. Tallet går fra 0 til 100, hvor højere tal indikerer et højere niveau af akkumulering for sine jævnaldrende, og 50 er gennemsnittet.
Opdateringsfrekvens: Dagligt
Se Ownership Explorer, som giver en liste over højest rangerende virksomheder.
AI+ Ask Fintel’s AI assistant about Yelp Inc..
Select a question to share a public post with an AI-crafted answer.
Thinking of good questions…
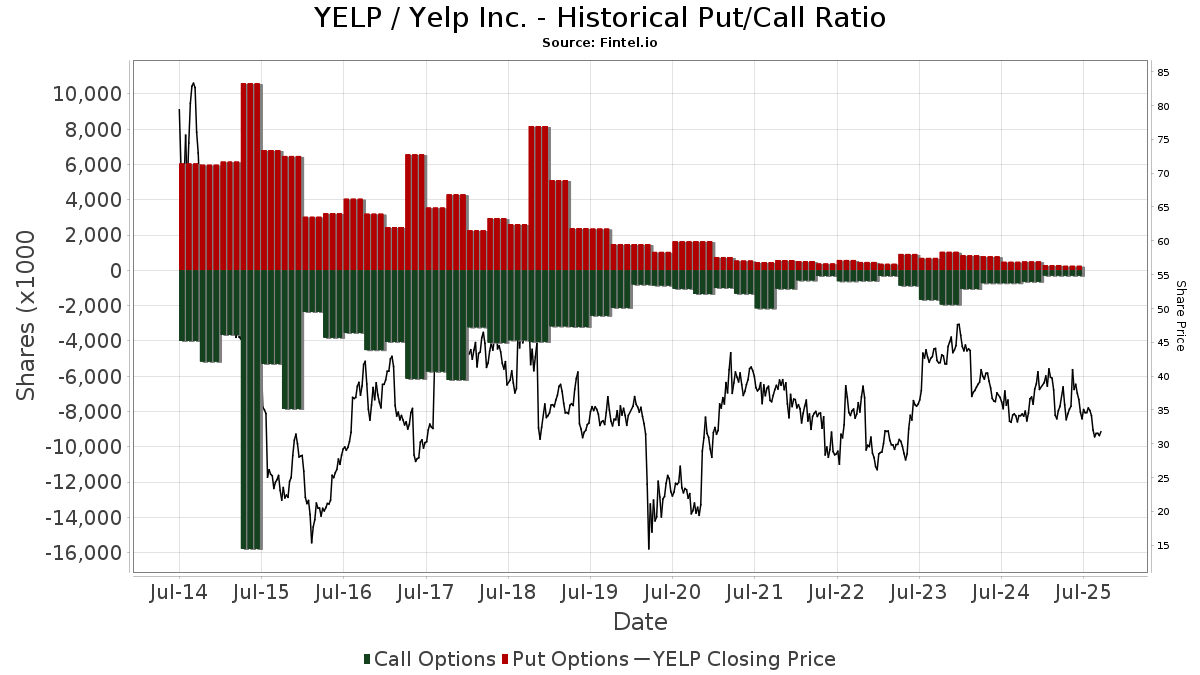
Institutionel Put/Call-forhold
Ud over at indberette standardaktie- og gældsudstedelser skal institutter med mere end 100 mill. aktiver under forvaltning også oplyse deres put- og call-optionsbeholdninger. Da salgsoptioner generelt indikerer negativ stemning, og købsoptioner indikerer positiv stemning, kan vi få en fornemmelse af den overordnede institutionelle stemning ved at plotte forholdet mellem put og kald. Diagrammet til højre viser det historiske put/call-forhold for dette instrument.
Brug af Put/Call Ratio som en indikator for investorernes stemning overvinder en af de vigtigste mangler ved at bruge totalt institutionelt ejerskab, som er, at en betydelig mængde af aktiver under forvaltning investeres passivt for at spore indekser. Passivt forvaltede fonde køber typisk ikke optioner, så indikatoren for put/call-forholdet følger mere nøje følelsen af aktivt forvaltede fonde.
13D/G-arkivering
Vi præsenterer 13D/G ansøgninger separat fra 13F ansøgninger på grund af den forskellige behandling af SEC. 13D/G-ansøgninger kan indgives af grupper af investorer (med én ledende), hvorimod 13F-ansøgninger ikke kan. Dette resulterer i situationer, hvor en investor kan indsende en 13D/G, der rapporterer én værdi for de samlede aktier (der repræsenterer alle de aktier, der ejes af investorgruppen), men derefter indsender en 13F, der rapporterer en anden værdi for de samlede aktier (der udelukkende repræsenterer deres egne) ejendomsret). Det betyder, at aktieejerskab af 13D/G-arkiver og 13F-arkiveringer ofte ikke er direkte sammenlignelige, så vi præsenterer dem separat.
Bemærk: Fra den 16. maj 2021 viser vi ikke længere ejere, der ikke har indsendt en 13D/G inden for det seneste år. Tidligere viste vi den fulde historie af 13D/G-arkiver. Generelt skal enheder, der er forpligtet til at indgive 13D/G-ansøgninger, indgive mindst årligt, før de indsender en afsluttende ansøgning. Dog forlader fonde nogle gange positioner uden at indsende en afsluttende ansøgning (dvs. de afvikler), så visning af den fulde historie resulterede nogle gange i forvirring om det nuværende ejerskab. For at undgå forvirring viser vi nu kun 'aktuelle' ejere - det vil sige - ejere, der har anmeldt inden for det seneste år.
Upgrade to unlock premium data.
| Fil dato | Form | Investor | Forrige Aktier |
Seneste Aktier |
Δ Aktier (Procent) |
Ejendomsret (Procent) |
Δ Ejerskab (Procent) |
|
|---|---|---|---|---|---|---|---|---|
| 2025-10-17 | BlackRock, Inc. | 9,814,025 | 8,846,557 | -9.86 | 14.00 | -7.28 |
13F og NPORT arkivering
Detaljer om 13F-arkivering er gratis. Detaljer om NP-ansøgninger kræver et premium-medlemskab. Grønne rækker angiver nye positioner. Røde rækker angiver lukkede positioner. Klik på linket ikon for at se den fulde transaktionshistorik.
Opgrader
for at låse premium-data op og eksportere til Excel ![]() .
.
| Fil dato | Kilde | Investor | Type | Gennemsnitlig pris (Øst) |
Aktier | Δ Aktier (%) |
Rapporteret Værdi ($1000) |
Δ Værdi (%) |
Port Alloc (%) |
|
|---|---|---|---|---|---|---|---|---|---|---|
| 2026-02-13 | 13F | Great West Life Assurance Co /can/ | 52.798 | -11,24 | 2 | 0,00 | ||||
| 2026-02-06 | 13F | Covestor Ltd | 7.759 | 9,25 | 0 | |||||
| 2026-02-09 | 13F | Royce & Associates Lp | 62.733 | 0,87 | 1.906 | -1,75 | ||||
| 2026-02-06 | 13F | EverSource Wealth Advisors, LLC | 359 | 37,55 | 11 | 25,00 | ||||
| 2026-02-12 | 13F | Ensign Peak Advisors, Inc | 6.859 | -72,90 | 208 | -73,64 | ||||
| 2026-02-17 | 13F | Glenmede Trust Co Na | 0 | -100,00 | 0 | |||||
| 2025-11-21 | 13F | Nebula Research & Development LLC | 0 | -100,00 | 0 | |||||
| 2026-02-17 | 13F | Advisor Group Holdings, Inc. | 1.628 | 107,65 | 49 | 104,17 | ||||
| 2026-02-02 | 13F | Danske Bank A/s | 500 | -97,44 | 15 | -97,53 | ||||
| 2026-01-28 | 13F | Arizona State Retirement System | 16.678 | -7,08 | 507 | -9,48 | ||||
| 2026-04-16 | 13F | SG Americas Securities, LLC | 15.641 | -64,83 | 0 | -100,00 | ||||
| 2025-11-13 | 13F | Riggs Asset Managment Co. Inc. | 0 | -100,00 | 0 | -100,00 | ||||
| 2026-02-13 | 13F/A | Alberta Investment Management Corp | 0 | -100,00 | 0 | |||||
| 2026-04-13 | 13F | St Germain D J Co Inc | 0 | -100,00 | 0 | |||||
| 2026-02-17 | 13F | Two Sigma Advisers, Lp | 54.100 | 6,08 | 1.644 | 3,33 | ||||
| 2026-02-17 | 13F | Lazard Asset Management Llc | 23.934 | 7,68 | 727 | 4,91 | ||||
| 2026-02-06 | 13F | Pnc Financial Services Group, Inc. | 7.204 | 6,00 | 219 | 2,83 | ||||
| 2026-04-07 | 13F | Retirement Wealth Solutions LLC | 40 | 135,29 | 1 | |||||
| 2026-02-11 | 13F | Vestcor Inc | 141.902 | -2,07 | 4 | 0,00 | ||||
| 2026-02-17 | 13F | Quantedge Capital Pte Ltd | 240.400 | 204,30 | 7.306 | 196,47 | ||||
| 2026-02-17 | 13F | Raymond James Financial Inc | 109.298 | -27,38 | 3.322 | -29,27 | ||||
| 2026-04-08 | 13F | NorthCrest Asset Manangement, LLC | 8.798 | 19,36 | 221 | -0,90 | ||||
| 2026-02-06 | 13F | Tredje AP-fonden | 0 | -100,00 | 0 | |||||
| 2026-02-13 | 13F | Bridgewater Associates, LP | 355.732 | -0,05 | 10.811 | -2,65 | ||||
| 2026-02-27 | 13F | Strategic Investment Solutions, Inc. /IL | 0 | -100,00 | 0 | |||||
| 2026-01-12 | 13F | Abound Wealth Management | 0 | -100,00 | 0 | |||||
| 2026-04-08 | 13F | DiNuzzo Private Wealth, Inc. | 2 | -60,00 | 0 | |||||
| 2026-02-13 | 13F | Sterling Capital Management LLC | 388 | 158,67 | 12 | 175,00 | ||||
| 2026-02-19 | 13F | Invesco Ltd. | 220.007 | -24,01 | 6.686 | -25,98 | ||||
| 2025-11-13 | 13F | Connor, Clark & Lunn Investment Management Ltd. | 0 | -100,00 | 0 | |||||
| 2026-02-12 | 13F | State Board Of Administration Of Florida Retirement System | 48.168 | 0,00 | 1.464 | -2,60 | ||||
| 2026-02-13 | 13F | Police & Firemen's Retirement System of New Jersey | 16.038 | -6,39 | 487 | -8,80 | ||||
| 2026-02-02 | 13F | Strs Ohio | 1.800 | -83,93 | 55 | -84,53 | ||||
| 2026-02-18 | 13F | State of Tennessee, Treasury Department | 38.611 | -8,11 | 1.057 | -19,31 | ||||
| 2026-02-06 | 13F | SGL Investment Advisors, Inc. | 87.098 | 8,40 | 2.094 | -21,20 | ||||
| 2026-02-13 | 13F | Pinnacle Wealth Planning Services, Inc. | 1.806 | 55 | ||||||
| 2026-02-12 | 13F | Brown Brothers Harriman & Co | 49 | 1 | ||||||
| 2026-02-17 | 13F | Point72 Asset Management, L.P. | 402.633 | 12.236 | ||||||
| 2026-04-09 | 13F | Camelot Technology Advisors, Inc. | 15.507 | 0,00 | 384 | -18,68 | ||||
| 2026-02-17 | 13F | Qube Research & Technologies Ltd | 210.114 | -61,70 | 6.385 | -62,70 | ||||
| 2025-11-14 | 13F | Texas Permanent School Fund | 0 | -100,00 | 0 | |||||
| 2026-02-13 | 13F | Mariner, LLC | 8.752 | 266 | ||||||
| 2026-02-12 | 13F | Ankerstar Wealth, LLC | 5 | 0 | ||||||
| 2025-11-14 | 13F | Lombard Odier Asset Management (USA) Corp | 0 | -100,00 | 0 | |||||
| 2026-02-13 | 13F | Quarry LP | 16 | -88,06 | 0 | -100,00 | ||||
| 2026-01-29 | 13F | Dunhill Financial, LLC | 1 | 0 | ||||||
| 2026-04-13 | 13F | Bank of New Hampshire | 90 | 0,00 | 2 | 0,00 | ||||
| 2026-02-13 | 13F | Morgan Stanley | 855.881 | -8,75 | 26.010 | -11,12 | ||||
| 2025-11-13 | 13F | Magnetar Financial LLC | 0 | -100,00 | 0 | |||||
| 2026-02-12 | 13F | New York State Common Retirement Fund | 19.862 | 0,00 | 604 | -2,58 | ||||
| 2026-04-08 | 13F | Grove Bank & Trust | 523 | 0,00 | 13 | -20,00 | ||||
| 2026-01-23 | 13F | Sumitomo Mitsui Trust Holdings, Inc. | 12.519 | 0,00 | 380 | -2,56 | ||||
| 2026-02-17 | 13F | Smith Thomas W | 8.000 | -92,33 | 243 | -94,40 | ||||
| 2026-02-09 | 13F | Atlantic Trust, LLC | 0 | -100,00 | 0 | |||||
| 2026-04-20 | 13F | Ronald Blue Trust, Inc. | 2.290 | -48,63 | 57 | -58,52 | ||||
| 2026-01-09 | 13F | Diversified Trust Co | 0 | -100,00 | 0 | |||||
| 2025-10-21 | 13F | Unique Wealth, Llc | 0 | -100,00 | 0 | |||||
| 2026-02-05 | 13F | Dana Investment Advisors, Inc. | 99.168 | 11,25 | 3.014 | 8,34 | ||||
| 2026-01-30 | 13F | New York State Teachers Retirement System | 44.442 | -3,73 | 1 | 0,00 | ||||
| 2026-02-09 | 13F | Fisher Asset Management, LLC | 0 | -100,00 | 0 | -100,00 | ||||
| 2026-02-18 | 13F | Mackenzie Financial Corp | 63.442 | 4,54 | 1.908 | 0,74 | ||||
| 2026-02-02 | 13F | Horizon Investments, LLC | 20.544 | 14,03 | 624 | 11,03 | ||||
| 2026-02-17 | 13F | State Of Wisconsin Investment Board | 79.222 | -10,94 | 2.408 | -13,26 | ||||
| 2026-02-10 | 13F | Envestnet Asset Management Inc | 11.011 | -50,64 | 335 | -51,94 | ||||
| 2026-04-14 | 13F | Bay Harbor Wealth Management, LLC | 2 | -50,00 | 0 | |||||
| 2026-01-27 | 13F | Zurcher Kantonalbank (Zurich Cantonalbank) | 16.289 | 7,20 | 495 | 4,43 | ||||
| 2026-02-12 | 13F | Federated Hermes, Inc. | 47.268 | 99,93 | 1.436 | 94,84 | ||||
| 2026-02-17 | 13F | Susquehanna International Group, Llp | 40.392 | 39,22 | 1.228 | 35,58 | ||||
| 2026-02-17 | 13F | Susquehanna International Group, Llp | Put | 27.700 | -5,14 | 842 | -7,68 | |||
| 2026-01-28 | 13F | Teacher Retirement System Of Texas | 194.495 | 29,02 | 5.911 | 25,66 | ||||
| 2026-02-17 | 13F | Susquehanna International Group, Llp | Call | 75.700 | 55,12 | 2.301 | 51,12 | |||
| 2026-02-11 | 13F | Simplex Trading, Llc | Put | 700 | 0,00 | 21 | ||||
| 2026-02-13 | 13F | OMERS ADMINISTRATION Corp | 0 | -100,00 | 0 | |||||
| 2026-02-13 | 13F | Aigen Investment Management, Lp | 0 | -100,00 | 0 | |||||
| 2026-02-11 | 13F | Simplex Trading, Llc | Call | 3.800 | 322,22 | 115 | ||||
| 2026-02-17 | 13F | Russell Investments Group, Ltd. | 152.096 | -47,99 | 4.608 | -49,65 | ||||
| 2026-02-09 | 13F | Huntington National Bank | 0 | -100,00 | 0 | |||||
| 2026-02-03 | 13F | SBI Securities Co., Ltd. | 316 | -14,13 | 10 | -18,18 | ||||
| 2026-02-17 | 13F | Royal Bank Of Canada | 314.449 | -13,05 | 9.556 | -15,30 | ||||
| 2026-02-13 | 13F | Edgestream Partners, L.P. | 153.014 | 57,54 | 4.650 | 53,47 | ||||
| 2026-01-29 | 13F | Quent Capital, LLC | 40.200 | 1.222 | ||||||
| 2026-02-06 | 13F | FourThought Financial Partners, LLC | 0 | -100,00 | 0 | |||||
| 2026-02-06 | 13F | Lsv Asset Management | 2.682.238 | 11,62 | 82 | 9,46 | ||||
| 2026-02-17 | 13F | Grantham, Mayo, Van Otterloo & Co. LLC | 20.661 | 73,21 | 628 | 68,55 | ||||
| 2026-02-09 | 13F | Councilmark Asset Management, LLC | 7.650 | -0,91 | 232 | -3,33 | ||||
| 2026-04-13 | 13F | Massmutual Trust Co Fsb/adv | 1.166 | 1.077,78 | 29 | 833,33 | ||||
| 2026-01-28 | 13F | Klp Kapitalforvaltning As | 42.500 | 1,43 | 1.292 | -1,22 | ||||
| 2026-02-13 | 13F | Quinn Opportunity Partners LLC | 259.299 | 397,38 | 7.880 | 384,62 | ||||
| 2026-02-12 | 13F | Swiss National Bank | 117.964 | 0,00 | 3.585 | -2,61 | ||||
| 2026-02-11 | 13F | Ameritas Investment Partners, Inc. | 5.167 | 157 | ||||||
| 2026-02-17 | 13F | Maryland State Retirement & Pension System | 8.612 | 0,00 | 262 | -2,61 | ||||
| 2026-04-15 | 13F | Fortitude Family Office, LLC | 0 | -100,00 | 0 | |||||
| 2026-02-12 | 13F | Elo Mutual Pension Insurance Co | 74.748 | -5,39 | 2.272 | -7,83 | ||||
| 2026-02-11 | 13F | Deutsche Bank Ag\ | 53.489 | 3,43 | 1.626 | 0,74 | ||||
| 2026-01-23 | 13F | Robeco Institutional Asset Management B.V. | 653.818 | 56,70 | 19.870 | 52,63 | ||||
| 2025-10-22 | 13F | Geneos Wealth Management Inc. | 0 | -100,00 | 0 | -100,00 | ||||
| 2026-02-03 | 13F | International Assets Investment Management, Llc | 26 | 1 | ||||||
| 2026-02-06 | 13F | Handelsbanken Fonder AB | 16.481 | 0,00 | 1 | |||||
| 2026-02-17 | 13F | Balyasny Asset Management Llc | 0 | -100,00 | 0 | |||||
| 2025-11-17 | 13F | Kestra Investment Management, LLC | 0 | -100,00 | 0 | |||||
| 2026-02-13 | 13F | State Street Corp | 2.336.450 | -0,88 | 71.005 | -3,45 | ||||
| 2026-02-13 | 13F | Ingalls & Snyder Llc | 79.117 | -13,31 | 2 | 0,00 | ||||
| 2026-02-13 | 13F | Virtus ETF Advisers LLC | 2.700 | 0,00 | 82 | -2,38 | ||||
| 2026-02-13 | 13F | Martingale Asset Management L P | 68.279 | 3,85 | 2.075 | 1,17 | ||||
| 2026-02-14 | 13F | Rockefeller Capital Management L.P. | 1.158 | 71,30 | 35 | 66,67 | ||||
| 2026-02-17 | 13F | Optimus Prime Fund Management Co., Ltd. | 850.000 | 0,00 | 25.832 | -2,60 | ||||
| 2026-01-29 | 13F | Vanguard Group Inc | 8.236.074 | -1,98 | 250.294 | -4,52 | ||||
| 2026-02-04 | 13F | Tsfg, Llc | 500 | 0,00 | 0 | |||||
| 2026-02-17 | 13F | Crawford Fund Management, LLC | 523.958 | 99,95 | 15.923 | 94,78 | ||||
| 2026-02-06 | 13F | Larson Financial Group LLC | 250 | 0,00 | 8 | 0,00 | ||||
| 2025-11-07 | 13F | Gsa Capital Partners Llp | 0 | -100,00 | 0 | |||||
| 2026-02-02 | 13F | Fifth Third Bancorp | 1.159 | 70,44 | 35 | 66,67 | ||||
| 2025-10-22 | 13F | Hennion & Walsh Asset Management, Inc. | 0 | -100,00 | 0 | |||||
| 2026-01-27 | 13F | Silver Coast Investments LLC | 7.003 | 0,00 | 213 | -2,75 | ||||
| 2026-02-17 | 13F | Vinva Investment Management Ltd | 27.577 | 12,76 | 1.240 | 6,35 | ||||
| 2026-01-12 | 13F | CVA Family Office, LLC | 0 | -100,00 | 0 | |||||
| 2026-02-11 | 13F | Group One Trading, L.p. | Call | 5.300 | 430,00 | 161 | 419,35 | |||
| 2026-02-11 | 13F | Group One Trading, L.p. | Put | 39.000 | 122,86 | 1.185 | 117,03 | |||
| 2026-02-13 | 13F | Walleye Trading LLC | Put | 2.200 | 67 | |||||
| 2026-02-11 | 13F | Group One Trading, L.p. | 24.810 | 197,41 | 754 | 189,62 | ||||
| 2026-02-13 | 13F | Walleye Trading LLC | Call | 800 | 24 | |||||
| 2026-02-13 | 13F | Walleye Trading LLC | 7.199 | 219 | ||||||
| 2026-04-20 | 13F | State of Alaska, Department of Revenue | 31.038 | -3,03 | 1 | |||||
| 2026-02-13 | 13F | Panagora Asset Management Inc | 98.825 | 10,28 | 3.003 | 7,44 | ||||
| 2026-02-13 | 13F | First Trust Advisors Lp | 81.939 | 8,04 | 2.490 | 5,24 | ||||
| 2026-02-17 | 13F | Optiver Holding B.V. | 0 | -100,00 | 0 | |||||
| 2025-11-13 | 13F | Perbak Capital Partners LLP | 0 | -100,00 | 0 | -100,00 | ||||
| 2025-11-14 | 13F | Axa S.a. | 0 | -100,00 | 0 | |||||
| 2026-02-12 | 13F/A | Headwater Capital Co Ltd | 150.000 | 4.558 | ||||||
| 2026-02-13 | 13F | Verition Fund Management LLC | 141.896 | -19,70 | 4.312 | -21,78 | ||||
| 2026-02-12 | 13F | Skandinaviska Enskilda Banken AB (publ) | 78.600 | -13,63 | 2.389 | -15,89 | ||||
| 2026-04-20 | 13F | CWA Asset Management Group, LLC | 0 | -100,00 | 0 | |||||
| 2025-10-28 | 13F | Fonville Wealth Management LLC | 0 | -100,00 | 0 | |||||
| 2026-02-10 | 13F | Daiwa Securities Group Inc. | 18.100 | -29,02 | 1 | |||||
| 2025-11-13 | 13F | Norges Bank | 0 | -100,00 | 0 | |||||
| 2026-02-17 | 13F | Voloridge Investment Management, Llc | 457.190 | -8,17 | 13.894 | -10,55 | ||||
| 2026-04-15 | 13F | Merit Financial Group, LLC | 8.602 | 213 | ||||||
| 2025-10-28 | 13F | Elevate Capital Advisors, LLC | 0 | -100,00 | 0 | |||||
| 2025-11-14 | 13F | Sherbrooke Park Advisers Llc | 0 | -100,00 | 0 | -100,00 | ||||
| 2026-04-06 | 13F | Versant Capital Management, Inc | 3.626 | 297,15 | 90 | 229,63 | ||||
| 2026-03-09 | 13F | EMC Capital Management | 4.254 | -15,00 | 0 | |||||
| 2026-04-08 | 13F | Miracle Mile Advisors, LLC | 0 | -100,00 | 0 | |||||
| 2026-01-28 | 13F | Universal- Beteiligungs- und Servicegesellschaft mbH | 251.569 | 18,67 | 7.633 | 15,41 | ||||
| 2026-02-17 | 13F | Ameriprise Financial Inc | 238.425 | -84,03 | 7.246 | -84,45 | ||||
| 2026-02-12 | 13F | Clark Estates Inc/ny | 65.100 | 0,00 | 1.978 | -2,61 | ||||
| 2025-11-12 | 13F | Park Square Financial Group, LLC | 0 | -100,00 | 0 | |||||
| 2025-11-12 | 13F | Headlands Technologies LLC | 0 | -100,00 | 0 | |||||
| 2026-02-10 | 13F | Kesler, Norman & Wride, LLC | 38.525 | 1.171 | ||||||
| 2026-04-02 | 13F | Ares Financial Consulting, LLC | 237 | 6 | ||||||
| 2026-01-22 | 13F | Massachusetts Financial Services Co /ma/ | 20.603 | -71,89 | 626 | -72,62 | ||||
| 2026-02-12 | 13F | South Dakota Investment Council | 5.100 | -8,93 | 0 | |||||
| 2025-11-14 | 13F | Jain Global LLC | 0 | -100,00 | 0 | -100,00 | ||||
| 2026-02-17 | 13F | Public Employees Retirement System Of Ohio | 1.855 | 1,26 | 56 | -1,75 | ||||
| 2025-11-14 | 13F | Centiva Capital, LP | 0 | -100,00 | 0 | -100,00 | ||||
| 2026-02-13 | 13F | Walleye Capital LLC | 5.737 | 174 | ||||||
| 2026-02-13 | 13F | Arrowstreet Capital, Limited Partnership | 1.814.123 | -8,20 | 55.131 | -10,58 | ||||
| 2026-02-13 | 13F | Walleye Capital LLC | Put | 5.100 | 155 | |||||
| 2026-02-13 | 13F | Umb Bank N A/mo | 321 | 107,10 | 10 | 125,00 | ||||
| 2026-02-10 | 13F/A | Suncoast Equity Management | 21.130 | -6,19 | 642 | -8,55 | ||||
| 2026-02-10 | 13F | Axq Capital, Lp | 0 | -100,00 | 0 | |||||
| 2026-02-17 | 13F | Captrust Financial Advisors | 12.253 | 10,60 | 372 | 7,83 | ||||
| 2026-02-23 | 13F | Leonteq Securities AG | 0 | -100,00 | 0 | |||||
| 2026-02-10 | 13F/A | Northwestern Mutual Wealth Management Co | 17 | -57,50 | 1 | -100,00 | ||||
| 2026-02-11 | 13F | Meeder Asset Management Inc | 71.196 | 258,18 | 2.164 | 248,87 | ||||
| 2026-02-18 | 13F | Vident Advisory, LLC | 142.943 | 15,51 | 4.344 | 12,51 | ||||
| 2026-02-17 | 13F | Altshuler Shaham Ltd | 136 | 2,26 | 4 | 0,00 | ||||
| 2026-02-12 | 13F | Jane Street Group, Llc | 0 | -100,00 | 0 | -100,00 | ||||
| 2026-02-13 | 13F | Rhumbline Advisers | 167.484 | -12,90 | 5.090 | -15,17 | ||||
| 2026-02-13 | 13F | Victory Capital Management Inc | 235.436 | 10,37 | 7.155 | 7,50 | ||||
| 2026-02-02 | 13F | Principal Financial Group Inc | 374.675 | 7,16 | 11.386 | 4,38 | ||||
| 2026-01-26 | 13F | Moran Wealth Management, LLC | 108.797 | -10,49 | 3.306 | -12,82 | ||||
| 2026-02-05 | 13F | Thrivent Financial For Lutherans | 40.141 | -7,12 | 1 | 0,00 | ||||
| 2026-02-17 | 13F | Summit Global Investments | 37.796 | -0,48 | 1 | 0,00 | ||||
| 2026-02-17 | 13F | Atom Investors LP | 0 | -100,00 | 0 | |||||
| 2025-11-21 | 13F/A | CIBC Bancorp USA Inc. | 6.593 | 206 | ||||||
| 2026-02-19 | 13F/A | T. Rowe Price Investment Management, Inc. | 127 | 0 | ||||||
| 2026-02-17 | 13F | Mercer Global Advisors Inc /adv | 11.615 | 353 | ||||||
| 2026-02-03 | 13F | Mitsubishi UFJ Kokusai Asset Management Co., Ltd. | 134 | 0,00 | 4 | 0,00 | ||||
| 2026-01-29 | 13F | Camelot Portfolios, LLC | 9.706 | -9,63 | 295 | -12,24 | ||||
| 2026-02-11 | 13F | Hughes Financial Services, LLC | 0 | -100,00 | 0 | |||||
| 2026-02-17 | 13F | Tenzing Global Management, LLC | 60.000 | 1.823 | ||||||
| 2026-02-17 | 13F | Fmr Llc | 619.917 | 23,01 | 18.839 | 19,82 | ||||
| 2026-02-17 | 13F | Engineers Gate Manager LP | 69.884 | 34,67 | 2.124 | 31,21 | ||||
| 2026-01-29 | 13F | DecisionPoint Financial, LLC | 6 | 0,00 | 0 | |||||
| 2026-02-12 | 13F | Renaissance Technologies Llc | 844.634 | -13,14 | 25.668 | -15,39 | ||||
| 2026-04-13 | 13F | True Wealth Design, LLC | 303 | 50,00 | 7 | 16,67 | ||||
| 2026-02-13 | 13F | Public Employees Retirement Association Of Colorado | 5.759 | 0,00 | 0 | |||||
| 2025-10-24 | 13F | Hemington Wealth Management | 95 | -22,13 | 0 | |||||
| 2026-02-12 | 13F | Voya Investment Management Llc | 168.659 | 1,64 | 5.126 | -1,00 | ||||
| 2026-02-09 | 13F | Ceera Investments, Llc | 192.442 | -17,24 | 5.848 | -19,39 | ||||
| 2026-02-12 | 13F | Campbell & CO Investment Adviser LLC | 15.747 | -35,90 | 479 | -37,60 | ||||
| 2026-02-06 | 13F | Bare Financial Services, Inc | 32 | -15,79 | 1 | -100,00 | ||||
| 2026-02-17 | 13F | Millennium Management Llc | 159.945 | -44,88 | 4.861 | -46,32 | ||||
| 2026-02-13 | 13F | Acumen Wealth Advisors, LLC | 263 | 8 | ||||||
| 2026-01-29 | 13F | D.a. Davidson & Co. | 11.564 | 351 | ||||||
| 2026-02-12 | 13F | MetLife Investment Management, LLC | 34.495 | -6,51 | 1.048 | -8,95 | ||||
| 2026-02-17 | 13F | Amundi | 64.255 | 486,80 | 1.953 | 443,73 | ||||
| 2026-01-30 | 13F | Mitsubishi UFJ Trust & Banking Corp | 159.804 | -15,87 | 4.856 | -18,06 | ||||
| 2026-02-05 | 13F | Bessemer Group Inc | 103.602 | 31.294,55 | 3 | |||||
| 2026-01-28 | 13F | Salomon & Ludwin, LLC | 298 | -21,58 | 9 | -25,00 | ||||
| 2026-02-13 | 13F | Bridgefront Capital, LLC | 0 | -100,00 | 0 | |||||
| 2026-02-17 | 13F | Quadrature Capital Ltd | 8.034 | 244 | ||||||
| 2026-02-02 | 13F | Truist Financial Corp | 7.868 | -72,96 | 239 | -73,65 | ||||
| 2026-02-11 | 13F | Modus Advisors, LLC | 2.903 | 88 | ||||||
| 2026-02-06 | 13F | Global Retirement Partners, LLC | 351 | 401,43 | 11 | 400,00 | ||||
| 2026-04-20 | 13F | Louisiana State Employees Retirement System | 25.900 | -3,36 | 641 | -21,38 | ||||
| 2026-01-23 | 13F | Avion Wealth | 32 | 100,00 | 0 | |||||
| 2025-11-14 | 13F | AXA Investment Managers S.A. | 115.864 | 3.615 | ||||||
| 2026-02-13 | 13F | JustInvest LLC | 12.983 | 24,43 | 395 | 21,23 | ||||
| 2026-01-30 | 13F | Torren Management, LLC | 20 | 1 | ||||||
| 2025-11-14 | 13F | Twinbeech Capital Lp | 0 | -100,00 | 0 | |||||
| 2026-02-13 | 13F | Aurora Investment Counsel | 69.719 | 5,40 | 2.119 | 2,67 | ||||
| 2026-02-12 | 13F | Alps Advisors Inc | 14.870 | 0,84 | 452 | -1,96 | ||||
| 2026-02-05 | 13F | HFM Investment Advisors, LLC | 2 | -33,33 | 0 | |||||
| 2025-11-06 | 13F | Assetmark, Inc | 0 | -100,00 | 0 | |||||
| 2026-01-29 | 13F | UBS Group AG | 875.826 | 20,94 | 26.616 | 17,80 | ||||
| 2026-02-12 | 13F | Principal Securities, Inc. | 0 | -100,00 | 0 | -100,00 | ||||
| 2026-02-13 | 13F | Barclays Plc | 124.748 | 12,61 | 3.791 | 9,69 | ||||
| 2026-02-13 | 13F | Sei Investments Co | 276.715 | -1,42 | 8.409 | -3,98 | ||||
| 2026-02-17 | 13F | Janus Henderson Group Plc | 26.826 | 0,00 | 815 | -2,51 | ||||
| 2026-01-22 | 13F | Bfsg, Llc | 0 | -100,00 | 0 | |||||
| 2026-02-17 | 13F | Odyssean, LLC | 24.902 | 757 | ||||||
| 2026-01-20 | 13F | Sovran Advisors, LLC | 37.386 | 1.090 | ||||||
| 2026-02-13 | 13F | Marshall Wace, Llp | 156.751 | -16,48 | 4.764 | -18,65 | ||||
| 2026-02-09 | 13F | Legal & General Group Plc | 170.138 | -2,49 | 5.170 | -5,02 | ||||
| 2026-02-17 | 13F | California State Teachers Retirement System | 58.167 | -0,23 | 1.768 | -2,81 | ||||
| 2026-02-13 | 13F | Caitong International Asset Management Co., Ltd | 593 | 18 | ||||||
| 2026-02-10 | 13F | Acadian Asset Management Llc | 2.239.454 | -5,13 | 68 | -6,85 | ||||
| 2026-02-17 | 13F | Advisory Services Network, LLC | 0 | -100,00 | 0 | |||||
| 2025-11-14 | 13F | Walleye Capital LLC | Call | 0 | -100,00 | 0 | -100,00 | |||
| 2026-02-13 | 13F | Wells Fargo & Company/mn | 80.213 | 68,32 | 2.438 | 64,00 | ||||
| 2026-02-10 | 13F | State of Wyoming | 13.003 | 18,16 | 395 | 15,16 | ||||
| 2026-02-13 | 13F | American Century Companies Inc | 1.022.822 | 24,27 | 31.084 | 21,04 | ||||
| 2025-11-13 | 13F | Natixis Advisors, L.p. | 0 | -100,00 | 0 | |||||
| 2025-11-06 | 13F | MQS Management LLC | 0 | -100,00 | 0 | -100,00 | ||||
| 2026-02-09 | 13F | Hartland & Co., LLC | 7 | 75,00 | 0 | |||||
| 2026-02-17 | 13F | Alliancebernstein L.p. | 153.426 | 3,27 | 4.663 | 0,58 | ||||
| 2026-02-10 | 13F | Mutual Of America Capital Management Llc | 6.677 | -0,51 | 203 | -3,35 | ||||
| 2026-02-13 | 13F | Transamerica Financial Advisors, Inc. | 42 | 1 | ||||||
| 2026-02-17 | 13F | Canada Pension Plan Investment Board | 6.900 | 210 | ||||||
| 2026-02-17 | 13F | Dark Forest Capital Management Lp | 0 | -100,00 | 0 | -100,00 | ||||
| 2026-02-17 | 13F | Capstone Investment Advisors, Llc | 0 | -100,00 | 0 | -100,00 | ||||
| 2026-01-21 | 13F | SJS Investment Consulting Inc. | 30 | 500,00 | 1 | |||||
| 2026-02-13 | 13F | National Bank Of Canada /fi/ | 24 | 1 | ||||||
| 2026-01-20 | 13F | Harbor Capital Advisors, Inc. | 131 | -1,50 | 0 | |||||
| 2026-04-15 | 13F | Exchange Traded Concepts, Llc | 69.533 | 69,78 | 1.720 | 38,26 | ||||
| 2026-02-05 | 13F | Amalgamated Bank | 17.046 | -1,52 | 1 | |||||
| 2026-02-17 | 13F | Aster Capital Management (DIFC) Ltd | 592 | 18 | ||||||
| 2026-02-24 | 13F | DGS Capital Management, LLC | 11.706 | -16,04 | 356 | -18,39 | ||||
| 2026-02-17 | 13F | Cresset Asset Management, LLC | 45.266 | 0,29 | 1.376 | -2,34 | ||||
| 2026-02-13 | 13F | Goodnow Investment Group, Llc | 637.180 | -10,22 | 19.364 | -12,56 | ||||
| 2026-02-12 | 13F | Aviva Plc | 16.264 | 6,47 | 494 | 3,78 | ||||
| 2026-02-17 | 13F | Hancock Whitney Corp | 6.641 | -6,03 | 202 | -8,64 | ||||
| 2026-04-10 | 13F/A | OP Asset Management Ltd | 598.074 | 4.395,44 | 14.796 | 3.465,30 | ||||
| 2026-04-13 | 13F | IFP Advisors, Inc | 285 | 111,11 | 7 | 75,00 | ||||
| 2026-02-17 | 13F | Delaware Management Holdings, Inc. | 919.716 | 27.950 | ||||||
| 2026-02-13 | 13F | Manufacturers Life Insurance Company, The | 0 | -100,00 | 0 | |||||
| 2026-02-11 | 13F | Gilpin Wealth Management, Llc | 4 | 0 | ||||||
| 2026-02-13 | 13F | Hudson Bay Capital Management LP | 0 | -100,00 | 0 | |||||
| 2025-11-12 | 13F | NewSquare Capital LLC | 0 | -100,00 | 0 | |||||
| 2026-02-17 | 13F | Price T Rowe Associates Inc /md/ | 63.360 | 6,83 | 2 | 0,00 | ||||
| 2026-02-09 | 13F | Hantz Financial Services, Inc. | 1.297 | 181,34 | 0 | |||||
| 2026-02-10 | 13F | Commonwealth Of Pennsylvania Public School Empls Retrmt Sys | 14.462 | -5,21 | 440 | -7,77 | ||||
| 2026-02-17 | 13F | Capital Fund Management S.a. | 70.510 | -34,68 | 2.143 | -36,40 | ||||
| 2026-02-13 | 13F | Jacobs Levy Equity Management, Inc | 187.205 | -47,60 | 5.689 | -48,96 | ||||
| 2026-02-17 | 13F | Cambria Investment Management, L.P. | 281.772 | 16,30 | 8.563 | 13,28 | ||||
| 2025-11-06 | 13F | Whipplewood Advisors, LLC | 0 | -100,00 | 0 | |||||
| 2026-01-29 | 13F | Teachers Retirement System Of The State Of Kentucky | 15.416 | -16,19 | 0 | |||||
| 2026-02-19 | 13F | CI Private Wealth, LLC | 8.302 | 5,92 | 252 | 3,28 | ||||
| 2026-02-17 | 13F | MIRAE ASSET GLOBAL ETFS HOLDINGS Ltd. | 65.574 | -5,05 | 1.993 | -7,52 | ||||
| 2026-02-09 | 13F | Geode Capital Management, Llc | 1.738.095 | -2,08 | 52.828 | -4,62 | ||||
| 2026-02-17 | 13F | Tower Research Capital LLC (TRC) | 1.084 | -79,65 | 33 | -80,72 | ||||
| 2026-01-26 | 13F | Cwm, Llc | 31.748 | 7,39 | 1 | |||||
| 2026-01-21 | 13F | Yousif Capital Management, Llc | 15.817 | -14,77 | 443 | -23,49 | ||||
| 2026-02-17 | 13F | Aqr Capital Management Llc | 385.336 | 99,55 | 11.602 | 92,60 | ||||
| 2026-03-24 | 13F/A | Barclays Plc | Put | 0 | -100,00 | 0 | -100,00 | |||
| 2026-02-09 | 13F | Jefferies Financial Group Inc. | 19.902 | -50,20 | 605 | -51,52 | ||||
| 2026-02-26 | 13F/A | Aristides Capital LLC | 6.605 | -24,04 | 201 | -26,20 | ||||
| 2026-04-06 | 13F | CX Institutional | 0 | -100,00 | 0 | |||||
| 2026-01-16 | 13F | RHS Financial, LLC | 10.175 | -0,93 | 309 | -3,44 | ||||
| 2026-02-17 | 13F | Man Group plc | 619.556 | -15,49 | 18.828 | -17,68 | ||||
| 2026-01-30 | 13F | Jennison Associates Llc | 0 | -100,00 | 0 | |||||
| 2026-03-06 | 13F | Hsbc Holdings Plc | 40.633 | 33,53 | 1.231 | 29,88 | ||||
| 2026-01-27 | 13F | WealthCollab, LLC | 717 | 39,49 | 22 | 31,25 | ||||
| 2025-11-07 | 13F | Wincap Financial Llc | 0 | -100,00 | 0 | |||||
| 2026-01-16 | 13F | Marquette Asset Management, LLC | 0 | -100,00 | 0 | |||||
| 2026-01-30 | 13F | North Star Investment Management Corp. | 24.086 | 0,36 | 732 | -2,27 | ||||
| 2026-02-13 | 13F | Citigroup Inc | 18.650 | -27,98 | 567 | -29,86 | ||||
| 2026-01-29 | 13F | Pictet Asset Management Holding SA | 9.826 | 0,00 | 299 | -2,61 | ||||
| 2026-02-04 | 13F | Oregon Public Employees Retirement Fund | 13.407 | -0,74 | 407 | -3,33 | ||||
| 2026-01-28 | 13F | DekaBank Deutsche Girozentrale | 3.258 | 0,00 | 0 | |||||
| 2026-02-24 | 13F | River Road Asset Management, LLC | 1.161.711 | 1,38 | 35.304 | -1,25 | ||||
| 2026-02-13 | 13F | Neuberger Berman Group LLC | 7.384 | 224 | ||||||
| 2026-02-13 | 13F | Y-Intercept (Hong Kong) Ltd | 80.878 | -52,52 | 2.458 | -53,76 | ||||
| 2026-02-11 | 13F | LPL Financial LLC | 0 | -100,00 | 0 | |||||
| 2025-11-07 | 13F | Readystate Asset Management Lp | 0 | -100,00 | 0 | |||||
| 2026-02-11 | 13F | Allianz Asset Management GmbH | 1.164.784 | 25,80 | 35.398 | 22,53 | ||||
| 2025-11-14 | 13F | Susquehanna Fundamental Investments, Llc | 0 | -100,00 | 0 | |||||
| 2026-02-10 | 13F | Bnp Paribas Arbitrage, Sa | 358.902 | 5,49 | 10.907 | 2,75 | ||||
| 2026-02-17 | 13F | Abel Hall, LLC | 7.008 | 213 | ||||||
| 2026-01-29 | 13F | UMA Financial Services, Inc. | 95 | 3 | ||||||
| 2026-02-10 | 13F | Td Asset Management Inc | 9.700 | 295 | ||||||
| 2026-02-12 | 13F | BlackRock, Inc. | 9.689.923 | 1,45 | 294.477 | -1,19 | ||||
| 2026-02-10 | 13F | Rothschild Investment Llc | 91 | 3 | ||||||
| 2026-04-02 | 13F | Aspect Partners, LLC | 146 | 4,29 | 4 | -25,00 | ||||
| 2026-02-11 | 13F | Parallel Advisors, LLC | 704 | -46,05 | 21 | -47,50 | ||||
| 2026-04-17 | 13F | Bell Investment Advisors, Inc | 387 | -11,03 | 10 | -30,77 | ||||
| 2026-02-12 | 13F | Xponance, Inc. | 13.322 | -0,39 | 405 | -3,12 | ||||
| 2026-02-10 | 13F | Intech Investment Management Llc | 26.608 | -13,89 | 809 | -16,18 | ||||
| 2026-02-11 | 13F | Franklin Resources Inc | 64.064 | -52,30 | 1.947 | -53,56 | ||||
| 2026-04-07 | 13F | Farther Finance Advisors, LLC | 1.443 | 411,70 | 36 | 350,00 | ||||
| 2026-01-30 | 13F | NJ State Employees Deferred Compensation Plan | 0 | -100,00 | 0 | |||||
| 2026-02-11 | 13F | O'shaughnessy Asset Management, Llc | 30.981 | -7,83 | 942 | -10,21 | ||||
| 2026-02-13 | 13F | Public Sector Pension Investment Board | 0 | -100,00 | 0 | |||||
| 2026-04-14 | 13F | Banque Pictet & Cie Sa | 0 | -100,00 | 0 | |||||
| 2026-04-06 | 13F | GAMMA Investing LLC | 4.144 | 634,75 | 103 | 500,00 | ||||
| 2026-02-12 | 13F | Cibc World Markets Corp | 0 | -100,00 | 0 | |||||
| 2026-02-10 | 13F | Quantbot Technologies LP | 16.432 | 499 | ||||||
| 2026-02-02 | 13F | One Wealth Advisors, LLC | 10.347 | -21,33 | 314 | -23,41 | ||||
| 2026-01-15 | 13F | Nisa Investment Advisors, Llc | 2.596 | -17,09 | 79 | -19,59 | ||||
| 2026-02-13 | 13F | MAI Capital Management | 128 | -82,42 | 4 | -86,36 | ||||
| 2025-11-04 | 13F | Guerra Advisors Inc | 6 | 0 | ||||||
| 2026-02-12 | 13F | Wealthspire Advisors, LLC | 0 | -100,00 | 0 | |||||
| 2026-02-17 | 13F | Creative Planning | 74.806 | 99,63 | 2.273 | 94,44 | ||||
| 2025-10-28 | 13F | Qrg Capital Management, Inc. | 0 | -100,00 | 0 | |||||
| 2026-01-12 | 13F | Rialto Wealth Management, LLC | 4 | -33,33 | 0 | |||||
| 2026-02-12 | 13F | Quadrant Capital Group Llc | 9.379 | 0,81 | 285 | -1,72 | ||||
| 2026-02-10 | 13F | Bank of New York Mellon Corp | 395.155 | -3,06 | 12.009 | -5,58 | ||||
| 2026-02-13 | 13F | Macquarie Group Ltd | 0 | -100,00 | 0 | |||||
| 2026-02-17 | 13F | XTX Topco Ltd | 122.881 | 1.808,98 | 3.734 | 1.767,00 | ||||
| 2025-11-04 | 13F | Cornerstone Planning Group LLC | 0 | -100,00 | 0 | |||||
| 2026-02-10 | 13F | Jupiter Asset Management Ltd | 884.522 | 4,31 | 26.881 | 1,60 | ||||
| 2026-02-17 | 13F | Watershed Asset Management, L.L.C. | 14.630 | 445 | ||||||
| 2026-02-04 | 13F | Pacer Advisors, Inc. | 400.362 | -4,85 | 12.167 | -7,31 | ||||
| 2026-02-12 | 13F | BRYN MAWR TRUST Co | 0 | -100,00 | 0 | -100,00 | ||||
| 2026-02-12 | 13F | CIBC Private Wealth Group, LLC | 307 | -65,58 | 9 | -66,67 | ||||
| 2026-01-26 | 13F | KBC Group NV | 1.990 | 0,00 | 0 | |||||
| 2026-01-27 | 13F | Meritage Portfolio Management | 8.247 | -22,67 | 251 | -24,70 | ||||
| 2026-02-04 | 13F | Summit Wealth Group Llc / Co | 0 | -100,00 | 0 | -100,00 | ||||
| 2025-11-14 | 13F | Skopos Labs, Inc. | 0 | -100,00 | 0 | |||||
| 2026-02-12 | 13F | Cloud Capital Management, LLC | 0 | -100,00 | 0 | |||||
| 2026-01-29 | 13F | Comerica Bank | 57.641 | 45,77 | 1.752 | 42,01 | ||||
| 2026-02-13 | 13F | Prudential Financial Inc | 73.802 | -9,65 | 2.243 | -12,01 | ||||
| 2026-02-18 | 13F | EP Wealth Advisors, Inc. | 9.506 | -3,89 | 289 | -14,79 | ||||
| 2026-01-27 | 13F | First Horizon Corp | 397 | 49,25 | 12 | 50,00 | ||||
| 2026-02-17 | 13F | Brevan Howard Capital Management LP | 0 | -100,00 | 0 | |||||
| 2026-02-17 | 13F | Gotham Asset Management, LLC | 89.513 | -19,90 | 2.720 | -21,97 | ||||
| 2026-02-17 | 13F | Holocene Advisors, LP | 8.679 | -55,26 | 264 | -56,53 | ||||
| 2026-02-17 | 13F | Bank Of America Corp /de/ | 323.746 | 50,50 | 9.839 | 46,60 | ||||
| 2026-02-12 | 13F | Integrated Quantitative Investments LLC | 61.386 | 11,91 | 1.866 | 9,00 | ||||
| 2025-11-05 | 13F | Gallacher Capital Management LLC | 0 | -100,00 | 0 | |||||
| 2026-02-13 | 13F | SRS Capital Advisors, Inc. | 73 | -92,56 | 2 | -93,33 | ||||
| 2026-04-20 | 13F | Assenagon Asset Management S.A. | 162.435 | 47,45 | 4.019 | 20,05 | ||||
| 2026-01-26 | 13F | Lakewood Asset Management LLC | 6.641 | 202 | ||||||
| 2026-02-17 | 13F | Jones Financial Companies Lllp | 22 | -69,44 | 1 | -100,00 | ||||
| 2026-02-11 | 13F | Janney Montgomery Scott LLC | 0 | -100,00 | 0 | |||||
| 2026-01-06 | 13F | Sanctuary Advisors, LLC | 0 | -100,00 | 0 | |||||
| 2026-02-13 | 13F | Landscape Capital Management, L.l.c. | 26.597 | -17,34 | 808 | -19,44 | ||||
| 2026-02-09 | 13F | Harbour Investments, Inc. | 48 | 0,00 | 1 | 0,00 | ||||
| 2026-02-11 | 13F | Cerity Partners LLC | 0 | -100,00 | 0 | |||||
| 2026-02-12 | 13F | Jane Street Group, Llc | Put | 31.300 | 41,63 | 951 | 38,03 | |||
| 2026-04-07 | 13F | Signaturefd, Llc | 2.110 | 0,62 | 52 | -17,46 | ||||
| 2026-02-10 | 13F | Hillsdale Investment Management Inc. | 190.516 | -0,31 | 5.790 | -2,90 | ||||
| 2026-02-12 | 13F | Jane Street Group, Llc | Call | 14.600 | 444 | |||||
| 2026-02-10 | 13F | Godfrey Financial Associates, Inc. | 10 | 0 | ||||||
| 2026-02-12 | 13F | Pinnacle Holdings, LLC | 36.229 | 1,09 | 1.101 | -1,61 | ||||
| 2026-01-27 | 13F | Evergreen Capital Management Llc | 32.795 | 997 | ||||||
| 2026-02-17 | 13F | Citadel Advisors Llc | 112.434 | -44,79 | 3.417 | -46,23 | ||||
| 2026-02-17 | 13F | Citadel Advisors Llc | Put | 64.600 | 16,61 | 1.963 | 13,60 | |||
| 2026-02-17 | 13F | Citadel Advisors Llc | Call | 104.900 | 82,43 | 3.188 | 77,65 | |||
| 2026-04-13 | 13F | Cascade Investment Advisors, Inc. | 41.100 | -7,64 | 1.017 | -24,85 | ||||
| 2026-01-29 | 13F | IMC-Chicago, LLC | 0 | -100,00 | 0 | -100,00 | ||||
| 2026-02-06 | 13F | ProShare Advisors LLC | 11.749 | 1,14 | 357 | -1,38 | ||||
| 2026-02-05 | 13F | Allworth Financial LP | 694 | -2,94 | 21 | -4,55 | ||||
| 2026-02-17 | 13F | New Vernon Capital Holdings II LLC | 5.556 | -0,47 | 169 | -3,45 | ||||
| 2026-02-03 | 13F | Bokf, Na | 10.033 | -22,39 | 305 | -24,57 | ||||
| 2025-11-10 | 13F | Chase Investment Counsel Corp | 0 | -100,00 | 0 | |||||
| 2025-11-12 | 13F | Steward Partners Investment Advisory, Llc | 0 | -100,00 | 0 | |||||
| 2026-01-29 | 13F | Mendel Money Management | 0 | -100,00 | 0 | |||||
| 2026-02-11 | 13F | Los Angeles Capital Management Llc | 351 | 11 | ||||||
| 2026-02-17 | 13F | Northern Trust Corp | 602.046 | -9,30 | 18.296 | -11,66 | ||||
| 2026-02-12 | 13F | JPL Wealth Management, LLC | 0 | -100,00 | 0 | |||||
| 2026-02-03 | 13F | Farmers & Merchants Investments Inc | 35 | -12,50 | 1 | 0,00 | ||||
| 2025-11-14 | 13F | Trexquant Investment LP | 0 | -100,00 | 0 | |||||
| 2026-02-12 | 13F | Bank Of Montreal /can/ | 6.653 | 202 | ||||||
| 2025-11-14 | 13F | RBF Capital, LLC | 0 | -100,00 | 0 | |||||
| 2025-11-12 | 13F | Fox Run Management, L.l.c. | 0 | -100,00 | 0 | -100,00 | ||||
| 2025-11-13 | 13F | Jump Financial, LLC | 0 | -100,00 | 0 | |||||
| 2025-10-28 | 13F | Oversea-Chinese Banking CORP Ltd | 0 | -100,00 | 0 | |||||
| 2026-02-11 | 13F | Illinois Municipal Retirement Fund | 31.107 | -6,37 | 945 | -8,78 | ||||
| 2026-02-13 | 13F | Smartleaf Asset Management LLC | 1.371 | -18,30 | 41 | -21,15 | ||||
| 2026-03-12 | 13F/A | Peak6 Llc | Call | 10.500 | 0,00 | 319 | -2,45 | |||
| 2026-02-12 | 13F | Advisors Asset Management, Inc. | 2.592 | -12,40 | 79 | -15,22 | ||||
| 2026-02-11 | 13F | Empowered Funds, LLC | 125.372 | 84,09 | 3.810 | 79,38 | ||||
| 2026-02-04 | 13F | Swiss Life Asset Management Ltd | 7.731 | 235 | ||||||
| 2026-02-10 | 13F | Globeflex Capital L P | 0 | -100,00 | 0 | |||||
| 2026-02-11 | 13F | Jpmorgan Chase & Co | 348.477 | -20,72 | 10.590 | -22,77 | ||||
| 2026-02-17 | 13F | D. E. Shaw & Co., Inc. | 173.309 | -36,81 | 5.267 | -38,45 | ||||
| 2026-02-13 | 13F | Charles Schwab Investment Management Inc | 999.878 | -1,83 | 30.386 | -4,38 | ||||
| 2025-10-22 | 13F | Asset Management One Co., Ltd. | 0 | -100,00 | 0 | |||||
| 2026-04-08 | 13F | Wealth Enhancement Advisory Services, Llc | 29.445 | 130,25 | 519 | 32,40 | ||||
| 2025-11-13 | 13F | Bank Julius Baer & Co. Ltd, Zurich | 0 | -100,00 | 0 | |||||
| 2026-02-09 | 13F | Keating Financial Advisory Services, Inc. | 18 | 1 | ||||||
| 2026-02-10 | 13F | Goldman Sachs Group Inc | Put | 85.500 | 0,00 | 2.598 | -2,59 | |||
| 2025-11-14 | 13F | Susquehanna Portfolio Strategies, LLC | 0 | -100,00 | 0 | |||||
| 2026-02-10 | 13F | Goldman Sachs Group Inc | 817.527 | 28,20 | 24.845 | 24,88 | ||||
| 2026-02-10 | 13F | Goldman Sachs Group Inc | Call | 125.700 | 0,00 | 3.820 | -2,58 | |||
| 2026-02-13 | 13F | BNP Paribas Asset Management Holding S.A. | 110.636 | 12.690,29 | 3 | |||||
| 2026-02-09 | 13F | Quest Partners LLC | 6.402 | -93,90 | 195 | -94,07 | ||||
| 2025-11-07 | 13F | State of New Jersey Common Pension Fund D | 0 | -100,00 | 0 | -100,00 | ||||
| 2025-11-13 | 13F | Inceptionr Llc | 0 | -100,00 | 0 | |||||
| 2026-02-17 | 13F | Freestone Grove Partners LP | 24.880 | -20,21 | 756 | -22,22 | ||||
| 2026-02-13 | 13F | Parkside Financial Bank & Trust | 504 | 4.940,00 | 15 | |||||
| 2025-10-30 | 13F | Twin Peaks Wealth Advisors, LLC | 0 | -100,00 | 0 | |||||
| 2026-02-04 | 13F | Virginia Retirement Systems Et Al | 8.800 | 267 | ||||||
| 2025-11-12 | 13F | Modern Wealth Management, LLC | 0 | -100,00 | 0 | |||||
| 2026-02-11 | 13F | Picton Mahoney Asset Management | 39.339 | 1.196 | ||||||
| 2025-11-14 | 13F | Wolverine Trading, Llc | 8.237 | 258 | ||||||
| 2025-11-14 | 13F | Wolverine Trading, Llc | Put | 17.800 | 95,60 | 558 | 78,85 | |||
| 2026-02-17 | 13F | Petrus Trust Company, LTA | 0 | -100,00 | 0 | |||||
| 2026-02-12 | 13F | Nuveen, LLC | 138.471 | -2,75 | 4.208 | -5,27 | ||||
| 2026-01-14 | 13F | Spire Wealth Management | 19 | -75,00 | 1 | -100,00 | ||||
| 2026-01-21 | 13F | Newbridge Financial Services Group, Inc. | 3.950 | 0,00 | 120 | -2,44 | ||||
| 2026-02-13 | 13F | Ubs Asset Management Americas Inc | 127.848 | -10,45 | 3.885 | -12,78 | ||||
| 2026-02-09 | 13F | New Age Alpha Advisors, LLC | 0 | -100,00 | 0 | |||||
| 2026-02-12 | 13F | Dimensional Fund Advisors Lp | 2.226.666 | 7,56 | 67.666 | 4,76 | ||||
| 2026-01-14 | 13F | Jfs Wealth Advisors, Llc | 38 | 58,33 | 1 | |||||
| 2026-01-29 | 13F | IMC-Chicago, LLC | Put | 24.100 | -30,75 | 732 | -32,53 | |||
| 2026-01-29 | 13F | IMC-Chicago, LLC | Call | 25.000 | -3,47 | 760 | -6,06 | |||
| 2026-02-02 | 13F | Hussman Strategic Advisors, Inc. | 0 | -100,00 | 0 | |||||
| 2026-02-12 | 13F | denkapparat Operations GmbH | 28.036 | 18,29 | 852 | 15,29 | ||||
| 2026-01-30 | 13F | Us Bancorp \de\ | 1.163 | -5,14 | 35 | -7,89 | ||||
| 2026-02-10 | 13F | Root Financial Partners, LLC | 108 | -31,21 | 3 | -25,00 | ||||
| 2026-01-20 | 13F | Stratos Wealth Advisors, LLC | 94.461 | 33,53 | 2.871 | 30,04 | ||||
| 2025-11-13 | 13F | Vise Technologies, Inc. | 0 | -100,00 | 0 | |||||
| 2026-02-17 | 13F | SageView Advisory Group, LLC | 462 | 14 | ||||||
| 2026-02-17 | 13F | Quantinno Capital Management LP | 24.536 | 135,13 | 746 | 129,23 | ||||
| 2026-02-02 | 13F | Benjamin Edwards Inc | 11.323 | -2,90 | 344 | -5,23 |