Grundlæggende statistik
| Institutionelle ejere | 279 total, 279 long only, 0 short only, 0 long/short - change of 5,68% MRQ |
| Gennemsnitlig porteføljeallokering | 0.3972 % - change of -1,31% MRQ |
| Institutionelle aktier (lange) | 21.488.384 (ex 13D/G) - change of 2,43MM shares 12,73% MRQ |
| Institutionel værdi (lang) | $ 1.456.506 USD ($1000) |
Institutionelt ejerskab og aktionærer
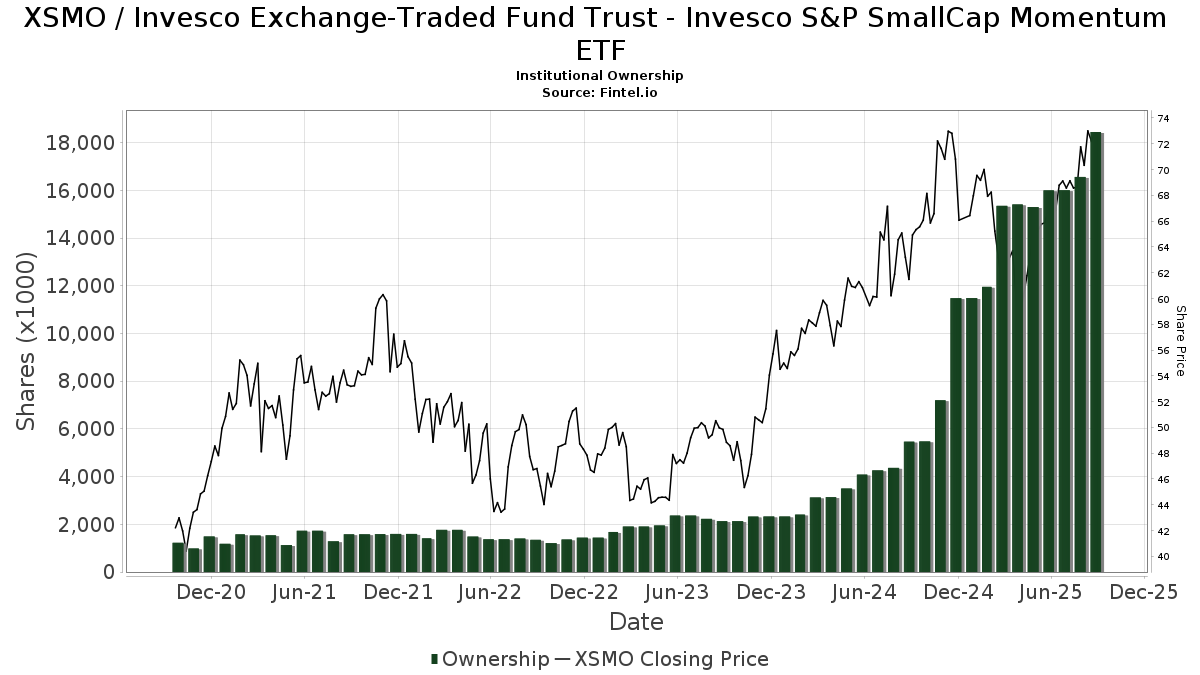
Invesco Exchange-Traded Fund Trust - Invesco S&P SmallCap Momentum ETF (US:XSMO) har 279 institutionelle ejere og aktionærer, der har indsendt 13D/G- eller 13F-formularer til Securities Exchange Commission (SEC). Disse institutioner har i alt 21,488,384 aktier. Største aktionærer omfatter LPL Financial LLC, Advisor Group Holdings, Inc., Envestnet Asset Management Inc, Raymond James Financial Inc, Morgan Stanley, Wells Fargo & Company/mn, Cetera Investment Advisers, Northwestern Mutual Wealth Management Co, Gratus Wealth Advisors, LLC, and Wealth Enhancement Advisory Services, Llc .
Invesco Exchange-Traded Fund Trust - Invesco S&P SmallCap Momentum ETF (ARCA:XSMO) institutionel ejerskabsstruktur viser aktuelle positioner i virksomheden efter institutioner og fonde, samt seneste ændringer i positionsstørrelse. Større aktionærer kan omfatte individuelle investorer, investeringsforeninger, hedgefonde eller institutioner. Skema 13D angiver, at investoren besidder (eller besidder) mere end 5 % af virksomheden og har til hensigt (eller har til hensigt at) aktivt at forfølge en ændring i forretningsstrategi. Skema 13G indikerer en passiv investering på over 5%.
The share price as of March 20, 2026 is 73,73 / share. Previously, on March 21, 2025, the share price was 61,94 / share. This represents an increase of 19,03% over that period.
Fondens stemningsscore
Fund Sentiment Score (fka Ownership Accumulation Score) finder de aktier, der bliver mest købt af fonde. Det er resultatet af en sofistikeret, multi-faktor kvantitativ model, der identificerer virksomheder med de højeste niveauer af institutionel akkumulering. Scoringsmodellen bruger en kombination af den samlede stigning i oplyste ejere, ændringerne i porteføljeallokeringer i disse ejere og andre målinger. Tallet går fra 0 til 100, hvor højere tal indikerer et højere niveau af akkumulering for sine jævnaldrende, og 50 er gennemsnittet.
Opdateringsfrekvens: Dagligt
Se Ownership Explorer, som giver en liste over højest rangerende virksomheder.
AI+ Ask Fintel’s AI assistant about Invesco Exchange-Traded Fund Trust - Invesco S&P SmallCap Momentum ETF.
Select a question to share a public post with an AI-crafted answer.
Thinking of good questions…
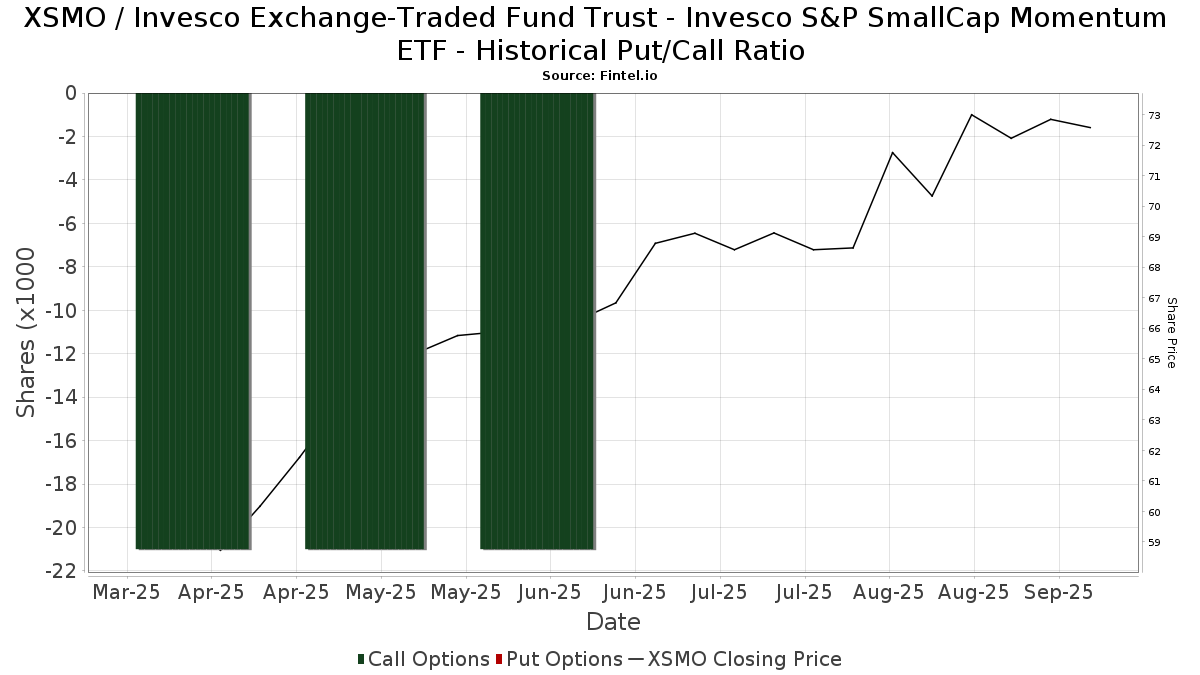
Institutionel Put/Call-forhold
Ud over at indberette standardaktie- og gældsudstedelser skal institutter med mere end 100 mill. aktiver under forvaltning også oplyse deres put- og call-optionsbeholdninger. Da salgsoptioner generelt indikerer negativ stemning, og købsoptioner indikerer positiv stemning, kan vi få en fornemmelse af den overordnede institutionelle stemning ved at plotte forholdet mellem put og kald. Diagrammet til højre viser det historiske put/call-forhold for dette instrument.
Brug af Put/Call Ratio som en indikator for investorernes stemning overvinder en af de vigtigste mangler ved at bruge totalt institutionelt ejerskab, som er, at en betydelig mængde af aktiver under forvaltning investeres passivt for at spore indekser. Passivt forvaltede fonde køber typisk ikke optioner, så indikatoren for put/call-forholdet følger mere nøje følelsen af aktivt forvaltede fonde.
13F og NPORT arkivering
Detaljer om 13F-arkivering er gratis. Detaljer om NP-ansøgninger kræver et premium-medlemskab. Grønne rækker angiver nye positioner. Røde rækker angiver lukkede positioner. Klik på linket ikon for at se den fulde transaktionshistorik.
Opgrader
for at låse premium-data op og eksportere til Excel ![]() .
.
| Fil dato | Kilde | Investor | Type | Gennemsnitlig pris (Øst) |
Aktier | Δ Aktier (%) |
Rapporteret Værdi ($1000) |
Δ Værdi (%) |
Port Alloc (%) |
|
|---|---|---|---|---|---|---|---|---|---|---|
| 2026-02-04 | 13F | Colonial River Wealth Management, LLC | 9.965 | 2,05 | 718 | -0,14 | ||||
| 2026-02-17 | 13F | Edmond De Rothschild Holding S.a. | 0 | -100,00 | 0 | |||||
| 2026-01-14 | 13F | Redhawk Wealth Advisors, Inc. | 62.759 | 79,60 | 4.519 | 75,84 | ||||
| 2026-02-19 | 13F | CI Private Wealth, LLC | 2.801 | 0,00 | 202 | -2,43 | ||||
| 2026-02-13 | 13F | Morgan Stanley | 942.702 | 23,71 | 67.884 | 21,09 | ||||
| 2026-02-12 | 13F | Peterson Wealth Services | 8.268 | 501,31 | 595 | 18,29 | ||||
| 2026-02-17 | 13F | Equitable Holdings, Inc. | 17.999 | -66,75 | 1.296 | -67,45 | ||||
| 2026-02-13 | 13F | Perspective Wealth Advisors Llc | 25.404 | 1.829 | ||||||
| 2026-02-12 | 13F | Custom Index Systems, Llc | 12.283 | -38,19 | 884 | -39,53 | ||||
| 2026-02-02 | 13F | Capital Investment Counsel, LLC | 31.182 | 2.245 | ||||||
| 2026-02-06 | 13F | Global Retirement Partners, LLC | 3.475 | -29,21 | 250 | -30,75 | ||||
| 2026-02-17 | 13F | Cape Investment Advisory, Inc. | 1.210 | 0,00 | 87 | -2,25 | ||||
| 2025-11-07 | 13F | Wealthcare Advisory Partners LLC | 0 | -100,00 | 0 | |||||
| 2026-02-17 | 13F | Advisory Services Network, LLC | 5.820 | -3,63 | 419 | -5,63 | ||||
| 2026-01-12 | 13F | Focus Financial Network, Inc. | 210.258 | 0,55 | 15.141 | -1,58 | ||||
| 2026-01-21 | 13F | Sound Income Strategies, LLC | 127.665 | 70,75 | 9.879 | 82,08 | ||||
| 2026-02-13 | 13F | Resources Investment Advisors, LLC. | 4.525 | -20,35 | 326 | -22,06 | ||||
| 2026-02-13 | 13F | Centaurus Financial, Inc. | 7.879 | -5,11 | 1 | |||||
| 2026-02-13 | 13F | Capital Square, LLC | 2.941 | 2,55 | 212 | 0,00 | ||||
| 2026-01-15 | 13F | SILVER OAK SECURITIES, Inc | 5.121 | 375 | ||||||
| 2026-02-06 | 13F | GPS Wealth Strategies Group, LLC | 21.020 | -74,59 | 1.514 | -75,14 | ||||
| 2026-01-06 | 13F | Unique Wealth, Llc | 11.341 | 0,26 | 817 | -1,92 | ||||
| 2026-02-13 | 13F | Golden State Wealth Management, LLC | 11.933 | 0,51 | 859 | -1,60 | ||||
| 2026-02-05 | 13F | Cambridge Investment Research Advisors, Inc. | 184.890 | -12,87 | 13 | -13,33 | ||||
| 2026-01-27 | 13F | Wealth Enhancement Trust Services, Inc. | 1.055 | 76 | ||||||
| 2026-02-10 | 13F | Thoroughbred Financial Services, Llc | 50.242 | 9,75 | 4 | 0,00 | ||||
| 2026-01-09 | 13F | Breakwater Capital Group | 13.688 | 6,40 | 986 | 4,12 | ||||
| 2025-11-06 | 13F | Financial Advocates Investment Management | 0 | -100,00 | 0 | |||||
| 2026-02-05 | 13F | Western Wealth Management, LLC | 13.339 | 1,77 | 961 | -0,41 | ||||
| 2026-02-10 | 13F/A | Northwestern Mutual Wealth Management Co | 581.644 | 14,64 | 41.884 | 12,21 | ||||
| 2026-02-17 | 13F | Ameriflex Group, Inc. | 135 | 206,82 | 10 | 200,00 | ||||
| 2026-02-06 | 13F | EverSource Wealth Advisors, LLC | 340 | 0,00 | 24 | 0,00 | ||||
| 2026-02-17 | 13F | Ancora Advisors, LLC | 100 | 7 | ||||||
| 2026-02-10 | 13F | Murphy & Mullick Capital Management Corp | 25 | 0,00 | 2 | 0,00 | ||||
| 2026-02-17 | 13F | Raymond James Financial Inc | 1.231.768 | -7,21 | 88.700 | -9,18 | ||||
| 2026-02-17 | 13F | Advisor Group Holdings, Inc. | 1.730.681 | 1,96 | 124.644 | 0,16 | ||||
| 2026-01-21 | 13F | Mayfair Advisory Group, LLC | 4.288 | -3,47 | 313 | -4,29 | ||||
| 2026-01-08 | 13F | Cooper Financial Group | 98.944 | -1,26 | 7.125 | -3,36 | ||||
| 2026-02-10 | 13F | TAGStone Capital, Inc. | 4.035 | 291 | ||||||
| 2026-02-02 | 13F | Benjamin Edwards Inc | 3.923 | -12,39 | 282 | -14,29 | ||||
| 2026-02-11 | 13F | O'shaughnessy Asset Management, Llc | 201 | 14 | ||||||
| 2025-11-14 | 13F | Strategic Wealth Partners, Ltd. | 0 | -100,00 | 0 | |||||
| 2026-02-17 | 13F | Aqr Capital Management Llc | 5.557 | -2,78 | 400 | -4,76 | ||||
| 2026-01-30 | 13F | Sigma Planning Corp | 18.202 | 9,80 | 1.311 | 7,47 | ||||
| 2026-02-02 | 13F | Oppenheimer & Co Inc | 27.146 | 111,29 | 1.955 | 106,77 | ||||
| 2026-02-06 | 13F | HighTower Advisors, LLC | 223.166 | 293,32 | 16.070 | 285,00 | ||||
| 2026-02-17 | 13F | Ameriprise Financial Inc | 9.639 | -10,42 | 694 | -12,26 | ||||
| 2026-02-12 | 13F | BlackRock, Inc. | 337 | 24 | ||||||
| 2025-10-21 | 13F | Optimum Investment Advisors | 0 | -100,00 | 0 | |||||
| 2026-02-17 | 13F | Jones Financial Companies Lllp | 294.252 | 20,76 | 21.191 | 18,72 | ||||
| 2026-02-09 | 13F | Claudia M.p. Batlle, Crp (r) Llc | 58.567 | 270,28 | 4.217 | 262,60 | ||||
| 2026-01-29 | 13F | Inscription Capital, LLC | 14.428 | 0,15 | 1.039 | -1,98 | ||||
| 2026-01-20 | 13F | Signaturefd, Llc | 59 | 0,00 | 4 | 0,00 | ||||
| 2026-01-26 | 13F | Whittier Trust Co | 0 | -100,00 | 0 | |||||
| 2026-02-03 | 13F | Legacy Wealth Managment, LLC/ID | 108 | 0,00 | 8 | 0,00 | ||||
| 2026-02-17 | 13F | Quantinno Capital Management LP | 6.226 | 448 | ||||||
| 2026-01-23 | 13F | Fifth Third Securities, Inc. | 14.155 | 1,29 | 1.019 | -0,88 | ||||
| 2026-01-26 | 13F | AE Wealth Management LLC | 2.048 | 4,38 | 147 | 2,08 | ||||
| 2026-02-04 | 13F | Cascade Wealth Advisors, Inc | 3.577 | 0,00 | 274 | 5,81 | ||||
| 2026-02-11 | 13F | LPL Financial LLC | 2.171.515 | 3,18 | 156.371 | 0,99 | ||||
| 2026-02-03 | 13F | NBZ Investment Advisors LLC | 174.528 | 7,70 | 12.568 | 5,41 | ||||
| 2026-02-10 | 13F | IFG Advisory, LLC | 8.184 | 589 | ||||||
| 2026-02-13 | 13F | Citigroup Inc | 55.428 | 4,85 | 3.991 | 2,62 | ||||
| 2026-01-02 | 13F | Global Wealth Strategies & Associates | 2 | 0 | ||||||
| 2026-01-23 | 13F | Aldebaran Financial Inc. | 16.939 | 34,49 | 1.242 | 34,02 | ||||
| 2026-01-21 | 13F | Sowell Financial Services LLC | 14.987 | 30,75 | 1.079 | 28,00 | ||||
| 2026-02-13 | 13F | Mariner, LLC | 190.747 | 273,63 | 13.736 | 265,78 | ||||
| 2026-02-06 | 13F | Envestnet Portfolio Solutions, Inc. | 140.636 | 3,76 | 10.127 | 1,56 | ||||
| 2026-02-09 | 13F | Kingsview Wealth Management, LLC | 106.667 | 42,81 | 7.681 | 39,81 | ||||
| 2026-02-12 | 13F | Grey Fox Wealth Advisors, LLC | 0 | -100,00 | 0 | |||||
| 2026-02-17 | 13F | MGB Wealth Management, LLC | 405 | 0,25 | 29 | 0,00 | ||||
| 2025-11-12 | 13F | Simplex Trading, Llc | 0 | -100,00 | 0 | |||||
| 2026-01-07 | 13F | Harbor Investment Advisory, Llc | 600 | 0,00 | 43 | -2,27 | ||||
| 2026-02-03 | 13F | Sequoia Financial Advisors, LLC | 145.854 | 66,94 | 10.503 | 63,40 | ||||
| 2026-02-10 | 13F | Essex Financial Services, Inc. | 2.992 | 0,07 | 215 | -1,83 | ||||
| 2026-01-28 | 13F | Provident Wealth Management, LLC | 103.143 | 2,27 | 7.427 | 0,11 | ||||
| 2026-02-20 | 13F | Sunbelt Securities, Inc. | 98 | 0,00 | 7 | 0,00 | ||||
| 2026-01-28 | 13F | CAPROCK Group, Inc. | 3.999 | -1,33 | 288 | -2,38 | ||||
| 2026-02-17 | 13F | Royal Bank Of Canada | 108.015 | -51,44 | 7.779 | -52,47 | ||||
| 2026-01-28 | 13F | EPG Wealth Management LLC | 88.661 | 1,04 | 6.385 | -1,10 | ||||
| 2026-02-11 | 13F | Jpmorgan Chase & Co | 2.987 | 962,99 | 215 | 975,00 | ||||
| 2026-02-17 | 13F | United Capital Financial Advisers, Llc | 3.705 | 267 | ||||||
| 2026-02-03 | 13F | International Assets Investment Management, Llc | 20 | 1 | ||||||
| 2026-02-14 | 13F | Rockefeller Capital Management L.P. | 22.422 | 45.659,18 | 1.641 | 54.600,00 | ||||
| 2025-11-07 | 13F | Uniting Wealth Partners, LLC | 0 | -100,00 | 0 | -100,00 | ||||
| 2025-11-13 | 13F | Total Investment Management Inc | 0 | -100,00 | 0 | |||||
| 2026-02-10 | 13F | WCG Wealth Advisors LLC | 12.276 | 8,92 | 884 | 6,63 | ||||
| 2026-01-28 | 13F | Geneos Wealth Management Inc. | 65.099 | 4,62 | 4.688 | 2,38 | ||||
| 2026-01-28 | 13F | Investmark Advisory Group LLC | 7.580 | 3,65 | 546 | 1,30 | ||||
| 2026-01-29 | 13F | Sanctuary Advisors, LLC | 92.374 | 4,27 | 6.652 | 2,06 | ||||
| 2026-01-14 | 13F | Southland Equity Partners LLC | 11.184 | 21,57 | 805 | 19,08 | ||||
| 2026-01-23 | 13F | Armbruster Capital Management, Inc. | 199.652 | 1,69 | 14.377 | -0,46 | ||||
| 2026-02-11 | 13F | Capital Analysts, Inc. | 4.243 | 49,30 | 0 | |||||
| 2026-02-13 | 13F | Brown Advisory Inc | 4.008 | 0,00 | 289 | -2,04 | ||||
| 2026-01-23 | 13F | Farther Finance Advisors, LLC | 3.415 | -16,50 | 246 | -18,33 | ||||
| 2026-02-06 | 13F | Seros Financial, LLC | 78.173 | 3,53 | 5.629 | 1,33 | ||||
| 2026-02-17 | 13F | Cetera Investment Advisers | 810.567 | 37,62 | 58.369 | 34,70 | ||||
| 2026-02-02 | 13F | Mutual Advisors, LLC | 5.016 | 4,09 | 361 | 2,27 | ||||
| 2026-02-12 | 13F | Commonwealth Equity Services, Llc | 157.351 | -25,20 | 11.331 | 75.433,33 | ||||
| 2026-02-09 | 13F | Harbour Investments, Inc. | 8.412 | 30,42 | 606 | 27,64 | ||||
| 2026-02-12 | 13F | Hrt Financial Lp | 5.193 | 10,58 | 0 | |||||
| 2026-02-13 | 13F | Ausdal Financial Partners, Inc. | 23.482 | -0,81 | 1.691 | -2,93 | ||||
| 2026-02-17 | 13F | D. E. Shaw & Co., Inc. | 2.790 | 201 | ||||||
| 2026-01-28 | 13F | Members Wealth Llc | 14.166 | 3,40 | 1.091 | 8,24 | ||||
| 2026-02-18 | 13F | EP Wealth Advisors, Inc. | 3.468 | 0,00 | 250 | 5,96 | ||||
| 2026-01-26 | 13F | Integrated Capital Management, LLC | 105.845 | 3,67 | 7.622 | 0,82 | ||||
| 2026-01-22 | 13F | Systelligence, LLC | 0 | -100,00 | 0 | |||||
| 2026-02-13 | 13F | Blue Jean Financial Llc | 19.650 | 1.415 | ||||||
| 2026-02-09 | 13F | Marshall Investment Management, Llc | 27.266 | -4,75 | 1.963 | -6,75 | ||||
| 2026-01-06 | 13F | JBR Co Financial Management Inc | 30.210 | -23,15 | 2.175 | -24,79 | ||||
| 2026-01-13 | 13F | CoreCap Advisors, LLC | 5.014 | -0,95 | 361 | -2,96 | ||||
| 2026-01-15 | 13F | Trust Co | 19 | 1 | ||||||
| 2026-02-13 | 13F | Integrated Wealth Concepts LLC | 34.138 | -11,19 | 2.458 | -13,05 | ||||
| 2026-02-13 | 13F | Capstone Wealth Management Group, Llc | 0 | -100,00 | 0 | |||||
| 2026-02-13 | 13F | National Bank Of Canada /fi/ | 130 | 0,00 | 9 | 0,00 | ||||
| 2026-01-28 | 13F | Kingswood Wealth Advisors, Llc | 25.594 | -4,67 | 1.843 | -6,68 | ||||
| 2026-02-04 | 13F | Clark Wealth Partners | 220.810 | 0,00 | 15.901 | 0,00 | ||||
| 2026-02-13 | 13F | Mml Investors Services, Llc | 151.187 | 10,65 | 10.887 | 8,30 | ||||
| 2026-01-29 | 13F | UBS Group AG | 30.543 | 196,79 | 2.199 | 190,49 | ||||
| 2026-02-17 | 13F | Blair William & Co/il | 2.551 | 229,59 | 184 | 226,79 | ||||
| 2026-01-20 | 13F | Wealthcare Capital Management Llc | 13.191 | -5,91 | 950 | -7,95 | ||||
| 2026-01-22 | 13F | Brookwood Investment Group LLC | 17.426 | 1.255 | ||||||
| 2026-02-17 | 13F | Private Advisor Group, LLC | 100.855 | 27,98 | 7.263 | 25,27 | ||||
| 2026-01-20 | 13F | Stratos Wealth Partners, LTD. | 5.894 | -9,96 | 424 | -11,85 | ||||
| 2026-02-10 | 13F | Root Financial Partners, LLC | 93 | 7 | ||||||
| 2026-02-10 | 13F | Oxford Wealth Group, LLC | 44.857 | 3.230 | ||||||
| 2025-10-27 | 13F | Concurrent Investment Advisors, LLC | 0 | -100,00 | 0 | |||||
| 2026-02-05 | 13F | Sculati Wealth Management, LLC | 7.914 | -23,54 | 570 | -25,23 | ||||
| 2026-01-22 | 13F | Westbourne Investments, Inc. | 3.958 | 30,80 | 285 | 31,94 | ||||
| 2026-01-29 | 13F | Comerica Bank | 14.304 | -0,87 | 1.030 | -2,92 | ||||
| 2026-02-13 | 13F | Wells Fargo & Company/mn | 835.228 | 5,77 | 60.145 | 3,52 | ||||
| 2026-02-13 | 13F | Change Path, LLC | 11.324 | 3,10 | 815 | 0,87 | ||||
| 2026-02-12 | 13F | Renaissance Technologies Llc | 0 | -100,00 | 0 | |||||
| 2026-02-13 | 13F | Wilkerson Advisory Group LLC | 21 | 2 | ||||||
| 2026-01-27 | 13F | Fortis Capital Advisors, LLC | 9.987 | 719 | ||||||
| 2026-03-04 | 13F | Rehmann Capital Advisory Group | 6.389 | 70,42 | 460 | 67,27 | ||||
| 2026-02-17 | 13F | Tolleson Wealth Management, Inc. | 29.468 | 0,00 | 2.122 | -2,12 | ||||
| 2026-02-05 | 13F | High Note Wealth, LLC | 456 | 33 | ||||||
| 2026-02-17 | 13F | Modern Wealth Management, LLC | 224.997 | 16.202 | ||||||
| 2026-02-09 | 13F | Integrity Alliance, Llc. | 27.475 | -0,65 | 1.978 | -2,75 | ||||
| 2026-02-13 | 13F | Alchemi Wealth, LLC | 9.372 | 675 | ||||||
| 2026-02-13 | 13F | Wealth Alliance | 3.380 | 0,24 | 243 | -2,02 | ||||
| 2026-02-10 | 13F | New Republic Capital, LLC | 500 | 100,00 | 36 | 100,00 | ||||
| 2026-01-23 | 13F | Brown Miller Wealth Management, LLC | 31.044 | 23,04 | 2.235 | 20,42 | ||||
| 2026-02-06 | 13F | Aviance Capital Partners, LLC | 5.187 | 0,00 | 374 | -2,10 | ||||
| 2026-02-12 | 13F | Compass Capital Corp /ma/ /adv | 5.202 | 0,68 | 420 | 12,30 | ||||
| 2026-02-12 | 13F | Steward Partners Investment Advisory, Llc | 26.827 | -7,98 | 1.932 | -9,93 | ||||
| 2026-02-17 | 13F | Fmr Llc | 4.407 | 27,11 | 317 | 24,31 | ||||
| 2026-02-12 | 13F | Adviser Investments LLC | 9.270 | -4,39 | 668 | -6,45 | ||||
| 2026-02-17 | 13F | Strive Financial Group ,LLC | 56 | 4 | ||||||
| 2026-02-11 | 13F | Paragon Private Wealth Management, LLC | 32.879 | -1,65 | 2.368 | -3,74 | ||||
| 2026-02-06 | 13F | Pnc Financial Services Group, Inc. | 1.150 | -7,85 | 83 | -9,89 | ||||
| 2025-10-07 | 13F | Thurston, Springer, Miller, Herd & Titak, Inc. | 0 | -100,00 | 0 | |||||
| 2026-02-11 | 13F | J.w. Cole Advisors, Inc. | 13.636 | 16,13 | 971 | 12,40 | ||||
| 2026-02-17 | 13F | IHT Wealth Management, LLC | 12.783 | 37,02 | 920 | 34,11 | ||||
| 2026-01-12 | 13F | Kozak & Associates, Inc. | 11.773 | -6,39 | 882 | 0,80 | ||||
| 2026-02-12 | 13F | Index Technologies Group LLC | 7.464 | 537 | ||||||
| 2026-01-15 | 13F | ADG Wealth Management Group, LLC | 2.788 | 201 | ||||||
| 2026-02-17 | 13F | Warren Averett Asset Management, LLC | 14.221 | 35,26 | 1.024 | 32,47 | ||||
| 2026-02-13 | 13F | Johnson Investment Counsel Inc | 0 | -100,00 | 0 | |||||
| 2026-01-13 | 13F | Signal Advisors Wealth, LLC | 3.822 | 8,46 | 275 | 6,18 | ||||
| 2026-02-05 | 13F | Thrivent Financial For Lutherans | 236.344 | 17 | ||||||
| 2026-02-17 | 13F | Creative Planning | 3.875 | 25,73 | 279 | 23,45 | ||||
| 2026-02-05 | 13F | AlphaCore Capital LLC | 233 | 17 | ||||||
| 2026-01-20 | 13F | Trust Co Of Toledo Na /oh/ | 10.988 | 2,60 | 791 | 0,51 | ||||
| 2026-02-10 | 13F | Belvedere Trading LLC | Call | 0 | -100,00 | 0 | ||||
| 2026-01-08 | 13F | Wealth Enhancement Advisory Services, Llc | 435.326 | -1,54 | 32.279 | 0,38 | ||||
| 2026-02-05 | 13F | Bright Futures Wealth Management, LLC. | 3.634 | 0,53 | 262 | -1,51 | ||||
| 2026-01-26 | 13F | Discipline Wealth Solutions, LLC | 3.760 | 271 | ||||||
| 2026-01-14 | 13F | McMahon Financial Advisors, LLC | 65.072 | 2,35 | 4.686 | 0,17 | ||||
| 2026-01-27 | 13F | Belpointe Asset Management LLC | 9.987 | 719 | ||||||
| 2026-01-22 | 13F | Bfsg, Llc | 32 | 2 | ||||||
| 2026-01-22 | 13F | Fiduciary Alliance LLC | 64.662 | 4,23 | 4.656 | 2,02 | ||||
| 2026-02-09 | 13F | Solutions 4 Wealth, Ltd | 7.920 | -19,28 | 570 | -20,94 | ||||
| 2026-01-22 | 13F | Glass Jacobson Investment Advisors llc | 1.060 | 0,09 | 76 | -1,30 | ||||
| 2026-02-17 | 13F | Susquehanna International Group, Llp | 24.960 | 161,03 | 1.797 | 155,62 | ||||
| 2026-02-17 | 13F | Russell Investments Group, Ltd. | 3.080 | 222 | ||||||
| 2026-02-11 | 13F | Greykasell Wealth Strategies, Inc. | 4.829 | 0,06 | 348 | -2,25 | ||||
| 2025-11-04 | 13F | Guerra Advisors Inc | 1.300 | 96 | ||||||
| 2026-02-12 | 13F | Bank Of Montreal /can/ | 868 | 1.478,18 | 63 | 1.450,00 | ||||
| 2026-01-14 | 13F | Spire Wealth Management | 55 | 0,00 | 4 | -25,00 | ||||
| 2026-02-04 | 13F | Gratus Wealth Advisors, LLC | 490.887 | 0,84 | 35.349 | -1,30 | ||||
| 2026-02-12 | 13F | Betterment LLC | 16.363 | -1,68 | 1 | 0,00 | ||||
| 2026-01-26 | 13F | Cwm, Llc | 413.528 | 21,07 | 30 | 16,00 | ||||
| 2026-02-04 | 13F | Ameritas Advisory Services, LLC | 3.736 | -48,79 | 269 | -49,81 | ||||
| 2026-02-17 | 13F | Prostatis Group LLC | 76.472 | 14,95 | 5.507 | 12,51 | ||||
| 2026-02-12 | 13F | Principal Securities, Inc. | 24.839 | 0,21 | 1.789 | -1,92 | ||||
| 2026-02-17 | 13F | Citadel Advisors Llc | 10.831 | 780 | ||||||
| 2026-02-13 | 13F | Baird Financial Group, Inc. | 4.255 | -10,67 | 306 | -12,57 | ||||
| 2026-02-06 | 13F | Cullen/frost Bankers, Inc. | 1.689 | 0,12 | 122 | -2,42 | ||||
| 2026-02-12 | 13F | Brinker Capital Investments, LLC | 234.273 | 1.298,48 | 16.870 | 1.269,32 | ||||
| 2026-01-12 | 13F | Abound Wealth Management | 97 | 0,00 | 7 | -14,29 | ||||
| 2026-01-20 | 13F | Accel Wealth Management | 20.626 | -0,31 | 1.485 | -2,43 | ||||
| 2026-01-27 | 13F | PFG Advisors | 30.240 | 3,45 | 2.178 | 1,26 | ||||
| 2026-02-17 | 13F | Tower Research Capital LLC (TRC) | 0 | -100,00 | 0 | |||||
| 2026-02-13 | 13F | Stifel Financial Corp | 255.056 | 13,44 | 18.366 | 11,04 | ||||
| 2026-02-14 | 13F | New Insight Wealth Advisors | 27.896 | -0,14 | 2.009 | -2,29 | ||||
| 2026-01-20 | 13F | Sovran Advisors, LLC | 12.420 | 4,22 | 962 | 13,04 | ||||
| 2026-01-23 | 13F | Valley National Advisers Inc | 1.531 | 7,14 | 0 | |||||
| 2026-01-26 | 13F | Consolidated Portfolio Review Corp | 0 | -100,00 | 0 | |||||
| 2026-01-07 | 13F | TCP Asset Management, LLC | 2.814 | 0,00 | 203 | -2,42 | ||||
| 2026-02-17 | 13F | Snowden Capital Advisors LLC | 90.950 | 5,45 | 6.549 | 3,22 | ||||
| 2026-01-28 | 13F | Chicago Partners Investment Group LLC | 16.007 | 85,05 | 1.232 | 93,55 | ||||
| 2026-02-24 | 13F | Anderson Financial Strategies, LLC | 85.454 | 3,09 | 6.154 | 0,90 | ||||
| 2026-02-17 | 13F | VestGen Advisors, LLC | 112.601 | 117,73 | 8.108 | 113,14 | ||||
| 2026-02-05 | 13F | Intrua Financial, LLC | 3.954 | 285 | ||||||
| 2026-02-11 | 13F | Janney Montgomery Scott LLC | 261.483 | -1,37 | 19 | -5,26 | ||||
| 2026-01-27 | 13F | Institute for Wealth Management, LLC. | 20.546 | -2,56 | 1.480 | -4,64 | ||||
| 2026-02-06 | 13F | Signature Estate & Investment Advisors Llc | 4.837 | 9,53 | 348 | 7,41 | ||||
| 2026-02-04 | 13F | MONECO Advisors, LLC | 6.712 | 8,26 | 483 | 5,92 | ||||
| 2026-01-29 | 13F | ArborFi Advisors, LLC | 34.146 | -0,64 | 2.459 | -2,77 | ||||
| 2026-02-12 | 13F | Titleist Asset Management, Llc | 44.220 | 3,82 | 3.184 | 1,63 | ||||
| 2026-02-11 | 13F | Mascagni Wealth Management, Inc. | 31.183 | 10,67 | 2.245 | 8,30 | ||||
| 2026-02-13 | 13F | Colony Group, LLC | 7.343 | 28,67 | 529 | 26,01 | ||||
| 2026-01-29 | 13F | James Investment Research Inc | 14.419 | 12,37 | 1.038 | 9,96 | ||||
| 2026-02-03 | 13F | Marmo Financial Group, LLC | 55.597 | -5,76 | 4.004 | -7,76 | ||||
| 2026-02-04 | 13F | Stonebridge Financial Group, LLC / MO | 11.966 | 862 | ||||||
| 2026-01-14 | 13F | Jfs Wealth Advisors, Llc | 0 | -100,00 | 0 | |||||
| 2026-02-12 | 13F | Beacon Capital Management, Inc. | 239 | -7,36 | 17 | -5,56 | ||||
| 2026-02-10 | 13F | Calton & Associates, Inc. | 7.404 | -1,27 | 533 | -3,27 | ||||
| 2026-02-11 | 13F | Fortune Financial Group, Inc. | 9.594 | 1 | ||||||
| 2026-02-11 | 13F | Real Talk Capital, LLC | 6.822 | -10,33 | 491 | -12,16 | ||||
| 2026-01-22 | 13F | Trilogy Capital Inc. | 8.358 | 8,63 | 602 | 6,18 | ||||
| 2026-02-17 | 13F | Perennial Investment Advisors, LLC | 28.593 | 16,04 | 2.059 | 13,51 | ||||
| 2026-01-26 | 13F | Lowery Thomas, Llc | 16.165 | 2,97 | 1.164 | 0,87 | ||||
| 2026-02-02 | 13F | Truist Financial Corp | 90.900 | 0,39 | 6.546 | -1,74 | ||||
| 2026-02-05 | 13F | Cornerstone Wealth Management, LLC | 8.216 | 2,89 | 592 | 0,68 | ||||
| 2026-02-13 | 13F | Planwiser Financial, Llc | 25.404 | 1.829 | ||||||
| 2026-02-05 | 13F | Allworth Financial LP | 680 | 350,33 | 49 | 336,36 | ||||
| 2026-02-12 | 13F | StoneX Group Inc. | 0 | -100,00 | 0 | |||||
| 2026-02-13 | 13F | Jacobi Capital Management LLC | 0 | -100,00 | 0 | |||||
| 2026-02-04 | 13F | Independent Advisor Alliance | 9.871 | -2,38 | 711 | -4,44 | ||||
| 2026-02-03 | 13F | Vantage Financial Partners, LLC | 20.077 | -1,35 | 1.446 | -3,47 | ||||
| 2026-02-13 | 13F | Arkadios Wealth Advisors | 94.542 | -0,79 | 6.808 | -2,90 | ||||
| 2026-03-02 | 13F | Sankala Group LLC | 2.659 | 212 | ||||||
| 2026-01-22 | 13F | Pinnacle Bancorp, Inc. | 124 | 0,00 | 9 | -11,11 | ||||
| 2026-02-17 | 13F | Wiley Bros.-aintree Capital, Llc | 8.090 | 18,95 | 583 | 16,40 | ||||
| 2026-02-03 | 13F | Harel Insurance Investments & Financial Services Ltd. | 0 | -100,00 | 0 | |||||
| 2026-02-13 | 13F | Financial Freedom, LLC | 46.354 | 6,32 | 3.338 | 4,05 | ||||
| 2026-02-10 | 13F | Comprehensive Wealth Management, LLC | 22.630 | 11,82 | 1.630 | 9,48 | ||||
| 2026-02-04 | 13F | Pensionmark Financial Group, Llc | 5.510 | 59,62 | 248 | -2,37 | ||||
| 2026-02-11 | 13F | Cerity Partners LLC | 12.210 | 3,14 | 879 | 1,03 | ||||
| 2026-02-09 | 13F | Hartland & Co., LLC | 318 | 23 | ||||||
| 2026-01-21 | 13F | Prime Capital Investment Advisors, LLC | 48.318 | 0,82 | 3.479 | -1,30 | ||||
| 2026-01-22 | 13F | Apollon Financial, LLC | 26.609 | 20,86 | 1.916 | 18,34 | ||||
| 2026-02-05 | 13F | Atria Investments Llc | 75.409 | 3,31 | 5.430 | 1,12 | ||||
| 2026-02-13 | 13F | Kestra Advisory Services, LLC | 0 | -100,00 | 0 | |||||
| 2026-02-10 | 13F | Theory Financial Llc | 47.708 | -6,68 | 3.673 | -2,11 | ||||
| 2026-02-10 | 13F | Bnp Paribas Arbitrage, Sa | 261.000 | 272,78 | 18.795 | 264,86 | ||||
| 2026-01-05 | 13F | Noble Wealth Management PBC | 37.259 | -5,44 | 2.683 | -7,42 | ||||
| 2026-02-10 | 13F | Argent Trust Co | 16.282 | 1.172 | ||||||
| 2026-02-10 | 13F | Envestnet Asset Management Inc | 1.630.790 | 0,82 | 117.433 | -1,31 | ||||
| 2026-02-17 | 13F | Signature Equity Partners, LLC | 11.402 | 821 | ||||||
| 2026-02-18 | 13F | Garton & Associates Financial Advisors LLC | 100 | 7 | ||||||
| 2026-02-13 | 13F | OpenArc Corporate Advisory, LLC | 5.343 | 385 | ||||||
| 2026-02-06 | 13F | New Millennium Group LLC | 32.135 | -2,13 | 2.314 | -4,18 | ||||
| 2026-01-26 | 13F | Merit Financial Group, LLC | 26.507 | -2,60 | 1.909 | -4,70 | ||||
| 2026-02-04 | 13F | D'Orazio & Associates, Inc. | 3.835 | 8,79 | 276 | 6,56 | ||||
| 2026-01-26 | 13F | Harbor Asset Planning, Inc. | 592 | 0,17 | 43 | -2,33 | ||||
| 2026-02-03 | 13F | Providence First Trust Co | 26.402 | 22,90 | 1.901 | 20,32 | ||||
| 2026-02-13 | 13F | Greenline Wealth Management LLC | 22.420 | 1.614 | ||||||
| 2025-11-14 | 13F/A | NorthRock Partners, LLC | 0 | -100,00 | 0 | |||||
| 2026-01-23 | 13F | Clear Creek Financial Management, LLC | 4.788 | -0,23 | 345 | -2,55 | ||||
| 2026-02-10 | 13F | Hazlett, Burt & Watson, Inc. | 535 | 0,00 | 0 | |||||
| 2026-02-17 | 13F | Qube Research & Technologies Ltd | 7 | -99,97 | 1 | -100,00 | ||||
| 2026-02-13 | 13F | River Wealth Advisors LLC | 356.629 | 5,83 | 25.681 | 3,58 | ||||
| 2025-11-17 | 13F | Sterling Financial Group, Inc. | 62.384 | 1.515,33 | 4.590 | 1.651,53 | ||||
| 2026-01-30 | 13F | Us Bancorp \de\ | 2.428 | -1,22 | 175 | -3,33 | ||||
| 2026-02-10 | 13F | SFI Advisors, LLC | 25.798 | -3,22 | 1.858 | -5,30 | ||||
| 2026-01-12 | 13F | Salem Investment Counselors Inc | 0 | -100,00 | 0 | |||||
| 2026-02-03 | 13F | RFG Advisory, LLC | 93.217 | 17,75 | 6.713 | 15,25 | ||||
| 2026-02-04 | 13F | Anson Capital, Inc. | 16.593 | -4,51 | 1.195 | -6,57 | ||||
| 2026-01-28 | 13F | Hoey Investments, Inc | 0 | -100,00 | 0 | |||||
| 2026-01-30 | 13F | Archer Investment Corp | 274 | 0,00 | 20 | -5,00 | ||||
| 2026-01-09 | 13F | Silverlake Wealth Management Llc | 4.389 | 0,00 | 316 | -1,86 | ||||
| 2026-02-13 | 13F | Maia Wealth LLC | 10.316 | -54,14 | 815 | -50,00 | ||||
| 2026-02-13 | 13F | Parkside Financial Bank & Trust | 608 | 0,16 | 44 | -2,27 | ||||
| 2026-02-04 | 13F | Meridian Wealth Management, LLC | 164.108 | 26,76 | 11.817 | 24,08 | ||||
| 2026-02-06 | 13F | Axxcess Wealth Management, Llc | 10.527 | 7,80 | 758 | 5,57 | ||||
| 2026-02-06 | 13F | IFP Advisors, Inc | 10.593 | 10,29 | 763 | 7,93 | ||||
| 2026-02-05 | 13F | USAdvisors Wealth Management, LLC | 104.860 | 7,56 | 8 | 0,00 | ||||
| 2026-02-12 | 13F | Great Valley Advisor Group, Inc. | 108.777 | -15,54 | 7.833 | -17,34 | ||||
| 2026-01-14 | 13F | Nova Wealth Management, Inc. | 42.885 | 22,06 | 3.088 | 19,50 | ||||
| 2026-01-23 | 13F | Assetmark, Inc | 1.350 | 3,13 | 97 | 1,04 | ||||
| 2026-01-23 | 13F | Optima Capital Llc | 989 | -97,24 | 71 | -97,31 | ||||
| 2026-02-13 | 13F | Y-Intercept (Hong Kong) Ltd | 0 | -100,00 | 0 | |||||
| 2026-02-12 | 13F | Ullmann Financial Group, Inc. | 3.110 | 0,00 | 223 | -2,63 | ||||
| 2026-02-18 | 13F | GWM Advisors LLC | 82.844 | -8,35 | 5.966 | -10,30 | ||||
| 2026-01-20 | 13F | FLP Wealth Management, LLC | 2.160 | -58,94 | 359 | -7,25 | ||||
| 2026-01-27 | 13F | Godsey & Gibb Associates | 126 | -83,64 | 9 | -83,93 | ||||
| 2026-02-10 | 13F | Core Wealth Advisors, Llc | 220.810 | 15.901 | ||||||
| 2026-02-03 | 13F | We Are One Seven, LLC | 12.711 | 2,12 | 915 | 0,00 | ||||
| 2026-01-09 | 13F | Dynamic Advisor Solutions LLC | 20.534 | 187,35 | 1.479 | 181,52 | ||||
| 2026-01-16 | 13F | Kendall Capital Management | 17.000 | 0,00 | 1.224 | -2,08 | ||||
| 2026-01-15 | 13F | Lodestone Wealth Management LLC | 21.778 | -2,45 | 1.568 | -4,51 | ||||
| 2026-02-17 | 13F | Bank Of America Corp /de/ | 405.738 | -8,58 | 29.217 | -10,52 | ||||
| 2026-02-26 | 13F | Anchor Investment Management, LLC | 0 | -100,00 | 0 | |||||
| 2025-11-13 | 13F | Advisor Resource Council | 0 | -100,00 | 0 | |||||
| 2026-01-07 | 13F | TruWealth Advisors, LLC | 3.136 | 0,03 | 226 | -2,17 | ||||
| 2026-02-03 | 13F | McIlrath & Eck, LLC | 0 | -100,00 | 0 | |||||
| 2026-01-22 | 13F | Apollon Wealth Management, LLC | 384.931 | 1,64 | 27.719 | -0,52 | ||||
| 2026-02-10 | 13F | 360 Financial, Inc. | 2.046 | 0,00 | 215 | 0,00 | ||||
| 2026-02-13 | 13F | MAI Capital Management | 9.658 | 695 | ||||||
| 2026-01-26 | 13F | Oxinas Partners Wealth Management LLC | 15.581 | 5,74 | 1.122 | 3,41 | ||||
| 2026-02-05 | 13F | Stephens Inc /ar/ | 6.874 | 0,00 | 495 | -2,18 | ||||
| 2026-02-11 | 13F | Comprehensive Financial Planning, Inc./PA | 1.686 | 151,27 | 121 | 146,94 | ||||
| 2026-01-26 | 13F | Private Trust Co Na | 1.216 | -29,79 | 88 | -31,50 | ||||
| 2026-02-18 | 13F | Financial Advisory Service, Inc. | 45 | 3 | ||||||
| 2026-02-11 | 13F | Vise Technologies, Inc. | 18.840 | 37,86 | 1.357 | 34,93 | ||||
| 2026-02-18 | 13F | Beacon Pointe Advisors, LLC | 34.824 | 22,12 | 2.508 | 19,55 |