Grundlæggende statistik
| Institutionelle aktier (lange) | 45.585.277 - 1.263,54% (ex 13D/G) - change of -0,04MM shares -0,08% MRQ |
| Institutionel værdi (lang) | $ 1.105.607 USD ($1000) |
Institutionelt ejerskab og aktionærer
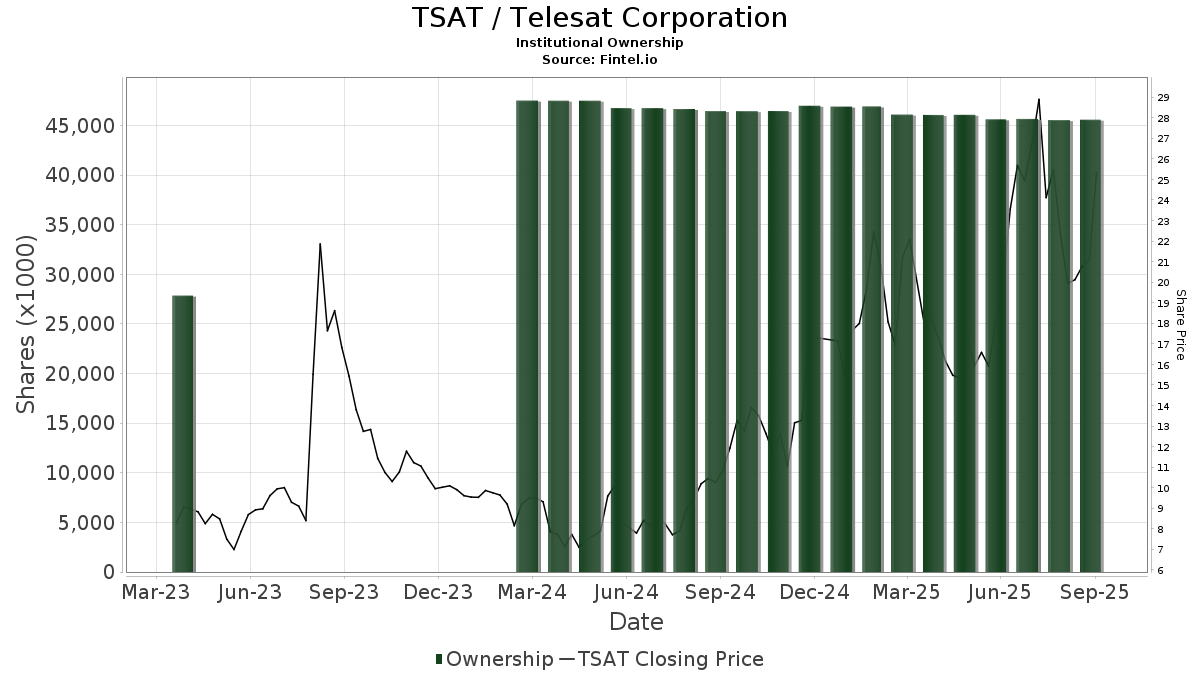
Telesat Corporation (US:TSAT) har 89 institutionelle ejere og aktionærer, der har indsendt 13D/G- eller 13F-formularer til Securities Exchange Commission (SEC). Disse institutioner har i alt 45,585,665 aktier. Største aktionærer omfatter Public Sector Pension Investment Board, Mhr Fund Management Llc, Gamco Investors, Inc. Et Al, Heard Capital LLC, Rubric Capital Management LP, Gabelli Funds Llc, EQ ADVISORS TRUST - 1290 VT GAMCO Small Company Value Portfolio Class IB, Highland Capital Management Fund Advisors, L.p., LM Asset (IM) Inc., and Highland Global Allocation Fund .
Telesat Corporation (NasdaqGS:TSAT) institutionel ejerskabsstruktur viser aktuelle positioner i virksomheden efter institutioner og fonde, samt seneste ændringer i positionsstørrelse. Større aktionærer kan omfatte individuelle investorer, investeringsforeninger, hedgefonde eller institutioner. Skema 13D angiver, at investoren besidder (eller besidder) mere end 5 % af virksomheden og har til hensigt (eller har til hensigt at) aktivt at forfølge en ændring i forretningsstrategi. Skema 13G indikerer en passiv investering på over 5%.
The share price as of September 5, 2025 is 23,10 / share. Previously, on September 9, 2024, the share price was 10,36 / share. This represents an increase of 122,97% over that period.
Fondens stemningsscore
Fund Sentiment Score (fka Ownership Accumulation Score) finder de aktier, der bliver mest købt af fonde. Det er resultatet af en sofistikeret, multi-faktor kvantitativ model, der identificerer virksomheder med de højeste niveauer af institutionel akkumulering. Scoringsmodellen bruger en kombination af den samlede stigning i oplyste ejere, ændringerne i porteføljeallokeringer i disse ejere og andre målinger. Tallet går fra 0 til 100, hvor højere tal indikerer et højere niveau af akkumulering for sine jævnaldrende, og 50 er gennemsnittet.
Opdateringsfrekvens: Dagligt
Se Ownership Explorer, som giver en liste over højest rangerende virksomheder.
Institutionel Put/Call-forhold
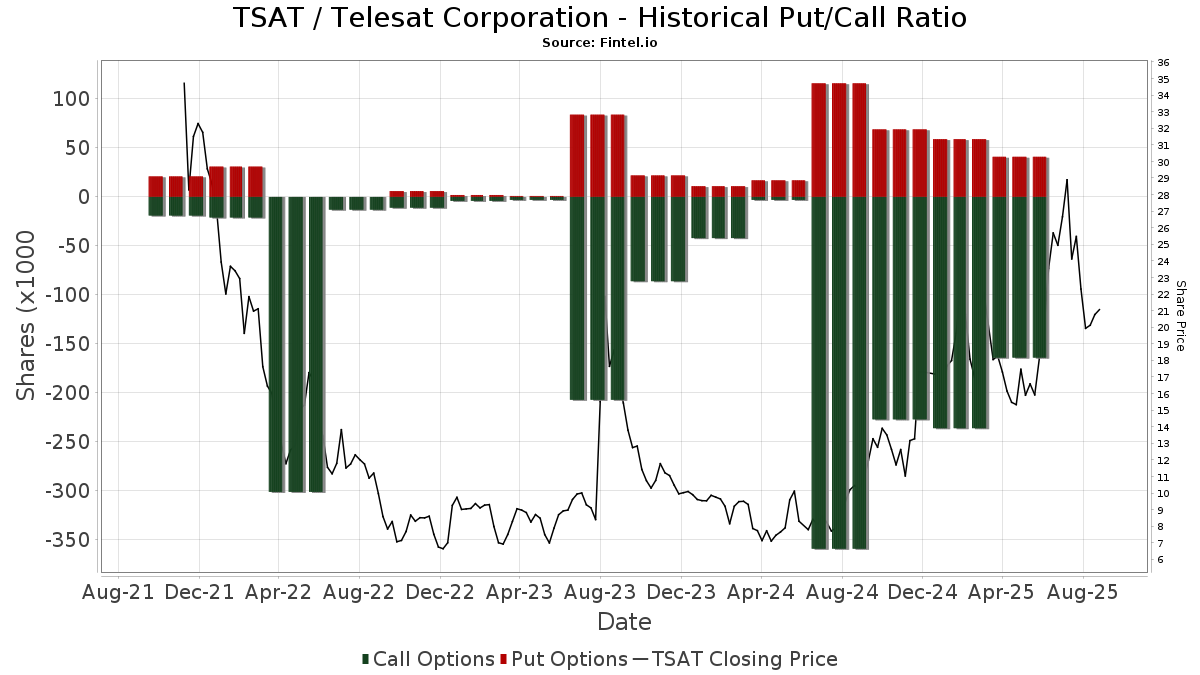
Ud over at indberette standardaktie- og gældsudstedelser skal institutter med mere end 100 mill. aktiver under forvaltning også oplyse deres put- og call-optionsbeholdninger. Da salgsoptioner generelt indikerer negativ stemning, og købsoptioner indikerer positiv stemning, kan vi få en fornemmelse af den overordnede institutionelle stemning ved at plotte forholdet mellem put og kald. Diagrammet til højre viser det historiske put/call-forhold for dette instrument.
Brug af Put/Call Ratio som en indikator for investorernes stemning overvinder en af de vigtigste mangler ved at bruge totalt institutionelt ejerskab, som er, at en betydelig mængde af aktiver under forvaltning investeres passivt for at spore indekser. Passivt forvaltede fonde køber typisk ikke optioner, så indikatoren for put/call-forholdet følger mere nøje følelsen af aktivt forvaltede fonde.
13D/G-arkivering
Vi præsenterer 13D/G ansøgninger separat fra 13F ansøgninger på grund af den forskellige behandling af SEC. 13D/G-ansøgninger kan indgives af grupper af investorer (med én ledende), hvorimod 13F-ansøgninger ikke kan. Dette resulterer i situationer, hvor en investor kan indsende en 13D/G, der rapporterer én værdi for de samlede aktier (der repræsenterer alle de aktier, der ejes af investorgruppen), men derefter indsender en 13F, der rapporterer en anden værdi for de samlede aktier (der udelukkende repræsenterer deres egne) ejendomsret). Det betyder, at aktieejerskab af 13D/G-arkiver og 13F-arkiveringer ofte ikke er direkte sammenlignelige, så vi præsenterer dem separat.
Bemærk: Fra den 16. maj 2021 viser vi ikke længere ejere, der ikke har indsendt en 13D/G inden for det seneste år. Tidligere viste vi den fulde historie af 13D/G-arkiver. Generelt skal enheder, der er forpligtet til at indgive 13D/G-ansøgninger, indgive mindst årligt, før de indsender en afsluttende ansøgning. Dog forlader fonde nogle gange positioner uden at indsende en afsluttende ansøgning (dvs. de afvikler), så visning af den fulde historie resulterede nogle gange i forvirring om det nuværende ejerskab. For at undgå forvirring viser vi nu kun 'aktuelle' ejere - det vil sige - ejere, der har anmeldt inden for det seneste år.
Upgrade to unlock premium data.
| Fil dato | Form | Investor | Forrige Aktier |
Seneste Aktier |
Δ Aktier (Procent) |
Ejendomsret (Procent) |
Δ Ejerskab (Procent) |
|
|---|---|---|---|---|---|---|---|---|
| 2025-08-14 | Heard Capital LLC | 1,646,695 | 1,519,410 | -7.73 | 10.40 | -9.57 | ||
| 2025-06-03 | GAMCO INVESTORS, INC. ET AL | 1,812,488 | 1,802,244 | -0.57 | 12.30 | -5.38 | ||
| 2025-05-15 | Lau Daniel | 897,000 | 622,350 | -30.62 | 4.30 | -34.85 | ||
| 2025-02-12 | Greywolf Capital Management LP | 699,825 | 860,551 | 22.97 | 6.20 | 24.00 |
13F og NPORT arkivering
Detaljer om 13F-arkivering er gratis. Detaljer om NP-ansøgninger kræver et premium-medlemskab. Grønne rækker angiver nye positioner. Røde rækker angiver lukkede positioner. Klik på linket ikon for at se den fulde transaktionshistorik.
Opgrader
for at låse premium-data op og eksportere til Excel ![]() .
.
| Fil dato | Kilde | Investor | Type | Gennemsnitlig pris (Øst) |
Aktier | Δ Aktier (%) |
Rapporteret Værdi ($1000) |
Δ Værdi (%) |
Port Alloc (%) |
|
|---|---|---|---|---|---|---|---|---|---|---|
| 2025-08-08 | 13F | SBI Securities Co., Ltd. | 54 | 10,20 | 1 | |||||
| 2025-08-14 | 13F | LM Asset (IM) Inc. | 466.450 | -12,23 | 11.320 | 14,26 | ||||
| 2025-07-29 | NP | Guggenheim Active Allocation Fund | 41 | 0,00 | 1 | |||||
| 2025-08-14 | 13F | Bank Of America Corp /de/ | 56.401 | 264,30 | 1.378 | 373,54 | ||||
| 2025-08-29 | NP | Highland Floating Rate Opportunities Fund | 152.894 | -21,31 | 3.737 | 2,13 | ||||
| 2025-08-26 | NP | EQ ADVISORS TRUST - 1290 VT GAMCO Small Company Value Portfolio Class IB | 677.500 | 0,00 | 16.558 | 29,80 | ||||
| 2025-08-13 | 13F | 1832 Asset Management L.P. | 0 | -100,00 | 0 | |||||
| 2025-08-14 | 13F | Heard Capital LLC | 1.517.710 | -7,83 | 37.093 | 19,62 | ||||
| 2025-08-07 | 13F | Acadian Asset Management Llc | 342 | -94,64 | 0 | |||||
| 2025-08-28 | NP | BlackRock Funds V - BlackRock High Yield Bond Portfolio Service Shares | Short | -388 | -0,00 | -9 | 28,57 | |||
| 2025-06-25 | NP | AIOAX - Columbia Income Opportunities Fund Class A | 101 | 0,00 | 2 | 0,00 | ||||
| 2025-08-29 | NP | Gabelli Equity Trust Inc | 33.000 | 0,00 | 807 | 29,79 | ||||
| 2025-08-12 | 13F | Pathstone Holdings, LLC | 23.985 | 0,00 | 586 | 29,93 | ||||
| 2025-08-14 | 13F | Millennium Management Llc | 44.390 | 153,82 | 1.085 | 229,48 | ||||
| 2025-07-02 | 13F | Central Pacific Bank - Trust Division | 4.486 | 0,00 | 110 | 29,76 | ||||
| 2025-07-22 | 13F | IMC-Chicago, LLC | 10.307 | 252 | ||||||
| 2025-08-14 | 13F | Mhr Fund Management Llc | 18.035.092 | 0,00 | 440.778 | 29,79 | ||||
| 2025-07-30 | 13F | FNY Investment Advisers, LLC | Call | 8 | 0 | |||||
| 2025-09-04 | 13F/A | Advisor Group Holdings, Inc. | 525 | -19,23 | 13 | 0,00 | ||||
| 2025-08-11 | 13F | Platform Technology Partners | 15.444 | -1,62 | 377 | 27,80 | ||||
| 2025-08-29 | NP | GTCAX - Gabelli Global Content & Connectivity Fund Class A | 32.000 | 0,00 | 782 | 29,90 | ||||
| 2025-06-26 | NP | DFAX - Dimensional World ex U.S. Core Equity 2 ETF | 1.400 | 22 | ||||||
| 2025-08-14 | 13F | Susquehanna International Group, Llp | 21.390 | 523 | ||||||
| 2025-08-29 | NP | GCASX - The Gabelli Small Cap Growth Fund Class A | 141.500 | 0,00 | 3.458 | 29,80 | ||||
| 2025-08-14 | 13F | Susquehanna International Group, Llp | Call | 27.700 | 13,06 | 677 | 46,64 | |||
| 2025-08-29 | NP | Gabelli Global Utility & Income Trust | 46.000 | 0,00 | 1.124 | 29,79 | ||||
| 2025-06-26 | NP | DFIC - Dimensional International Core Equity 2 ETF | 1.900 | 30 | ||||||
| 2025-08-14 | 13F | Susquehanna International Group, Llp | Put | 16.200 | -28,32 | 396 | -7,06 | |||
| 2025-08-12 | 13F | Trexquant Investment LP | 0 | -100,00 | 0 | |||||
| 2025-07-16 | 13F | Dakota Wealth Management | 0 | -100,00 | 0 | |||||
| 2025-08-14 | 13F | Bnp Paribas Arbitrage, Sa | 266 | 2,70 | 7 | 50,00 | ||||
| 2025-07-17 | 13F | Beacon Capital Management, LLC | 95 | 0,00 | 2 | 100,00 | ||||
| 2025-08-14 | 13F | PenderFund Capital Management Ltd. | 100.600 | 2.448 | ||||||
| 2025-08-05 | 13F | K.J. Harrison & Partners Inc | 25.400 | 0,00 | 617 | 29,96 | ||||
| 2025-08-14 | 13F | Banque Transatlantique SA | 0 | -100,00 | 0 | |||||
| 2025-07-31 | 13F | Asset Management One Co., Ltd. | 7.723 | 1,31 | 189 | 31,47 | ||||
| 2025-08-12 | 13F | Steward Partners Investment Advisory, Llc | 45 | 0,00 | 1 | |||||
| 2025-08-18 | 13F | Wolverine Trading, Llc | Call | 15.600 | 8,33 | 375 | 36,86 | |||
| 2025-08-18 | 13F | Wolverine Trading, Llc | Put | 9.300 | -38,41 | 224 | -22,57 | |||
| 2025-08-01 | 13F | Belvedere Trading LLC | 0 | -100,00 | 0 | |||||
| 2025-08-01 | 13F | Belvedere Trading LLC | Call | 0 | -100,00 | 0 | ||||
| 2025-08-01 | 13F | Belvedere Trading LLC | Put | 0 | -100,00 | 0 | ||||
| 2025-08-14 | 13F | Rubric Capital Management LP | 843.781 | -1,83 | 20.622 | 27,42 | ||||
| 2025-08-29 | NP | GATAX - The Gabelli Asset Fund Class A | 39.900 | 0,00 | 975 | 29,83 | ||||
| 2025-08-29 | NP | EMAAX - Enterprise Mergers and Acquisitions Fund Class A | 30.500 | 0,00 | 745 | 29,79 | ||||
| 2025-08-15 | 13F | Morgan Stanley | 37.456 | 198,19 | 915 | 287,71 | ||||
| 2025-08-14 | 13F | Militia Capital Partners, LP | 33.475 | -13,45 | 818 | 12,36 | ||||
| 2025-08-11 | 13F | Waratah Capital Advisors Ltd. | 0 | -100,00 | 0 | |||||
| 2025-07-11 | 13F | Farther Finance Advisors, LLC | 9 | 0,00 | 0 | |||||
| 2025-08-08 | 13F | Vestcor Inc | 125.000 | 0,00 | 3 | 50,00 | ||||
| 2025-08-14 | 13F | Peapack Gladstone Financial Corp | 13.885 | 0,00 | 0 | |||||
| 2025-08-29 | NP | Gabelli Dividend & Income Trust | 63.000 | 0,00 | 1.540 | 29,76 | ||||
| 2025-08-14 | 13F | Federation des caisses Desjardins du Quebec | 30.608 | -32,22 | 718 | -13,20 | ||||
| 2025-08-13 | 13F | Marshall Wace, Llp | 0 | -100,00 | 0 | |||||
| 2025-08-14 | 13F | Royal Bank Of Canada | 1.047 | 391,55 | 25 | 525,00 | ||||
| 2025-08-18 | 13F | Wolverine Trading, Llc | 0 | -100,00 | 0 | -100,00 | ||||
| 2025-08-14 | 13F | Citadel Advisors Llc | Put | 15.500 | 6,16 | 379 | 37,96 | |||
| 2025-08-14 | 13F | Citadel Advisors Llc | Call | 50.200 | -49,09 | 1.227 | -33,94 | |||
| 2025-08-14 | 13F | Highland Capital Management Fund Advisors, L.p. | 534.306 | -9,58 | 13.058 | 17,35 | ||||
| 2025-08-14 | 13F/A | Barclays Plc | 25 | 0,00 | 0 | |||||
| 2025-08-29 | NP | Highland Global Allocation Fund | 189.945 | 0,00 | 4.642 | 29,81 | ||||
| 2025-08-29 | NP | Gabelli Multimedia Trust Inc. | 120.500 | 2,12 | 2.945 | 32,60 | ||||
| 2025-08-14 | 13F/A | Barclays Plc | Call | 57.900 | 0,00 | 1 | 0,00 | |||
| 2025-08-12 | 13F | Proequities, Inc. | 0 | 0 | ||||||
| 2025-08-13 | 13F | GABELLI & Co INVESTMENT ADVISERS, INC. | 79.161 | 6,89 | 1.935 | 38,74 | ||||
| 2025-08-14 | 13F | Caption Management, LLC | 113.604 | -18,06 | 2.776 | 6,36 | ||||
| 2025-05-15 | 13F | Caption Management, LLC | Call | 0 | -100,00 | 0 | -100,00 | |||
| 2025-08-13 | 13F | Walleye Capital LLC | 74.208 | 1.814 | ||||||
| 2025-08-12 | 13F | Jpmorgan Chase & Co | 5.504 | -43,22 | 135 | -26,37 | ||||
| 2025-08-29 | NP | Gabelli Utility Trust | 30.000 | 0,00 | 733 | 29,96 | ||||
| 2025-08-14 | 13F | Group One Trading, L.p. | 63.866 | 11,61 | 1.561 | 44,85 | ||||
| 2025-08-06 | 13F | Penserra Capital Management LLC | 28.715 | 1 | ||||||
| 2025-07-28 | 13F | BRYN MAWR TRUST Co | 500 | 0,00 | 12 | 33,33 | ||||
| 2025-08-29 | NP | GAUAX - The Gabelli Utilities Fund Class A | 100.000 | 0,00 | 2.444 | 29,79 | ||||
| 2025-05-15 | 13F | Squarepoint Ops LLC | 0 | -100,00 | 0 | |||||
| 2025-08-13 | 13F | Jump Financial, LLC | 18.370 | 449 | ||||||
| 2025-08-29 | NP | Gabelli Global Small & Mid Cap Value Trust | 10.000 | 0,00 | 244 | 29,79 | ||||
| 2025-06-27 | NP | PASIX - PACE Alternative Strategies Investments Class A | 5.360 | 17,80 | 84 | -1,19 | ||||
| 2025-08-14 | 13F | Aristeia Capital Llc | 0 | -100,00 | 0 | |||||
| 2025-06-26 | NP | DFIS - Dimensional International Small Cap ETF | 2.400 | 37 | ||||||
| 2025-08-14 | 13F | PDT Partners, LLC | 10.709 | 0,90 | 262 | 31,16 | ||||
| 2025-07-30 | 13F | Whittier Trust Co | 165 | 0,00 | 4 | 33,33 | ||||
| 2025-08-22 | NP | Columbia Funds Variable Series Trust II - Columbia Variable Portfolio - Income Opportunities Fund Class 3 | 6 | 0,00 | 0 | |||||
| 2025-08-14 | 13F | Wells Fargo & Company/mn | 10 | 0,00 | 0 | |||||
| 2025-07-09 | 13F | Northwest & Ethical Investments L.P. | 0 | -100,00 | 0 | -100,00 | ||||
| 2025-08-12 | 13F | Public Sector Pension Investment Board | 18.211.203 | 0,00 | 442.301 | 30,29 | ||||
| 2025-08-26 | NP | EQ ADVISORS TRUST - 1290 VT GAMCO Mergers & Acquisitions Portfolio Class IB | 118.000 | -4,99 | 2.884 | 23,31 | ||||
| 2025-08-13 | 13F | Renaissance Technologies Llc | 68.500 | 443,65 | 1.674 | 606,33 | ||||
| 2025-08-14 | 13F | Raymond James Financial Inc | 681 | 17 | ||||||
| 2025-08-14 | 13F | Polar Asset Management Partners Inc. | 57.500 | 1.405 | ||||||
| 2025-08-05 | 13F | Simplex Trading, Llc | 9.857 | -71,16 | 0 | |||||
| 2025-07-24 | 13F | IFP Advisors, Inc | 500 | 12 | ||||||
| 2025-08-14 | 13F | Jane Street Group, Llc | Call | 12.700 | -68,41 | 310 | -58,99 | |||
| 2025-08-14 | 13F | Jane Street Group, Llc | 85.884 | 2.099 | ||||||
| 2025-08-07 | 13F | Connor, Clark & Lunn Investment Management Ltd. | 88.038 | 35,33 | 2.152 | 75,74 | ||||
| 2025-06-24 | NP | TNVAX - 1290 GAMCO Small/Mid Cap Value Fund Class A | 114.000 | 0,00 | 1.764 | -16,09 | ||||
| 2025-08-29 | NP | GCAEX - The Gabelli Equity Income Fund Class A | 22.000 | 0,00 | 538 | 29,71 | ||||
| 2025-08-13 | 13F | Gamco Investors, Inc. Et Al | 1.859.965 | -1,10 | 45.458 | 28,36 | ||||
| 2025-08-13 | 13F | Gabelli Funds Llc | 725.129 | -0,23 | 17.722 | 29,49 | ||||
| 2025-07-31 | 13F | Glass Jacobson Investment Advisors llc | 0 | -100,00 | 0 | |||||
| 2025-08-11 | 13F | TD Waterhouse Canada Inc. | 10.000 | 248 | ||||||
| 2025-08-14 | 13F | Citadel Advisors Llc | 11.575 | 283 | ||||||
| 2025-06-26 | NP | Dfa Investment Dimensions Group Inc - Va International Small Portfolio This fund is a listed as child fund of Dimensional Fund Advisors Lp and if that institution has disclosed ownership in this security, then these positions will not be double counted when calculating total shares and total value | 700 | 11 | ||||||
| 2025-07-25 | 13F | Atria Wealth Solutions, Inc. | 0 | -100,00 | 0 | |||||
| 2025-07-24 | NP | FNCMX - Fidelity Nasdaq Composite Index Fund This fund is a listed as child fund of Fmr Llc and if that institution has disclosed ownership in this security, then these positions will not be double counted when calculating total shares and total value | 8.088 | 0,00 | 130 | -9,15 | ||||
| 2025-08-07 | 13F | PCJ Investment Counsel Ltd. | 113.850 | 0,93 | 2.768 | 31,62 | ||||
| 2025-08-08 | 13F | Fiera Capital Corp | 31.161 | 757 | ||||||
| 2025-08-11 | 13F | ARS Investment Partners, LLC | 10.368 | -28,83 | 253 | 5,86 | ||||
| 2025-07-14 | 13F | Painted Porch Advisors LLC | 491 | 0,00 | 12 | 33,33 | ||||
| 2025-08-14 | 13F | Ancora Advisors, LLC | 400 | 0,00 | 10 | 28,57 | ||||
| 2025-08-08 | 13F | Flaharty Asset Management, LLC | 0 | -100,00 | 0 | |||||
| 2025-08-14 | 13F | UBS Group AG | 14.331 | -7,01 | 350 | 20,69 |