Grundlæggende statistik
| Institutionelle ejere | 357 total, 355 long only, 0 short only, 2 long/short - change of 1,70% MRQ |
| Gennemsnitlig porteføljeallokering | 0.0495 % - change of -54,05% MRQ |
| Institutionelle aktier (lange) | 97.516.270 (ex 13D/G) - change of -4,42MM shares -4,33% MRQ |
| Institutionel værdi (lang) | $ 1.444.066 USD ($1000) |
Institutionelt ejerskab og aktionærer
Takeda Pharmaceutical Company Limited - Depositary Receipt (Common Stock) (US:TAK) har 357 institutionelle ejere og aktionærer, der har indsendt 13D/G- eller 13F-formularer til Securities Exchange Commission (SEC). Disse institutioner har i alt 97,516,270 aktier. Største aktionærer omfatter Capital Research Global Investors, AMRMX - AMERICAN MUTUAL FUND Class A, Morgan Stanley, Arrowstreet Capital, Limited Partnership, Goldman Sachs Group Inc, D. E. Shaw & Co., Inc., UBS Group AG, Fmr Llc, Brandes Investment Partners, Lp, and BlackRock, Inc. .
Takeda Pharmaceutical Company Limited - Depositary Receipt (Common Stock) (NYSE:TAK) institutionel ejerskabsstruktur viser aktuelle positioner i virksomheden efter institutioner og fonde, samt seneste ændringer i positionsstørrelse. Større aktionærer kan omfatte individuelle investorer, investeringsforeninger, hedgefonde eller institutioner. Skema 13D angiver, at investoren besidder (eller besidder) mere end 5 % af virksomheden og har til hensigt (eller har til hensigt at) aktivt at forfølge en ændring i forretningsstrategi. Skema 13G indikerer en passiv investering på over 5%.
The share price as of March 13, 2026 is 17,77 / share. Previously, on March 14, 2025, the share price was 15,01 / share. This represents an increase of 18,39% over that period.

Fondens stemningsscore
Fund Sentiment Score (fka Ownership Accumulation Score) finder de aktier, der bliver mest købt af fonde. Det er resultatet af en sofistikeret, multi-faktor kvantitativ model, der identificerer virksomheder med de højeste niveauer af institutionel akkumulering. Scoringsmodellen bruger en kombination af den samlede stigning i oplyste ejere, ændringerne i porteføljeallokeringer i disse ejere og andre målinger. Tallet går fra 0 til 100, hvor højere tal indikerer et højere niveau af akkumulering for sine jævnaldrende, og 50 er gennemsnittet.
Opdateringsfrekvens: Dagligt
Se Ownership Explorer, som giver en liste over højest rangerende virksomheder.
AI+ Ask Fintel’s AI assistant about Takeda Pharmaceutical Company Limited - Depositary Receipt (Common Stock).
Select a question to share a public post with an AI-crafted answer.
Thinking of good questions…
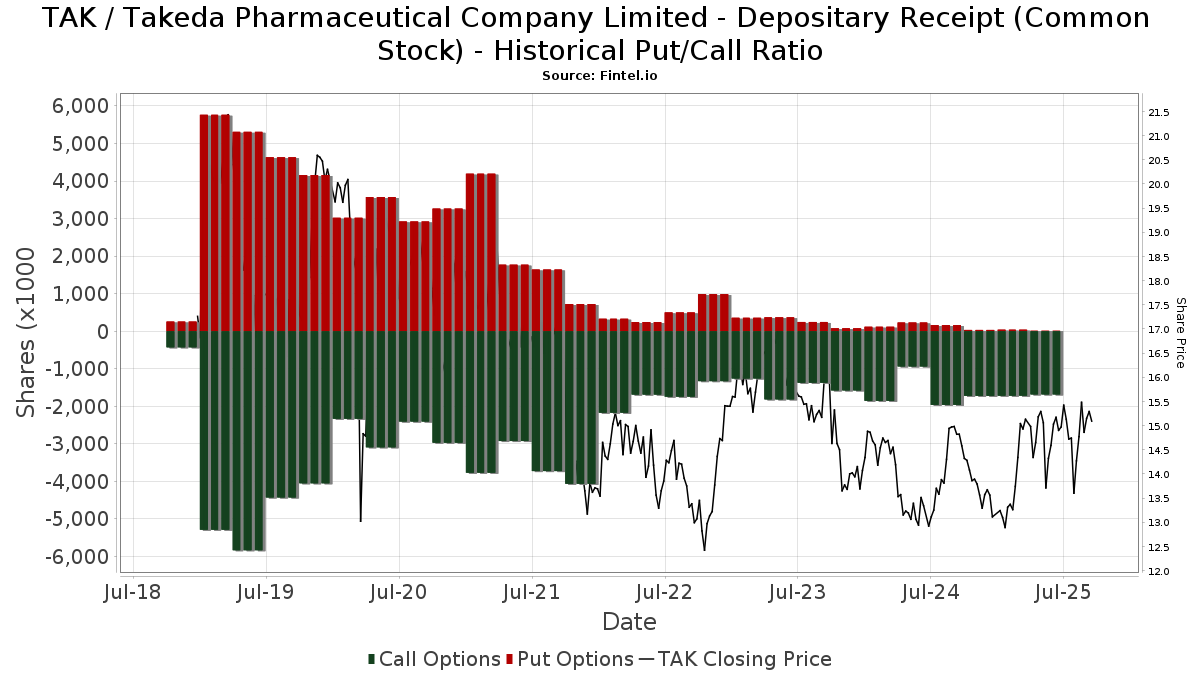
Institutionel Put/Call-forhold
Ud over at indberette standardaktie- og gældsudstedelser skal institutter med mere end 100 mill. aktiver under forvaltning også oplyse deres put- og call-optionsbeholdninger. Da salgsoptioner generelt indikerer negativ stemning, og købsoptioner indikerer positiv stemning, kan vi få en fornemmelse af den overordnede institutionelle stemning ved at plotte forholdet mellem put og kald. Diagrammet til højre viser det historiske put/call-forhold for dette instrument.
Brug af Put/Call Ratio som en indikator for investorernes stemning overvinder en af de vigtigste mangler ved at bruge totalt institutionelt ejerskab, som er, at en betydelig mængde af aktiver under forvaltning investeres passivt for at spore indekser. Passivt forvaltede fonde køber typisk ikke optioner, så indikatoren for put/call-forholdet følger mere nøje følelsen af aktivt forvaltede fonde.
13F og NPORT arkivering
Detaljer om 13F-arkivering er gratis. Detaljer om NP-ansøgninger kræver et premium-medlemskab. Grønne rækker angiver nye positioner. Røde rækker angiver lukkede positioner. Klik på linket ikon for at se den fulde transaktionshistorik.
Opgrader
for at låse premium-data op og eksportere til Excel ![]() .
.
| Fil dato | Kilde | Investor | Type | Gennemsnitlig pris (Øst) |
Aktier | Δ Aktier (%) |
Rapporteret Værdi ($1000) |
Δ Værdi (%) |
Port Alloc (%) |
|
|---|---|---|---|---|---|---|---|---|---|---|
| 2026-02-13 | 13F | Vontobel Holding Ltd. | 17.619 | 0,00 | 275 | 6,61 | ||||
| 2025-10-30 | 13F | Ridgewood Investments LLC | 0 | -100,00 | 0 | |||||
| 2026-01-05 | 13F | Rosenberg Matthew Hamilton | 1.723 | 0,00 | 27 | 4,00 | ||||
| 2026-02-05 | 13F | Arjuna Capital | 60.997 | 1,99 | 951 | 8,57 | ||||
| 2026-01-14 | 13F | Generali Investments CEE, investicni spolecnost, a.s. | 10.000 | 0,00 | 156 | 6,16 | ||||
| 2026-02-20 | 13F | Keenan, LLC | 10.941 | 273 | ||||||
| 2026-02-13 | 13F | Sei Investments Co | 191.203 | -1,08 | 2.981 | 5,30 | ||||
| 2026-01-26 | 13F | PDS Planning, Inc | 15.288 | -2,52 | 238 | 3,93 | ||||
| 2026-01-29 | 13F | Nbc Securities, Inc. | 54.409 | -0,09 | 848 | 6,40 | ||||
| 2026-01-22 | 13F | Maseco Llp | 316 | 5 | ||||||
| 2026-02-12 | 13F | Brinker Capital Investments, LLC | 78.795 | 9,69 | 1.228 | 16,84 | ||||
| 2026-02-17 | 13F | Laird Norton Trust Company, Llc | 50.212 | 783 | ||||||
| 2026-02-17 | 13F | Summit Global Investments | 104.373 | 22,50 | 2 | 0,00 | ||||
| 2026-02-13 | 13F | First Trust Advisors Lp | 2.382.629 | -5,36 | 37.145 | 0,79 | ||||
| 2026-01-07 | 13F | Retirement Wealth Solutions LLC | 95 | -63,88 | 1 | -66,67 | ||||
| 2026-01-22 | 13F | Glass Jacobson Investment Advisors llc | 35 | 0,00 | 1 | |||||
| 2026-02-17 | 13F | Citadel Advisors Llc | 389.734 | 415,36 | 6.076 | 448,78 | ||||
| 2026-02-17 | 13F | Citadel Advisors Llc | Call | 1.574.900 | -2,10 | 24.553 | 4,25 | |||
| 2026-02-17 | 13F | Clear Street Markets Llc | 0 | -100,00 | 0 | |||||
| 2026-02-17 | 13F | Aquatic Capital Management LLC | 160.141 | 248,44 | 2.497 | 271,43 | ||||
| 2026-02-17 | 13F | Tower Research Capital LLC (TRC) | 300 | -70,87 | 5 | -73,33 | ||||
| 2026-01-29 | 13F | Vanguard Group Inc | 101.870 | 0,00 | 1.588 | 6,51 | ||||
| 2026-02-13 | 13F | Arrowstreet Capital, Limited Partnership | 5.682.847 | 100,89 | 88.596 | 113,93 | ||||
| 2026-02-17 | 13F | Balyasny Asset Management Llc | 141.024 | 2.199 | ||||||
| 2026-02-09 | 13F | Mondrian Investment Partners LTD | 299 | -63,54 | 5 | -66,67 | ||||
| 2026-02-11 | 13F | Erste Asset Management GmbH | 3.674 | 57 | ||||||
| 2026-02-02 | 13F | Montag A & Associates Inc | 1.238 | -6,78 | 19 | 0,00 | ||||
| 2026-02-13 | 13F | SYM FINANCIAL Corp | 16.002 | -32,75 | 249 | -28,45 | ||||
| 2026-01-29 | 13F | Camelot Portfolios, LLC | 387 | 6 | ||||||
| 2026-02-05 | 13F | Cambridge Investment Research Advisors, Inc. | 0 | -100,00 | 0 | |||||
| 2026-01-30 | 13F | Sage Rhino Capital Llc | 11.741 | -7,63 | 183 | -1,61 | ||||
| 2026-02-03 | 13F | Manning & Napier Advisors Llc | 215.727 | -4,73 | 3.372 | 1,69 | ||||
| 2026-01-15 | 13F | Highline Wealth Partners Llc | 296 | 9,23 | 5 | 33,33 | ||||
| 2026-01-23 | 13F | Brown, Lisle/cummings, Inc. | 58 | 0,00 | 1 | |||||
| 2026-02-23 | 13F | Beaird Harris Wealth Management, LLC | 31 | 0,00 | 0 | |||||
| 2025-10-30 | 13F | Traub Capital Management LLC | 0 | -100,00 | 0 | |||||
| 2026-01-22 | 13F | Venturi Wealth Management, LLC | 23.451 | 57,27 | 366 | 67,43 | ||||
| 2026-02-11 | 13F | Dorsey & Whitney Trust CO LLC | 17.584 | 13,95 | 274 | 21,78 | ||||
| 2026-02-18 | 13F | Vident Advisory, LLC | 59.135 | -30,22 | 922 | -25,73 | ||||
| 2026-01-26 | 13F | Cwm, Llc | 5.821 | -37,90 | 0 | |||||
| 2026-02-17 | 13F | Ancora Advisors, LLC | 1.413 | 0,00 | 22 | 10,00 | ||||
| 2026-02-13 | 13F | Mml Investors Services, Llc | 101.844 | 13,63 | 1.588 | 20,96 | ||||
| 2026-01-26 | 13F | Merit Financial Group, LLC | 17.763 | -16,13 | 277 | -10,97 | ||||
| 2026-02-11 | 13F | Franklin Resources Inc | 17.412 | -10,51 | 271 | -4,58 | ||||
| 2026-01-27 | 13F | Financial Management Professionals, Inc. | 125 | 0,00 | 2 | 0,00 | ||||
| 2026-02-17 | 13F | United Capital Financial Advisers, Llc | 32.639 | 10,00 | 509 | 17,05 | ||||
| 2026-02-17 | 13F | XTX Topco Ltd | 71.476 | 437,70 | 1.114 | 474,23 | ||||
| 2026-01-15 | 13F | Nisa Investment Advisors, Llc | 1.619 | 709,50 | 25 | 1.150,00 | ||||
| 2026-01-27 | 13F | Forum Financial Management, LP | 102.334 | 0,00 | 1.595 | 6,48 | ||||
| 2026-02-12 | 13F | Commonwealth Equity Services, Llc | 19.299 | -6,96 | 301 | |||||
| 2026-02-13 | 13F | Flow Traders U.s. Llc | 20.725 | 0 | ||||||
| 2026-02-10 | 13F | Savant Capital, LLC | 20.980 | -5,53 | 327 | 0,62 | ||||
| 2026-02-23 | 13F | Mv Capital Management, Inc. | 28 | 0 | ||||||
| 2026-02-10 | 13F | Sivia Capital Partners, LLC | 22.290 | -29,35 | 348 | -24,73 | ||||
| 2026-02-10 | 13F | Catalyst Capital Advisors LLC | 192.000 | 3,78 | 2.993 | 10,52 | ||||
| 2026-02-11 | 13F | Hughes Financial Services, LLC | 145 | 0,00 | 2 | 100,00 | ||||
| 2025-10-23 | 13F | Evolution Wealth Management Inc. | 0 | -100,00 | 0 | |||||
| 2026-01-22 | 13F | Pinnacle Bancorp, Inc. | 1.195 | 0,00 | 19 | 5,88 | ||||
| 2026-02-06 | 13F | Heritage Investors Management Corp | 98.872 | -1,00 | 2 | 0,00 | ||||
| 2025-11-14 | 13F | AXA Investment Managers S.A. | 2.868 | 42 | ||||||
| 2026-01-14 | 13F | Spire Wealth Management | 793 | -3,41 | 12 | 0,00 | ||||
| 2026-01-28 | 13F | HB Wealth Management, LLC | 12.021 | -23,55 | 187 | -18,70 | ||||
| 2025-09-25 | NP | DFIC - Dimensional International Core Equity 2 ETF | 7.000 | 0,00 | 96 | -10,28 | ||||
| 2026-01-21 | 13F | Country Trust Bank | 259 | 0,00 | 4 | 33,33 | ||||
| 2025-11-13 | 13F | Glenmede Investment Management, LP | 34.677 | 12,39 | 508 | 6,51 | ||||
| 2025-10-01 | 13F | Caldwell Trust Co | 0 | -100,00 | 0 | -100,00 | ||||
| 2026-01-27 | 13F | Fortis Capital Advisors, LLC | 10.178 | 0,00 | 159 | 6,04 | ||||
| 2026-02-11 | 13F | O'shaughnessy Asset Management, Llc | 137.256 | -19,84 | 2.140 | -14,64 | ||||
| 2026-02-12 | 13F | Jane Street Group, Llc | 0 | -100,00 | 0 | |||||
| 2026-02-12 | 13F | Wealthspire Advisors, LLC | 13.346 | 255,32 | 208 | 285,19 | ||||
| 2025-11-13 | 13F | Invesco Ltd. | 0 | -100,00 | 0 | |||||
| 2026-02-03 | 13F | Gallacher Capital Management LLC | 21.681 | -20,42 | 338 | -15,08 | ||||
| 2026-01-09 | 13F | SG Americas Securities, LLC | 13.856 | 81,50 | 0 | |||||
| 2026-02-06 | 13F | Global Retirement Partners, LLC | 32.238 | 246,50 | 503 | 269,12 | ||||
| 2026-02-13 | 13F | Marshall Wace, Llp | 0 | -100,00 | 0 | |||||
| 2026-02-11 | 13F | Manchester Capital Management LLC | 4.649 | 72 | ||||||
| 2026-02-13 | 13F | Evelyn Partners Investment Management LLP | 167 | 0,00 | 3 | 0,00 | ||||
| 2026-02-05 | 13F | AlphaCore Capital LLC | 22.159 | -43,70 | 345 | -40,10 | ||||
| 2026-02-17 | 13F | Rexford Capital Inc | 8.585 | -7,02 | 134 | -1,48 | ||||
| 2025-10-31 | 13F | Whittier Trust Co Of Nevada Inc | 0 | -100,00 | 0 | |||||
| 2026-01-23 | 13F | Assetmark, Inc | 156.120 | 27,74 | 2.434 | 36,00 | ||||
| 2026-02-17 | 13F | Aqr Capital Management Llc | 679.277 | -11,35 | 10.590 | -5,61 | ||||
| 2025-11-12 | 13F | Group One Trading, L.p. | 0 | -100,00 | 0 | -100,00 | ||||
| 2026-02-10 | 13F | Cornerstone Select Advisors, LLC | 11.590 | 0,91 | 181 | 7,14 | ||||
| 2026-01-21 | 13F | Sound Income Strategies, LLC | 580 | 2.220,00 | 9 | |||||
| 2026-02-11 | 13F | TCTC Holdings, LLC | 372 | 0,00 | 6 | 0,00 | ||||
| 2026-02-17 | 13F | Private Advisor Group, LLC | 22.596 | 5,99 | 352 | 12,82 | ||||
| 2026-01-13 | 13F | Kathmere Capital Management, LLC | 11.044 | -9,23 | 172 | -3,37 | ||||
| 2026-02-11 | 13F | Vise Technologies, Inc. | 96.317 | 21,15 | 1.502 | 29,06 | ||||
| 2026-02-13 | 13F | Boston Partners | 93.710 | -20,55 | 1.461 | -15,41 | ||||
| 2025-10-24 | 13F | Hemington Wealth Management | 85 | 0 | ||||||
| 2026-02-09 | 13F | Fisher Asset Management, LLC | 0 | -100,00 | 0 | |||||
| 2026-02-06 | 13F | Vestmark Advisory Solutions, Inc. | 189.574 | 2.955 | ||||||
| 2026-01-29 | 13F | Sanctuary Advisors, LLC | 23.626 | 4,02 | 368 | 10,84 | ||||
| 2026-01-21 | 13F | Aaron Wealth Advisors LLC | 30.262 | -1,22 | 472 | 5,13 | ||||
| 2026-02-17 | 13F | Mercer Global Advisors Inc /adv | 175.738 | -17,34 | 2.740 | -11,99 | ||||
| 2026-02-27 | 13F | Strategic Investment Solutions, Inc. /IL | 125 | 0,00 | 2 | 0,00 | ||||
| 2026-02-17 | 13F | Bank Of America Corp /de/ | 362.868 | -1,49 | 5.657 | 4,91 | ||||
| 2026-02-13 | 13F | JustInvest LLC | 135.397 | -22,67 | 2.111 | -17,67 | ||||
| 2026-01-12 | 13F | Legacy Wealth Asset Management, LLC | 166.783 | 0,18 | 2.600 | 6,69 | ||||
| 2026-02-10 | 13F | Bank of New York Mellon Corp | 111.154 | -14,28 | 1.733 | -8,75 | ||||
| 2026-01-20 | 13F | Signaturefd, Llc | 65.694 | -18,68 | 1.024 | -13,37 | ||||
| 2026-02-12 | 13F | XY Capital Ltd | 0 | -100,00 | 0 | |||||
| 2026-02-13 | 13F | Entropy Technologies, LP | 42.831 | 103,23 | 668 | 116,56 | ||||
| 2025-12-09 | 13F/A | Tudor Investment Corp Et Al | Call | 30.900 | 452 | |||||
| 2026-02-17 | 13F | Engineers Gate Manager LP | 41.134 | 25,97 | 641 | 34,10 | ||||
| 2026-01-26 | 13F | Harbor Asset Planning, Inc. | 235 | 0,00 | 4 | 0,00 | ||||
| 2026-02-13 | 13F | Umb Bank N A/mo | 1.117 | 174,45 | 17 | 240,00 | ||||
| 2026-02-13 | 13F | SRS Capital Advisors, Inc. | 7.178 | -88,27 | 112 | -87,60 | ||||
| 2026-01-28 | 13F | CAPROCK Group, Inc. | 36.272 | -32,15 | 565 | -29,46 | ||||
| 2026-01-16 | 13F | Capital Performance Advisors Llp | 0 | -100,00 | 0 | |||||
| 2026-02-02 | 13F | Oppenheimer Asset Management Inc. | 58.274 | 0,51 | 908 | 7,08 | ||||
| 2026-02-17 | 13F | Captrust Financial Advisors | 118.774 | 188,96 | 1.852 | 207,99 | ||||
| 2026-01-08 | 13F | Versant Capital Management, Inc | 34.983 | 29,23 | 545 | 37,63 | ||||
| 2026-02-03 | 13F | Strengthening Families & Communities, LLC | 0 | -100,00 | 0 | |||||
| 2025-09-25 | NP | AMRMX - AMERICAN MUTUAL FUND Class A | 12.888.047 | 0,00 | 176.824 | -10,27 | ||||
| 2026-02-13 | 13F | Macquarie Group Ltd | 324 | 0,00 | 5 | 25,00 | ||||
| 2025-11-12 | 13F | Buckingham Strategic Partners | 0 | -100,00 | 0 | |||||
| 2026-02-11 | 13F | Zions Bancorporation, National Association /ut/ | 371 | 0,00 | 6 | 0,00 | ||||
| 2026-02-14 | 13F | Whipplewood Advisors, LLC | 60 | 1 | ||||||
| 2026-02-12 | 13F | Gould Capital, LLC | 70 | 0,00 | 1 | 0,00 | ||||
| 2026-02-10 | 13F | Goldman Sachs Group Inc | 4.804.581 | -3,00 | 74.903 | 3,29 | ||||
| 2025-10-09 | 13F | AdvisorNet Financial, Inc | 0 | -100,00 | 0 | |||||
| 2026-01-21 | 13F | SJS Investment Consulting Inc. | 961 | 15 | ||||||
| 2026-02-10 | 13F | Acadian Asset Management Llc | 28.341 | 0 | ||||||
| 2026-02-11 | 13F | Cerity Partners LLC | 121.660 | -21,76 | 1.897 | -16,70 | ||||
| 2025-11-14 | 13F | Wetherby Asset Management Inc | 38.074 | -15,14 | 557 | -19,62 | ||||
| 2026-01-23 | 13F | Intelligence Driven Advisers, LLC | 15.419 | 4,14 | 240 | 11,11 | ||||
| 2025-11-12 | 13F | Bellwether Advisors, LLC | 0 | -100,00 | 0 | |||||
| 2026-01-29 | 13F | China Universal Asset Management Co., Ltd. | 64.000 | 998 | ||||||
| 2026-02-24 | 13F | DGS Capital Management, LLC | 14.170 | -17,47 | 221 | -12,35 | ||||
| 2026-02-17 | 13F | Abel Hall, LLC | 33.318 | 519 | ||||||
| 2026-01-20 | 13F | Global Trust Asset Management, LLC | 25 | -99,67 | 0 | -100,00 | ||||
| 2026-02-12 | 13F | Bank Of Montreal /can/ | 125.642 | 14,55 | 1.959 | 21,99 | ||||
| 2026-02-03 | 13F | Ballentine Partners, LLC | 23.493 | -49,24 | 366 | -45,94 | ||||
| 2026-02-17 | 13F | Equitable Holdings, Inc. | 10.840 | -44,36 | 169 | -41,05 | ||||
| 2026-01-30 | 13F | Ares Financial Consulting, LLC | 71 | 1 | ||||||
| 2026-02-17 | 13F | Susquehanna International Group, Llp | Call | 0 | -100,00 | 0 | -100,00 | |||
| 2026-02-13 | 13F | Transamerica Financial Advisors, Inc. | 294 | 5 | ||||||
| 2026-02-17 | 13F | Susquehanna International Group, Llp | 28.675 | 447 | ||||||
| 2026-01-28 | 13F | WPG Advisers, LLC | 63 | 0,00 | 1 | |||||
| 2026-02-04 | 13F | Ameritas Advisory Services, LLC | 0 | -100,00 | 0 | |||||
| 2026-01-28 | 13F | Geneos Wealth Management Inc. | 307 | 0,00 | 5 | 0,00 | ||||
| 2025-11-14 | 13F | ICONIQ Capital, LLC | 0 | -100,00 | 0 | |||||
| 2025-11-14 | 13F | Wood Tarver Financial Group, LLC | 0 | -100,00 | 0 | |||||
| 2026-01-14 | 13F | Jfs Wealth Advisors, Llc | 849 | -3,08 | 13 | 8,33 | ||||
| 2026-02-11 | 13F | Janney Montgomery Scott LLC | 10.002 | 0 | ||||||
| 2026-02-11 | 13F | Hilton Head Capital Partners, LLC | 163 | 3 | ||||||
| 2026-02-13 | 13F | Colony Group, LLC | 562.049 | 458,75 | 8.761 | 495,11 | ||||
| 2026-01-23 | 13F | Natural Investments, Llc | 16.524 | 25,37 | 0 | |||||
| 2026-01-29 | 13F | Resonant Capital Advisors, LLC | 0 | -100,00 | 0 | |||||
| 2025-11-14 | 13F | Adage Capital Partners Gp, L.l.c. | 0 | -100,00 | 0 | |||||
| 2026-02-13 | 13F | Smartleaf Asset Management LLC | 24.772 | 24,51 | 387 | 33,45 | ||||
| 2025-11-14 | 13F | Jain Global LLC | 0 | -100,00 | 0 | |||||
| 2026-02-06 | 13F | Hexagon Capital Partners LLC | 10.330 | 161 | ||||||
| 2026-02-17 | 13F | SageView Advisory Group, LLC | 928 | 14 | ||||||
| 2025-10-21 | 13F | Simon Quick Advisors, Llc | 0 | -100,00 | 0 | -100,00 | ||||
| 2026-02-10 | 13F | Rothschild Investment Llc | 16.482 | -8,29 | 257 | -2,66 | ||||
| 2025-10-15 | 13F | Atwood & Palmer Inc | 0 | -100,00 | 0 | |||||
| 2026-02-11 | 13F | Capital Research Global Investors | 13.486.772 | 0,62 | 210.259 | 7,15 | ||||
| 2026-01-30 | 13F | Catalytic Wealth RIA, LLC | 0 | -100,00 | 0 | |||||
| 2026-02-02 | 13F | Qrg Capital Management, Inc. | 288.730 | 2,70 | 4.501 | 9,38 | ||||
| 2026-01-27 | 13F | Optas, LLC | 0 | -100,00 | 0 | |||||
| 2026-02-10 | 13F | Tidemark, LLC | 126 | 0,00 | 2 | 0,00 | ||||
| 2026-02-17 | 13F | Evolve Private Wealth, Llc | 24.904 | 388 | ||||||
| 2025-11-14 | 13F | Verition Fund Management LLC | 0 | -100,00 | 0 | |||||
| 2026-02-12 | 13F | Campbell & CO Investment Adviser LLC | 0 | -100,00 | 0 | |||||
| 2026-01-28 | 13F | Cranbrook Wealth Management, LLC | 1.313 | 0,00 | 20 | 5,26 | ||||
| 2026-02-13 | 13F | Palisade Asset Management, LLC | 0 | -100,00 | 0 | |||||
| 2025-09-25 | NP | DFAX - Dimensional World ex U.S. Core Equity 2 ETF | 5.264 | 0,00 | 72 | -10,00 | ||||
| 2026-02-17 | 13F | Jones Financial Companies Lllp | 1.585 | 9,84 | 25 | 14,29 | ||||
| 2026-01-16 | 13F | Trust Co Of Vermont | 370 | 0,00 | 6 | 0,00 | ||||
| 2026-02-12 | 13F | Groupe la Francaise | 0 | -100,00 | 0 | |||||
| 2026-02-17 | 13F | Kotler Kevin | 20.000 | 312 | ||||||
| 2026-01-05 | 13F | GAMMA Investing LLC | 9.138 | -0,74 | 142 | 5,97 | ||||
| 2026-02-17 | 13F | Quantinno Capital Management LP | 1.069.327 | 9,80 | 16.671 | 16,93 | ||||
| 2026-01-29 | 13F | UMA Financial Services, Inc. | 124 | -18,42 | 2 | -50,00 | ||||
| 2026-02-17 | 13F | Royal Bank Of Canada | 554.126 | 13,23 | 8.639 | 20,57 | ||||
| 2026-02-13 | 13F | Y-Intercept (Hong Kong) Ltd | 16.973 | 265 | ||||||
| 2026-02-17 | 13F | Northern Trust Corp | 1.698.915 | -6,84 | 26.486 | -0,80 | ||||
| 2026-02-17 | 13F | Lighthouse Investment Partners, LLC | 56.265 | 877 | ||||||
| 2026-01-29 | 13F | Cornerstone National Bank & Trust Co | 654 | 0,00 | 10 | 11,11 | ||||
| 2026-01-30 | 13F | North Star Investment Management Corp. | 226 | 4 | ||||||
| 2025-11-14 | 13F | Credit Agricole S A | 0 | -100,00 | 0 | |||||
| 2026-02-13 | 13F | American Century Companies Inc | 408.600 | 2,41 | 6.370 | 9,08 | ||||
| 2026-01-16 | 13F | Piscataqua Savings Bank | 518 | 0,00 | 8 | 14,29 | ||||
| 2026-01-26 | 13F | Private Trust Co Na | 1.707 | 84,74 | 27 | 100,00 | ||||
| 2026-01-30 | 13F | Us Bancorp \de\ | 217.528 | 83,22 | 3.391 | 95,11 | ||||
| 2026-02-04 | 13F | BCJ Capital Management, LLC | 13.623 | 212 | ||||||
| 2026-02-09 | 13F | Hantz Financial Services, Inc. | 253.478 | -2,57 | 4 | 0,00 | ||||
| 2026-02-03 | 13F | Ethic Inc. | 304.655 | -1,96 | 4.750 | 4,40 | ||||
| 2025-10-22 | 13F | Riverview Trust Co | 0 | -100,00 | 0 | |||||
| 2026-02-13 | 13F | Cornerstone Financial Management LLC | 120 | 2 | ||||||
| 2026-02-06 | 13F | Creative Financial Designs Inc /adv | 1.204 | -1,15 | 19 | 5,88 | ||||
| 2026-02-13 | 13F | Parkside Financial Bank & Trust | 2.560 | 192,24 | 40 | 225,00 | ||||
| 2026-02-12 | 13F | Dimensional Fund Advisors Lp | 163.286 | -3,13 | 2.546 | 3,16 | ||||
| 2026-02-11 | 13F | GW&K Investment Management, LLC | 504 | 0 | ||||||
| 2026-02-10 | 13F | Bruce G. Allen Investments, LLC | 581 | 40,34 | 9 | 50,00 | ||||
| 2026-02-06 | 13F | Addison Advisors LLC | 2.170 | -13,92 | 34 | -8,33 | ||||
| 2026-02-17 | 13F | Two Sigma Securities, Llc | 0 | -100,00 | 0 | |||||
| 2026-02-19 | 13F | Atomi Financial Group, Inc. | 45.673 | 8,34 | 712 | 15,40 | ||||
| 2026-01-14 | 13F | Tradewinds Capital Management, LLC | 0 | -100,00 | 0 | |||||
| 2026-02-17 | 13F | Voloridge Investment Management, Llc | 962.502 | 1.070,74 | 15.005 | 1.147,30 | ||||
| 2026-02-10 | 13F | Ellevest, Inc. | 33.741 | -30,54 | 526 | -26,02 | ||||
| 2026-02-11 | 13F | Brandes Investment Partners, Lp | 3.881.882 | -1,27 | 60.519 | 5,14 | ||||
| 2026-02-09 | 13F | Hartland & Co., LLC | 25 | 0,00 | 0 | |||||
| 2026-02-17 | 13F | Bulltick Wealth Management, LLC | 11.397 | 0,00 | 178 | 6,63 | ||||
| 2026-01-09 | 13F | Murphy, Middleton, Hinkle & Parker, Inc. | 714 | 467 | ||||||
| 2026-02-06 | 13F | Larson Financial Group LLC | 7.000 | -10,52 | 109 | -4,39 | ||||
| 2026-02-10 | 13F | Private Wealth Asset Management, LLC | 0 | -100,00 | 0 | |||||
| 2026-02-05 | 13F | Elyxium Wealth, LLC | 1.118 | 17 | ||||||
| 2026-02-06 | 13F | Kingdom Financial Group LLC. | 1 | 0 | ||||||
| 2026-01-12 | 13F | Abound Wealth Management | 0 | -100,00 | 0 | |||||
| 2026-02-19 | 13F | CI Private Wealth, LLC | 91.363 | -18,50 | 1.384 | -15,72 | ||||
| 2026-02-11 | 13F | Syon Capital Llc | 43.131 | 672 | ||||||
| 2026-02-13 | 13F | Toroso Investments, LLC | 60.614 | -33,86 | 945 | -29,60 | ||||
| 2026-02-17 | 13F | Creative Planning | 395.390 | -14,68 | 6.164 | -9,14 | ||||
| 2026-01-21 | 13F | Sowell Financial Services LLC | 13.111 | 204 | ||||||
| 2026-02-13 | 13F | Kilter Group LLC | 29 | 0 | ||||||
| 2026-01-30 | 13F | American Capital Advisory, LLC | 9 | -75,68 | 0 | |||||
| 2026-01-06 | 13F | Investors Research Corp | 44.519 | 0,00 | 694 | 6,61 | ||||
| 2026-02-13 | 13F | Focused Alpha, Llc | 14.180 | 221 | ||||||
| 2026-02-13 | 13F | Ubs Asset Management Americas Inc | 10.650 | 166 | ||||||
| 2026-01-22 | 13F | Bfsg, Llc | 45 | 1 | ||||||
| 2025-10-28 | 13F | Arlington Trust Co LLC | 0 | -100,00 | 0 | |||||
| 2026-02-05 | 13F | Allworth Financial LP | 12.475 | 1,38 | 194 | 7,78 | ||||
| 2026-02-13 | 13F | Neuberger Berman Group LLC | 62.728 | 29,46 | 978 | 37,80 | ||||
| 2026-03-04 | 13F | SHP Wealth Management | 2.695 | 42 | ||||||
| 2026-02-09 | 13F | Arista Wealth Management, LLC | 10.961 | 0,00 | 171 | 6,25 | ||||
| 2026-02-17 | 13F | D. E. Shaw & Co., Inc. | 4.293.750 | 1.426,43 | 66.940 | 1.525,52 | ||||
| 2026-01-16 | 13F | Five Oceans Advisors | 11.648 | -6,97 | 182 | -1,09 | ||||
| 2026-01-29 | 13F | Managed Asset Portfolios, Llc | 1.495.746 | 0,63 | 23.319 | 7,16 | ||||
| 2026-02-09 | 13F | Coldstream Capital Management Inc | 0 | -100,00 | 0 | |||||
| 2026-02-24 | 13F | SG Trading Solutions, LLC | 43.758 | 1 | ||||||
| 2026-02-09 | 13F | Employees Retirement System of Texas | 0 | -100,00 | 0 | |||||
| 2026-01-27 | 13F | Probity Advisors, Inc. | 43.433 | 1,16 | 677 | 7,80 | ||||
| 2026-01-26 | 13F | Reyes Financial Architecture, Inc. | 1.670 | 0,00 | 26 | 8,33 | ||||
| 2026-01-07 | 13F | Sagespring Wealth Partners, Llc | 0 | -100,00 | 0 | |||||
| 2026-02-09 | 13F | Legal & General Group Plc | 107.846 | -12,21 | 1.681 | -6,61 | ||||
| 2026-01-26 | 13F | Clean Yield Group | 260.804 | -1,97 | 4.066 | 4,39 | ||||
| 2026-02-12 | 13F | Front Row Advisors LLC | 57 | 0,00 | 1 | |||||
| 2026-02-04 | 13F | Pure Financial Advisors, Inc. | 10.528 | 164 | ||||||
| 2026-02-02 | 13F | Cornerstone Planning Group LLC | 457 | 62,63 | 8 | -77,42 | ||||
| 2026-02-03 | 13F | Crossmark Global Holdings, Inc. | 745.176 | 2,47 | 11.617 | 9,12 | ||||
| 2026-02-11 | 13F | Rise Advisors, LLC | 0 | -100,00 | 0 | |||||
| 2026-02-12 | 13F | Qtron Investments LLC | 11.757 | 183 | ||||||
| 2026-01-13 | 13F | Mather Group, Llc. | 0 | -100,00 | 0 | |||||
| 2026-02-05 | 13F | Td Private Client Wealth Llc | 9.824 | 3.783,00 | 153 | 5.000,00 | ||||
| 2026-02-17 | 13F | Qube Research & Technologies Ltd | 197.507 | -88,88 | 3.079 | -88,16 | ||||
| 2026-02-10 | 13F | Godfrey Financial Associates, Inc. | 35 | 1 | ||||||
| 2026-02-13 | 13F | National Bank Of Canada /fi/ | 6.726 | 24,74 | 105 | 33,33 | ||||
| 2026-02-10 | 13F | Thoroughbred Financial Services, Llc | 0 | -100,00 | 0 | |||||
| 2026-02-02 | 13F | Fifth Third Bancorp | 3.304 | -20,31 | 52 | -15,00 | ||||
| 2026-02-11 | 13F | SmartHarvest Portfolios, LLC | 10.315 | 161 | ||||||
| 2026-02-09 | 13F | Bleakley Financial Group, LLC | 362.758 | 0,12 | 5.655 | 6,62 | ||||
| 2026-01-27 | 13F | Checchi Capital Advisers, LLC | 13.805 | -2,71 | 215 | 3,86 | ||||
| 2026-02-11 | 13F | IMA Wealth, Inc. | 201 | -19,92 | 3 | 0,00 | ||||
| 2026-02-13 | 13F | Fairman Group, LLC | 0 | -100,00 | 0 | |||||
| 2026-02-06 | 13F | GPS Wealth Strategies Group, LLC | 0 | -100,00 | 0 | |||||
| 2026-01-30 | 13F | Keybank National Association/oh | 12.846 | 200 | ||||||
| 2026-01-27 | 13F | Bayforest Capital Ltd | 14.990 | -24,12 | 234 | -19,38 | ||||
| 2026-02-17 | 13F | Schonfeld Strategic Advisors LLC | 115.250 | 1.797 | ||||||
| 2025-11-04 | 13F | High Note Wealth, LLC | 0 | -100,00 | 0 | |||||
| 2026-02-13 | 13F | Corient IA LLC | 14.880 | -40,48 | 232 | -36,89 | ||||
| 2026-02-05 | 13F | Atria Investments Llc | 10.520 | 164 | ||||||
| 2026-02-12 | 13F | Hm Payson & Co | 100 | 0,00 | 2 | 0,00 | ||||
| 2026-02-10 | 13F | Principia Wealth Advisory, LLC | 148 | -97,97 | 2 | -98,11 | ||||
| 2026-01-16 | 13F | Crowley Wealth Management, Inc. | 0 | -100,00 | 0 | |||||
| 2026-02-13 | 13F | Barclays Plc | 12.137 | 593,94 | 189 | 656,00 | ||||
| 2026-02-13 | 13F | Barclays Plc | Call | 5.200 | 81 | |||||
| 2026-02-13 | 13F | Mariner, LLC | 187.640 | -24,63 | 2.926 | -19,73 | ||||
| 2025-11-05 | 13F | SOUTH STATE Corp | 0 | -100,00 | 0 | -100,00 | ||||
| 2026-02-12 | 13F | Brown Brothers Harriman & Co | 912 | 3.277,78 | 14 | |||||
| 2026-02-06 | 13F | Envestnet Portfolio Solutions, Inc. | 27.387 | 47,88 | 427 | 57,20 | ||||
| 2026-01-23 | 13F | Farther Finance Advisors, LLC | 9.869 | 40,97 | 154 | 50,00 | ||||
| 2026-02-12 | 13F | Federation des caisses Desjardins du Quebec | 9.775 | 0,00 | 152 | 6,29 | ||||
| 2026-02-13 | 13F | Van Eck Associates Corp | 2.305.397 | 98,35 | 36 | 105,88 | ||||
| 2026-02-04 | 13F | Paradigm Asset Management Co Llc | 2.500 | 0,00 | 39 | 5,56 | ||||
| 2026-02-02 | 13F | Highland Capital Management, Llc | 54.800 | -11,11 | 854 | -5,32 | ||||
| 2026-02-17 | 13F | Citadel Advisors Llc | Put | 0 | -100,00 | 0 | ||||
| 2026-02-06 | 13F | Pnc Financial Services Group, Inc. | 58.882 | -19,94 | 918 | -14,78 | ||||
| 2026-02-17 | 13F | Russell Investments Group, Ltd. | 99.982 | 4,95 | 1.559 | 11,76 | ||||
| 2026-02-12 | 13F | Triumph Capital Management | 1.050 | 0,00 | 16 | 6,67 | ||||
| 2026-02-12 | 13F | Mount Yale Investment Advisors, LLC | 29.790 | 464 | ||||||
| 2026-02-13 | 13F | Baird Financial Group, Inc. | 10.081 | -0,89 | 157 | 6,08 | ||||
| 2026-02-17 | 13F | Raymond James Financial Inc | 173.609 | 12,62 | 2.708 | 20,04 | ||||
| 2026-02-17 | 13F | Millennium Management Llc | Call | 376.200 | 2.750,00 | 5.865 | 2.938,34 | |||
| 2026-02-13 | 13F | Squarepoint Ops LLC | 0 | -100,00 | 0 | |||||
| 2025-11-14 | 13F | Axa S.a. | 0 | -100,00 | 0 | |||||
| 2026-02-06 | 13F | IFP Advisors, Inc | 769 | -7,90 | 12 | -8,33 | ||||
| 2026-02-12 | 13F | Callan Family Office, LLC | 154.254 | 273,33 | 2.405 | 298,01 | ||||
| 2026-01-20 | 13F | Wall Street Access Asset Management, LLC | 251 | 0,00 | 4 | 0,00 | ||||
| 2026-02-12 | 13F | Principal Securities, Inc. | 0 | -100,00 | 0 | |||||
| 2026-01-23 | 13F | BSW Wealth Partners | 13.878 | -28,68 | 216 | -23,94 | ||||
| 2025-11-07 | 13F | Sierra Ocean, Llc | 0 | -100,00 | 0 | |||||
| 2026-02-10 | 13F | Natixis Advisors, L.p. | 227.754 | -52,59 | 4 | -57,14 | ||||
| 2026-02-17 | 13F | Fmr Llc | 4.056.868 | -3,11 | 63.247 | 3,18 | ||||
| 2026-01-20 | 13F | Toth Financial Advisory Corp | 10 | 0 | ||||||
| 2026-01-26 | 13F | JNBA Financial Advisors | 173 | 3 | ||||||
| 2025-11-13 | 13F | Kayne Anderson Rudnick Investment Management Llc | 0 | -100,00 | 0 | |||||
| 2026-02-17 | 13F | Millennium Management Llc | Put | 97.800 | 0,00 | 1.525 | 6,50 | |||
| 2026-02-17 | 13F | Millennium Management Llc | 890.089 | -65,18 | 13.876 | -62,92 | ||||
| 2026-02-12 | 13F | Collier Financial | 50 | 0,00 | 1 | |||||
| 2026-02-06 | 13F | Motco | 401 | 0,00 | 6 | 20,00 | ||||
| 2026-02-06 | 13F | EverSource Wealth Advisors, LLC | 13.227 | -21,86 | 206 | -16,60 | ||||
| 2026-01-23 | 13F | Rsm Us Wealth Management Llc | 34.610 | 13,80 | 541 | 21,35 | ||||
| 2026-02-12 | 13F | Steward Partners Investment Advisory, Llc | 978 | -3,55 | 15 | 7,14 | ||||
| 2026-02-13 | 13F | Ieq Capital, Llc | 91.110 | 3,10 | 1.420 | 9,82 | ||||
| 2025-11-07 | 13F | Putney Financial Group LLC | 0 | -100,00 | 0 | |||||
| 2026-02-10 | 13F | Lido Advisors, LLC | 27.714 | 0,00 | 406 | 0,25 | ||||
| 2026-02-17 | 13F | LMR Partners LLP | 0 | -100,00 | 0 | |||||
| 2026-02-12 | 13F | CIBC Private Wealth Group, LLC | 354 | -64,92 | 6 | -64,29 | ||||
| 2026-02-12 | 13F | Skopos Labs, Inc. | 86.205 | 217,50 | 1.359 | 232,03 | ||||
| 2025-11-20 | 13F | First Affirmative Financial Network | 41.852 | 16,82 | 613 | 10,67 | ||||
| 2025-09-26 | NP | DSEFX - Domini Impact Equity Fund Investor Shares | 98.400 | -0,51 | 1.350 | -10,71 | ||||
| 2026-02-13 | 13F | Evelyn Partners Investment Management Services Ltd | 98 | 0,00 | 2 | 0,00 | ||||
| 2026-01-22 | 13F | Financial Consulate, Inc | 781 | 72,03 | 12 | 100,00 | ||||
| 2026-01-22 | 13F | Bartlett & Co. Wealth Management Llc | 20.781 | -17,95 | 324 | -12,70 | ||||
| 2026-02-14 | 13F | Rockefeller Capital Management L.P. | 5.184 | 30,61 | 81 | 37,93 | ||||
| 2026-02-12 | 13F | DRW Securities, LLC | 0 | -100,00 | 0 | |||||
| 2026-02-17 | 13F | Regal Investment Advisors LLC | 28.698 | 447 | ||||||
| 2025-10-08 | 13F | Armstrong Advisory Group, Inc | 0 | -100,00 | 0 | |||||
| 2026-02-06 | 13F | HighTower Advisors, LLC | 94.828 | -4,06 | 1.478 | 2,14 | ||||
| 2026-01-15 | 13F | Allspring Global Investments Holdings, LLC | 20.395 | -4,38 | 318 | 3,26 | ||||
| 2026-02-13 | 13F | Bridgefront Capital, LLC | 36.579 | -56,31 | 570 | -53,47 | ||||
| 2026-02-17 | 13F | National Asset Management, Inc. | 13.371 | 1,55 | 208 | 8,33 | ||||
| 2026-02-12 | 13F | Rossby Financial, LCC | 17 | 0 | ||||||
| 2026-02-18 | 13F | GWM Advisors LLC | 0 | -100,00 | 0 | |||||
| 2025-09-29 | NP | CVY - Invesco Zacks Multi-Asset Income ETF This fund is a listed as child fund of Invesco Ltd. and if that institution has disclosed ownership in this security, then these positions will not be double counted when calculating total shares and total value | 33.874 | -29,02 | 465 | -36,35 | ||||
| 2026-02-10 | 13F | Envestnet Asset Management Inc | 1.020.644 | 17,77 | 15.912 | 25,41 | ||||
| 2026-02-09 | 13F | Harbour Investments, Inc. | 4.612 | 300,35 | 72 | 343,75 | ||||
| 2026-02-11 | 13F | West Family Investments, Inc. | 15.007 | -60,36 | 234 | -57,94 | ||||
| 2025-11-14 | 13F | Binnacle Investments Inc | 520 | 88,41 | 8 | 75,00 | ||||
| 2026-02-17 | 13F | Advisory Services Network, LLC | 0 | -100,00 | 0 | |||||
| 2026-01-29 | 13F | Inscription Capital, LLC | 21.233 | 0,08 | 331 | 6,77 | ||||
| 2026-02-02 | 13F | Truist Financial Corp | 65.144 | 6,05 | 1.016 | 12,90 | ||||
| 2026-02-13 | 13F | PCM Encore, LLC | 75.790 | 1.182 | ||||||
| 2026-02-11 | 13F | Parallel Advisors, LLC | 22.308 | -6,41 | 348 | -0,29 | ||||
| 2026-01-30 | 13F/A | M&t Bank Corp | 61.562 | -10,15 | 960 | -4,39 | ||||
| 2025-11-12 | 13F | Islay Capital Management, Llc | 0 | -100,00 | 0 | |||||
| 2026-02-02 | 13F | CENTRAL TRUST Co | 62 | -1,59 | 1 | |||||
| 2026-01-07 | 13F | Aventura Private Wealth, LLC | 0 | -100,00 | 0 | -100,00 | ||||
| 2026-02-13 | 13F | Kestra Advisory Services, LLC | 6.477 | 101 | ||||||
| 2025-11-12 | 13F | NewSquare Capital LLC | 0 | -100,00 | 0 | |||||
| 2026-01-28 | 13F | Salomon & Ludwin, LLC | 1.132 | -2,33 | 18 | 6,25 | ||||
| 2026-02-13 | 13F | MAI Capital Management | 2.080 | -17,98 | 32 | -13,51 | ||||
| 2026-02-17 | 13F | Two Sigma Advisers, Lp | 298.400 | 44,02 | 4.652 | 53,38 | ||||
| 2025-10-07 | 13F | GFG Capital, LLC | 0 | -100,00 | 0 | |||||
| 2026-02-12 | 13F | Hrt Financial Lp | 59.081 | 29,19 | 1 | |||||
| 2026-02-17 | 13F | Graham Capital Management, L.P. | 0 | -100,00 | 0 | |||||
| 2025-10-15 | 13F | Stephens Consulting, LLC | 0 | -100,00 | 0 | -100,00 | ||||
| 2026-02-13 | 13F | Morgan Stanley | 6.373.202 | -17,13 | 99.358 | -11,75 | ||||
| 2026-02-03 | 13F | Coston, McIsaac & Partners | 259 | 0,00 | 0 | |||||
| 2026-01-28 | 13F | Financial Perspectives, Inc | 1.437 | 0,00 | 22 | 4,76 | ||||
| 2026-02-09 | 13F | Huntington National Bank | 191 | 19.000,00 | 3 | |||||
| 2026-02-05 | 13F | Bessemer Group Inc | 2.214 | 105,19 | 0 | |||||
| 2026-01-22 | 13F | Jackson Thornton Asset Management, Llc | 13.128 | -14,81 | 207 | -5,91 | ||||
| 2026-02-12 | 13F | Colonial Trust Advisors | 352 | 0,00 | 5 | 0,00 | ||||
| 2026-01-08 | 13F | Wealth Enhancement Advisory Services, Llc | 63.977 | -4,72 | 1.010 | 4,12 | ||||
| 2026-01-16 | 13F | Ronald Blue Trust, Inc. | 12.355 | -11,63 | 193 | -5,88 | ||||
| 2026-02-04 | 13F | Tsfg, Llc | 7.739 | -51,97 | 0 | |||||
| 2026-02-17 | 13F | Glenmede Trust Co Na | 27.565 | 12,14 | 430 | 17,53 | ||||
| 2026-02-12 | 13F | Renaissance Technologies Llc | 2.618.300 | -32,25 | 40.819 | -27,85 | ||||
| 2026-02-17 | 13F | Ameriprise Financial Inc | 180.135 | -0,66 | 2.808 | 5,80 | ||||
| 2026-02-11 | 13F | Jpmorgan Chase & Co | 242.179 | -2,16 | 3.776 | 4,20 | ||||
| 2026-01-27 | 13F | Belpointe Asset Management LLC | 10.178 | 0,00 | 159 | 6,04 | ||||
| 2026-02-13 | 13F | Citigroup Inc | 19.070 | -63,88 | 297 | -61,53 | ||||
| 2026-02-17 | 13F | Financial Avengers, Inc. | 2.500 | 0,00 | 37 | 0,00 | ||||
| 2026-02-10 | 13F | Root Financial Partners, LLC | 177 | -77,88 | 3 | -81,82 | ||||
| 2026-01-08 | 13F | True Wealth Design, LLC | 1.818 | -32,94 | 28 | -28,21 | ||||
| 2026-01-28 | 13F | Gold Investment Management Ltd. | 108.282 | 4,24 | 1.688 | 11,05 | ||||
| 2026-01-29 | 13F | UBS Group AG | 4.123.523 | -30,04 | 64.286 | -25,50 | ||||
| 2026-02-10 | 13F | Bnp Paribas Arbitrage, Sa | 185.549 | 1.557,58 | 2.893 | 1.674,23 | ||||
| 2025-09-24 | NP | SNTKX - Steward International Enhanced Index Fund Class A | 651.533 | 100,29 | 8.939 | 79,75 | ||||
| 2026-02-18 | 13F | EP Wealth Advisors, Inc. | 23.081 | 360 | ||||||
| 2026-02-13 | 13F | Walleye Trading LLC | 27.062 | 366,75 | 422 | 401,19 | ||||
| 2026-02-13 | 13F | Walleye Trading LLC | Put | 65.100 | 161,45 | 1.015 | 178,57 | |||
| 2026-02-13 | 13F | Walleye Trading LLC | Call | 99.600 | 1.553 | |||||
| 2026-02-12 | 13F | BlackRock, Inc. | 2.731.598 | -17,41 | 42.586 | -12,06 | ||||
| 2026-02-02 | 13F | CX Institutional | 41 | -2,38 | 0 | |||||
| 2025-11-12 | 13F | Ameriflex Group, Inc. | 0 | -100,00 | 0 | -100,00 | ||||
| 2026-01-23 | 13F | Steigerwald, Gordon & Koch Inc. | 1 | 0,00 | 0 | |||||
| 2026-02-17 | 13F | Toronto Dominion Bank | 823.200 | -72,60 | 12.834 | -70,82 | ||||
| 2026-02-11 | 13F | Atlantic Private Wealth, LLC | 0 | -100,00 | 0 | |||||
| 2026-02-13 | 13F | Pinnacle Wealth Planning Services, Inc. | 6.464 | 101 | ||||||
| 2026-02-13 | 13F | Walleye Capital LLC | 83.083 | -62,49 | 1.295 | -60,07 | ||||
| 2026-01-23 | 13F | Lester Murray Antman dba SimplyRich | 31.139 | -3,06 | 0 | |||||
| 2026-01-16 | 13F | Bangor Savings Bank | 186 | 0,00 | 3 | 0,00 | ||||
| 2026-02-11 | 13F | LPL Financial LLC | 356.434 | 41,34 | 5.557 | 50,53 | ||||
| 2026-02-04 | 13F | Abc Arbitrage Sa | 0 | -100,00 | 0 | |||||
| 2026-02-13 | 13F | Pathstone Holdings, LLC | 216.377 | -9,21 | 3.373 | -3,32 | ||||
| 2026-02-17 | 13F | Capital Fund Management S.a. | 0 | -100,00 | 0 | |||||
| 2026-01-30 | 13F | Carrera Capital Advisors | 160.359 | 6,48 | 2.500 | 13,38 | ||||
| 2026-02-03 | 13F | Sequoia Financial Advisors, LLC | 83.232 | -19,86 | 1.298 | -14,67 | ||||
| 2026-02-10 | 13F | CIBC World Markets Inc. | 10.835 | 169 | ||||||
| 2026-02-17 | 13F | Angeles Wealth Management, Llc | 11.614 | -17,32 | 181 | -11,71 | ||||
| 2026-02-20 | 13F | Sunbelt Securities, Inc. | 42 | -89,06 | 1 | -100,00 | ||||
| 2026-01-23 | 13F | U.S. Capital Wealth Advisors, LLC | 0 | -100,00 | 0 | |||||
| 2026-02-09 | 13F | Smithfield Trust Co | 2.112 | 13,00 | 0 | |||||
| 2026-02-13 | 13F | Stifel Financial Corp | 554.290 | 8,91 | 8.641 | 15,99 | ||||
| 2026-01-30 | 13F | Bogart Wealth, LLC | 0 | -100,00 | 0 | |||||
| 2026-02-13 | 13F | Sterling Capital Management LLC | 1.369 | 0,00 | 21 | 5,00 | ||||
| 2025-09-25 | NP | VEU - Vanguard FTSE All-World ex-US Index Fund ETF Shares | 101.870 | 0,00 | 1.398 | -10,28 | ||||
| 2026-02-12 | 13F | Pitcairn Co | 0 | -100,00 | 0 | |||||
| 2026-02-10 | 13F/A | Northwestern Mutual Wealth Management Co | 3.226 | -4,75 | 50 | 2,04 | ||||
| 2026-02-17 | 13F | Blair William & Co/il | 10.011 | 156 | ||||||
| 2026-01-16 | 13F | Empirical Financial Services, LLC d.b.a. Empirical Wealth Management | 46.862 | -3,69 | 731 | 2,53 | ||||
| 2026-02-12 | 13F | Federated Hermes, Inc. | 376.863 | -5,40 | 5.875 | 0,74 | ||||
| 2026-02-11 | 13F | FLC Capital Advisors | 0 | -100,00 | 0 | |||||
| 2026-02-13 | 13F | Rhumbline Advisers | 117.636 | 95,47 | 1.834 | 108,06 | ||||
| 2026-02-12 | 13F | BRYN MAWR TRUST Co | 326 | -87,70 | 5 | -86,84 | ||||
| 2026-02-13 | 13F | Gts Securities Llc | 13.481 | 210 | ||||||
| 2026-03-11 | 13F | Larry Mathis Financial Planning, LLC | 14.343 | 224 | ||||||
| 2026-02-12 | 13F | Advisors Asset Management, Inc. | 24.484 | -42,29 | 382 | -38,65 | ||||
| 2026-02-06 | 13F | Pzena Investment Management Llc | 20.627 | 322 | ||||||
| 2026-02-06 | 13F | Bare Financial Services, Inc | 230 | -57,09 | 4 | -57,14 | ||||
| 2026-02-17 | 13F | Cetera Investment Advisers | 208.922 | -2,01 | 3.257 | 4,36 | ||||
| 2026-01-23 | 13F | Ritholtz Wealth Management | 23.852 | -59,68 | 372 | -57,16 | ||||
| 2025-10-30 | 13F | Twin Peaks Wealth Advisors, LLC | 0 | -100,00 | 0 | -100,00 | ||||
| 2026-01-20 | 13F | Independence Bank of Kentucky | 201 | 3 | ||||||
| 2026-01-16 | 13F | PFS Partners, LLC | 227 | 0,00 | 4 | 0,00 | ||||
| 2026-02-12 | 13F | Quadrant Capital Group Llc | 81.018 | 69,55 | 1.263 | 80,69 | ||||
| 2026-02-17 | 13F | Advisor Group Holdings, Inc. | 13.967 | -32,99 | 218 | -29,32 | ||||
| 2026-01-15 | 13F | Trust Co | 64 | 1 | ||||||
| 2026-02-17 | 13F | Signature Equity Partners, LLC | 344 | 5 | ||||||
| 2025-11-05 | 13F | Concord Wealth Partners | 0 | -100,00 | 0 | |||||
| 2026-01-30 | 13F | Archer Investment Corp | 147 | -50,51 | 2 | -50,00 | ||||
| 2026-02-10 | 13F | Dynasty Wealth Management, Llc | 0 | -100,00 | 0 | |||||
| 2026-03-03 | 13F/A | Caitong International Asset Management Co., Ltd | 43 | -94,20 | 1 | -100,00 | ||||
| 2025-11-13 | 13F | Promus Capital, LLC | 0 | 0 | ||||||
| 2026-02-04 | 13F | Beverly Hills Private Wealth, LLC | 21.772 | 0,00 | 319 | 0,00 | ||||
| 2026-01-20 | 13F | Trust Co Of Toledo Na /oh/ | 376 | 0,00 | 6 | 0,00 | ||||
| 2026-02-17 | 13F | Wiley Bros.-aintree Capital, Llc | 28.629 | 9,79 | 446 | 17,06 | ||||
| 2026-01-27 | 13F | Evergreen Capital Management Llc | 53.976 | -11,82 | 841 | -6,14 | ||||
| 2026-02-12 | 13F | New York State Common Retirement Fund | 11.757 | 183 | ||||||
| 2026-02-24 | 13F | Bell Investment Advisors, Inc | 370 | 32,14 | 6 | 25,00 | ||||
| 2026-02-13 | 13F | Wells Fargo & Company/mn | 1.060.461 | 2,53 | 16.533 | 9,19 | ||||
| 2026-02-13 | 13F | Charles Schwab Investment Management Inc | 413.692 | 7,24 | 6.449 | 14,20 | ||||
| 2025-11-14 | 13F | Susquehanna International Group, Llp | Put | 0 | -100,00 | 0 | -100,00 | |||
| 2026-01-21 | 13F | Naviter Wealth, LLC | 40.408 | -16,02 | 630 | -10,65 | ||||
| 2026-02-09 | 13F | Annis Gardner Whiting Capital Advisors, LLC | 1.124 | 18 | ||||||
| 2026-01-05 | 13F | Park Avenue Securities Llc | 37.684 | 14,12 | 1 | |||||
| 2026-02-11 | 13F | Nemes Rush Group LLC | 169 | 3 | ||||||
| 2026-01-21 | 13F | Yousif Capital Management, Llc | 32.394 | 0,00 | 523 | 10,34 | ||||
| 2026-02-04 | 13F | Valeo Financial Advisors, LLC | 11.220 | 5,97 | 175 | 12,26 |
Other Listings
| DE:TKDA | 15,30 € |