Grundlæggende statistik
| Institutionelle aktier (lange) | 95.563.398 - 90,63% (ex 13D/G) - change of -21,16MM shares -18,11% MRQ |
| Institutionel værdi (lang) | $ 3.766.048 USD ($1000) |
Institutionelt ejerskab og aktionærer
Silgan Holdings Inc. (US:SLGN) har 333 institutionelle ejere og aktionærer, der har indsendt 13D/G- eller 13F-formularer til Securities Exchange Commission (SEC). Disse institutioner har i alt 95,563,398 aktier. Største aktionærer omfatter Fmr Llc, Jpmorgan Chase & Co, Vanguard Group Inc, BlackRock, Inc., Dimensional Fund Advisors Lp, State Street Corp, Fuller & Thaler Asset Management, Inc., Bank Of America Corp /de/, Invesco Ltd., and Morgan Stanley .
Silgan Holdings Inc. (NYSE:SLGN) institutionel ejerskabsstruktur viser aktuelle positioner i virksomheden efter institutioner og fonde, samt seneste ændringer i positionsstørrelse. Større aktionærer kan omfatte individuelle investorer, investeringsforeninger, hedgefonde eller institutioner. Skema 13D angiver, at investoren besidder (eller besidder) mere end 5 % af virksomheden og har til hensigt (eller har til hensigt at) aktivt at forfølge en ændring i forretningsstrategi. Skema 13G indikerer en passiv investering på over 5%.
The share price as of April 17, 2026 is 41,99 / share. Previously, on April 21, 2025, the share price was 48,82 / share. This represents a decline of 13,99% over that period.

Fondens stemningsscore
Fund Sentiment Score (fka Ownership Accumulation Score) finder de aktier, der bliver mest købt af fonde. Det er resultatet af en sofistikeret, multi-faktor kvantitativ model, der identificerer virksomheder med de højeste niveauer af institutionel akkumulering. Scoringsmodellen bruger en kombination af den samlede stigning i oplyste ejere, ændringerne i porteføljeallokeringer i disse ejere og andre målinger. Tallet går fra 0 til 100, hvor højere tal indikerer et højere niveau af akkumulering for sine jævnaldrende, og 50 er gennemsnittet.
Opdateringsfrekvens: Dagligt
Se Ownership Explorer, som giver en liste over højest rangerende virksomheder.
AI+ Ask Fintel’s AI assistant about Silgan Holdings Inc..
Select a question to share a public post with an AI-crafted answer.
Thinking of good questions…
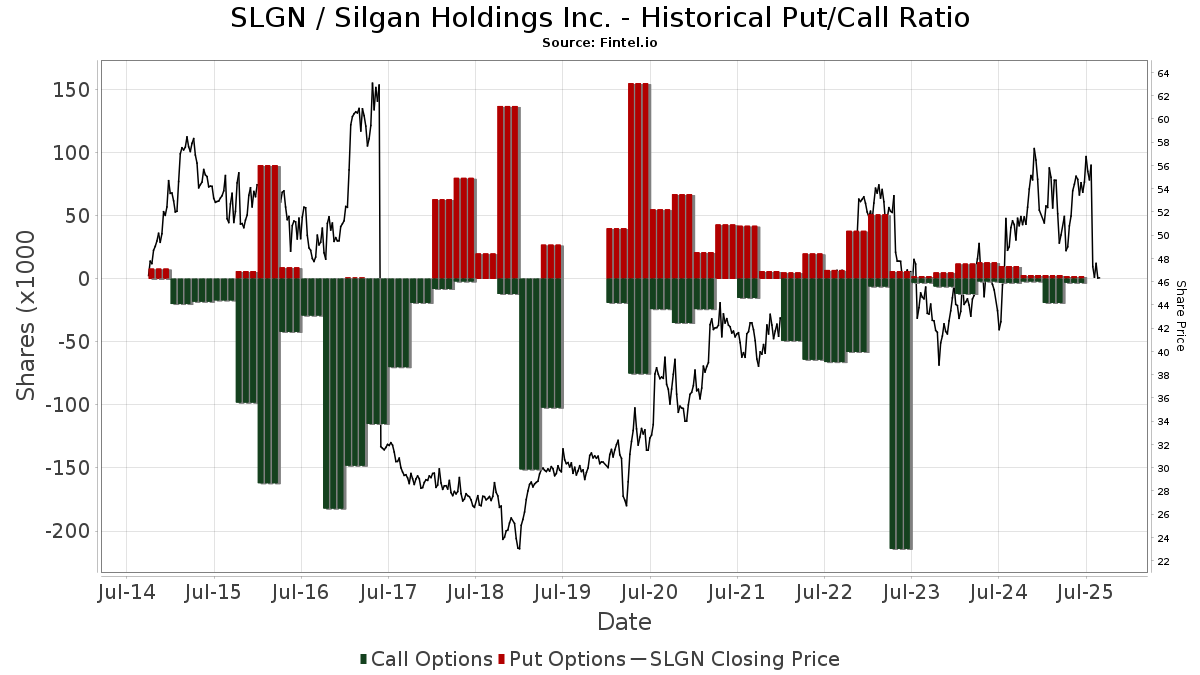
Institutionel Put/Call-forhold
Ud over at indberette standardaktie- og gældsudstedelser skal institutter med mere end 100 mill. aktiver under forvaltning også oplyse deres put- og call-optionsbeholdninger. Da salgsoptioner generelt indikerer negativ stemning, og købsoptioner indikerer positiv stemning, kan vi få en fornemmelse af den overordnede institutionelle stemning ved at plotte forholdet mellem put og kald. Diagrammet til højre viser det historiske put/call-forhold for dette instrument.
Brug af Put/Call Ratio som en indikator for investorernes stemning overvinder en af de vigtigste mangler ved at bruge totalt institutionelt ejerskab, som er, at en betydelig mængde af aktiver under forvaltning investeres passivt for at spore indekser. Passivt forvaltede fonde køber typisk ikke optioner, så indikatoren for put/call-forholdet følger mere nøje følelsen af aktivt forvaltede fonde.
13D/G-arkivering
Vi præsenterer 13D/G ansøgninger separat fra 13F ansøgninger på grund af den forskellige behandling af SEC. 13D/G-ansøgninger kan indgives af grupper af investorer (med én ledende), hvorimod 13F-ansøgninger ikke kan. Dette resulterer i situationer, hvor en investor kan indsende en 13D/G, der rapporterer én værdi for de samlede aktier (der repræsenterer alle de aktier, der ejes af investorgruppen), men derefter indsender en 13F, der rapporterer en anden værdi for de samlede aktier (der udelukkende repræsenterer deres egne) ejendomsret). Det betyder, at aktieejerskab af 13D/G-arkiver og 13F-arkiveringer ofte ikke er direkte sammenlignelige, så vi præsenterer dem separat.
Bemærk: Fra den 16. maj 2021 viser vi ikke længere ejere, der ikke har indsendt en 13D/G inden for det seneste år. Tidligere viste vi den fulde historie af 13D/G-arkiver. Generelt skal enheder, der er forpligtet til at indgive 13D/G-ansøgninger, indgive mindst årligt, før de indsender en afsluttende ansøgning. Dog forlader fonde nogle gange positioner uden at indsende en afsluttende ansøgning (dvs. de afvikler), så visning af den fulde historie resulterede nogle gange i forvirring om det nuværende ejerskab. For at undgå forvirring viser vi nu kun 'aktuelle' ejere - det vil sige - ejere, der har anmeldt inden for det seneste år.
Upgrade to unlock premium data.
| Fil dato | Form | Investor | Forrige Aktier |
Seneste Aktier |
Δ Aktier (Procent) |
Ejendomsret (Procent) |
Δ Ejerskab (Procent) |
|
|---|---|---|---|---|---|---|---|---|
| 2026-03-27 | VANGUARD GROUP INC | 8,545,772 | 0 | -100.00 | 0.00 | -100.00 | ||
| 2026-02-10 | WELLINGTON MANAGEMENT GROUP LLP | 5,604,993 | 213,738 | -96.19 | 0.20 | -96.15 | ||
| 2026-02-05 | FMR LLC | 14,029,917 | 15,850,200 | 12.97 | 15.00 | 14.50 | ||
| 2026-01-30 | SILVER R PHILIP | 10,105,685 | 8,935,545 | -11.58 | 8.50 | -10.53 | ||
| 2026-01-23 | JPMORGAN CHASE & CO | 7,597,335 | 9,274,096 | 22.07 | 8.70 | 22.54 | ||
| 2025-05-09 | HORRIGAN D GREG | 7,417,312 | 7,043,303 | -5.04 | 6.60 | -4.35 |
13F og NPORT arkivering
Detaljer om 13F-arkivering er gratis. Detaljer om NP-ansøgninger kræver et premium-medlemskab. Grønne rækker angiver nye positioner. Røde rækker angiver lukkede positioner. Klik på linket ikon for at se den fulde transaktionshistorik.
Opgrader
for at låse premium-data op og eksportere til Excel ![]() .
.
| Fil dato | Kilde | Investor | Type | Gennemsnitlig pris (Øst) |
Aktier | Δ Aktier (%) |
Rapporteret Værdi ($1000) |
Δ Værdi (%) |
Port Alloc (%) |
|
|---|---|---|---|---|---|---|---|---|---|---|
| 2026-02-12 | 13F | Dimensional Fund Advisors Lp | 4.387.955 | 17,31 | 177.144 | 10,11 | ||||
| 2026-02-04 | 13F | Independent Advisor Alliance | 31.799 | -0,45 | 1.284 | -6,55 | ||||
| 2026-02-18 | 13F | Mackenzie Financial Corp | 0 | -100,00 | 0 | |||||
| 2026-02-17 | 13F | Creative Planning | 14.508 | 33,41 | 586 | 25,27 | ||||
| 2026-01-29 | 13F | Pictet Asset Management Holding SA | 12.807 | 10,91 | 517 | 4,23 | ||||
| 2026-02-13 | 13F | Parkside Financial Bank & Trust | 122 | -14,08 | 5 | -33,33 | ||||
| 2026-04-17 | 13F | CENTRAL TRUST Co | 134 | 0,00 | 5 | 0,00 | ||||
| 2026-02-10 | 13F | Continuum Advisory, LLC | 0 | -100,00 | 0 | |||||
| 2026-02-12 | 13F | Bank Of Montreal /can/ | 10.360 | 7,76 | 418 | 1,21 | ||||
| 2026-02-17 | 13F | Jones Financial Companies Lllp | 1.844 | 20,29 | 74 | 13,85 | ||||
| 2026-01-30 | 13F | Us Bancorp \de\ | 2.909 | -9,24 | 117 | -14,60 | ||||
| 2026-02-17 | 13F | Public Employees Retirement System Of Ohio | 143.961 | 18,62 | 5.812 | 11,34 | ||||
| 2026-04-15 | 13F | Bayforest Capital Ltd | 4.888 | 190 | ||||||
| 2026-02-13 | 13F | Edgestream Partners, L.P. | 0 | -100,00 | 0 | |||||
| 2026-04-15 | 13F | Ai Financial Services Llc | 17.480 | -4,05 | 678 | -7,76 | ||||
| 2026-02-12 | 13F | Nuveen, LLC | 127.862 | 0,00 | 5.162 | -6,15 | ||||
| 2025-11-14 | 13F | Petrus Trust Company, LTA | 0 | -100,00 | 0 | |||||
| 2026-04-02 | 13F | Ares Financial Consulting, LLC | 75 | 0,00 | 3 | -33,33 | ||||
| 2026-02-17 | 13F | Alliancebernstein L.p. | 241.401 | 14,30 | 9.745 | 7,29 | ||||
| 2026-02-13 | 13F | Macquarie Group Ltd | 0 | -100,00 | 0 | |||||
| 2026-02-13 | 13F | Johnson Investment Counsel Inc | 0 | -100,00 | 0 | |||||
| 2026-02-17 | 13F | Farringdon Capital, Ltd. | 5.107 | 206 | ||||||
| 2026-01-26 | 13F | Private Trust Co Na | 250 | 16,82 | 10 | 11,11 | ||||
| 2026-02-13 | 13F | Marshall Wace, Llp | 284.556 | 11.488 | ||||||
| 2026-02-17 | 13F | Schonfeld Strategic Advisors LLC | 0 | -100,00 | 0 | |||||
| 2026-01-30 | 13F | Skylands Capital, LLC | 42.900 | 12,45 | 1.732 | 5,55 | ||||
| 2026-02-05 | 13F | Gamco Investors, Inc. Et Al | 8.335 | 336 | ||||||
| 2025-11-14 | 13F | Bridgefront Capital, LLC | 0 | -100,00 | 0 | -100,00 | ||||
| 2026-02-13 | 13F | Victory Capital Management Inc | 1.642.946 | 7,80 | 66.326 | 1,19 | ||||
| 2026-02-13 | 13F | State Street Corp | 3.654.618 | -0,98 | 147.537 | -7,06 | ||||
| 2026-02-17 | 13F | Man Group plc | 51.936 | -49,14 | 2.097 | -52,27 | ||||
| 2026-02-09 | 13F | Hartland & Co., LLC | 300 | 300,00 | 12 | 300,00 | ||||
| 2026-02-10 | 13F | Root Financial Partners, LLC | 146 | -30,48 | 6 | -44,44 | ||||
| 2026-04-08 | 13F | Wealth Enhancement Advisory Services, Llc | 6.761 | -23,43 | 267 | -28,11 | ||||
| 2026-02-17 | 13F | Northern Trust Corp | 848.365 | -3,03 | 34.248 | -8,98 | ||||
| 2025-11-12 | 13F | Elo Mutual Pension Insurance Co | 0 | -100,00 | 0 | |||||
| 2026-02-03 | 13F | Ethic Inc. | 0 | -100,00 | 0 | -100,00 | ||||
| 2026-02-06 | 13F | EverSource Wealth Advisors, LLC | 485 | -25,73 | 20 | -32,14 | ||||
| 2026-02-17 | 13F | Occudo Quantitative Strategies Lp | 0 | -100,00 | 0 | |||||
| 2026-01-21 | 13F | Capital Advisors, Ltd. LLC | 0 | -100,00 | 0 | |||||
| 2026-02-11 | 13F | Clearbridge Investments, LLC | 229.863 | -74,36 | 9.280 | -75,94 | ||||
| 2026-02-17 | 13F | Quantinno Capital Management LP | 155.856 | 128,10 | 6.292 | 114,13 | ||||
| 2025-11-13 | 13F | Hsbc Holdings Plc | 0 | -100,00 | 0 | -100,00 | ||||
| 2026-02-09 | 13F | Nicola Wealth Management Ltd. | 136.900 | 29,27 | 5.527 | 21,34 | ||||
| 2026-01-23 | 13F | Burney Co/ | 36.748 | -4,66 | 1.484 | -10,50 | ||||
| 2026-02-17 | 13F | Sapience Investments, LLC | 13.230 | 25,66 | 534 | 18,14 | ||||
| 2026-02-09 | 13F | Hantz Financial Services, Inc. | 4.781 | 225,46 | 0 | |||||
| 2026-02-17 | 13F | Aquatic Capital Management LLC | 20.680 | 202,78 | 835 | 184,64 | ||||
| 2026-02-17 | 13F | Jain Global LLC | 9.442 | -81,32 | 381 | -82,47 | ||||
| 2026-02-17 | 13F | Advisory Services Network, LLC | 0 | -100,00 | 0 | |||||
| 2026-02-12 | 13F | Campbell & CO Investment Adviser LLC | 68.560 | 859,55 | 2.768 | 801,30 | ||||
| 2026-02-19 | 13F | CI Private Wealth, LLC | 11.271 | 101,84 | 456 | 90,00 | ||||
| 2026-01-21 | 13F | Oak Thistle LLC | 0 | -100,00 | 0 | |||||
| 2026-02-17 | 13F | Summit Trail Advisors, Llc | 41.628 | 63,20 | 1.681 | 53,14 | ||||
| 2026-01-20 | 13F | Aspiriant, Llc | 23.153 | 0,11 | 935 | -6,04 | ||||
| 2026-02-11 | 13F | Los Angeles Capital Management Llc | 400 | 15 | ||||||
| 2026-02-17 | 13F | Orbis Allan Gray Ltd | 888.720 | 35.878 | ||||||
| 2025-10-28 | 13F | American Capital Advisory, LLC | 0 | -100,00 | 0 | |||||
| 2026-01-30 | 13F | Turning Point Benefit Group, Inc. | 37 | 1 | ||||||
| 2026-02-02 | 13F | Montag A & Associates Inc | 36 | -14,29 | 1 | 0,00 | ||||
| 2026-02-17 | 13F | Atom Investors LP | 29.644 | 1.197 | ||||||
| 2026-02-04 | 13F | LRI Investments, LLC | 472 | 216,78 | 19 | 216,67 | ||||
| 2026-02-13 | 13F | Squarepoint Ops LLC | 83.529 | 1.441,41 | 3.372 | 1.347,21 | ||||
| 2026-02-13 | 13F | Commerce Bank | 13.660 | -1,68 | 551 | -7,71 | ||||
| 2026-02-09 | 13F | Royce & Associates Lp | 755.611 | 6,59 | 30.504 | 0,05 | ||||
| 2026-02-09 | 13F | Jefferies Financial Group Inc. | 5.046 | 204 | ||||||
| 2026-02-12 | 13F | Fuller & Thaler Asset Management, Inc. | 3.400.088 | 177,32 | 137.262 | 160,30 | ||||
| 2026-01-28 | 13F | M&t Bank Corp | Call | 410 | 1 | |||||
| 2026-02-02 | 13F | Strs Ohio | 2.116 | 0,14 | 85 | -5,56 | ||||
| 2026-02-11 | 13F | Group One Trading, L.p. | 46 | 2 | ||||||
| 2026-02-17 | 13F | Aristotle Capital Boston, LLC | 580.668 | -8,65 | 23.442 | -14,25 | ||||
| 2026-04-20 | 13F | State of Alaska, Department of Revenue | 148.198 | -48,46 | 6 | -54,55 | ||||
| 2026-02-13 | 13F | Arrowstreet Capital, Limited Partnership | 167.431 | 6.759 | ||||||
| 2026-02-13 | 13F | Ubs Asset Management Americas Inc | 187.048 | -8,67 | 7.551 | -14,27 | ||||
| 2026-02-13 | 13F | Treasurer of the State of North Carolina | 37.012 | -6,81 | 1 | 0,00 | ||||
| 2026-02-17 | 13F | Weiss Asset Management LP | 53.108 | -62,49 | 2.144 | -72,06 | ||||
| 2025-11-13 | 13F | Chesapeake Capital Corp /il/ | 0 | -100,00 | 0 | |||||
| 2025-11-14 | 13F | Tudor Investment Corp Et Al | 0 | -100,00 | 0 | |||||
| 2026-02-09 | 13F | Legal & General Group Plc | 141.241 | -2,78 | 5.702 | -8,75 | ||||
| 2025-11-14 | 13F | Federation des caisses Desjardins du Quebec | 0 | -100,00 | 0 | |||||
| 2026-02-23 | 13F | Mv Capital Management, Inc. | 11 | 1.000,00 | 0 | |||||
| 2026-02-13 | 13F | Inspire Advisors, LLC | 5.123 | 4,51 | 207 | -1,90 | ||||
| 2026-02-13 | 13F | First Trust Advisors Lp | 307.988 | 2,61 | 12.434 | -3,69 | ||||
| 2026-04-06 | 13F | GAMMA Investing LLC | 5.112 | 64,69 | 198 | 58,40 | ||||
| 2026-04-07 | 13F | Central Pacific Bank - Trust Division | 3.600 | 5,26 | 140 | 0,72 | ||||
| 2026-01-30 | 13F | State of New Jersey Common Pension Fund D | 56.879 | 23,67 | 2.296 | 16,08 | ||||
| 2026-04-07 | 13F | Retirement Wealth Solutions LLC | 82 | -48,43 | 3 | -50,00 | ||||
| 2026-02-05 | 13F | HFM Investment Advisors, LLC | 5 | 0,00 | 0 | |||||
| 2026-02-12 | 13F | Sit Investment Associates Inc | 0 | -100,00 | 0 | |||||
| 2026-02-13 | 13F | BNP Paribas Asset Management Holding S.A. | 813 | 20,80 | 0 | |||||
| 2026-01-28 | 13F | Universal- Beteiligungs- und Servicegesellschaft mbH | 20.714 | -55,91 | 836 | -58,61 | ||||
| 2026-04-13 | 13F | IFP Advisors, Inc | 0 | -100,00 | 0 | |||||
| 2026-02-17 | 13F | D. E. Shaw & Co., Inc. | 14.696 | 593 | ||||||
| 2026-02-17 | 13F | XTX Topco Ltd | 6.154 | -66,02 | 248 | -68,12 | ||||
| 2025-11-13 | 13F | Glenmede Investment Management, LP | 280.898 | -5,58 | 12.081 | -25,05 | ||||
| 2026-02-12 | 13F | Renaissance Technologies Llc | 0 | -100,00 | 0 | |||||
| 2025-11-13 | 13F | Mark Sheptoff Financial Planning, Llc | 0 | -100,00 | 0 | |||||
| 2026-02-17 | 13F/A | RBF Capital, LLC | 159.671 | 356,20 | 6.446 | 328,24 | ||||
| 2026-02-17 | 13F | Sciencast Management LP | 37.462 | 1.512 | ||||||
| 2026-01-30 | 13F | Torren Management, LLC | 288 | 12 | ||||||
| 2026-01-15 | 13F | Nisa Investment Advisors, Llc | 116 | -2,52 | 5 | -20,00 | ||||
| 2025-11-14 | 13F | Point72 Europe (London) LLP | 320 | 14 | ||||||
| 2026-02-10 | 13F | AdvisorShares Investments LLC | 0 | -100,00 | 0 | -100,00 | ||||
| 2026-02-11 | 13F | O'shaughnessy Asset Management, Llc | 9.914 | -69,80 | 400 | -71,65 | ||||
| 2026-02-17 | 13F | Artisan Partners Limited Partnership | 870.049 | 35.124 | ||||||
| 2026-02-11 | 13F | Manchester Capital Management LLC | 60 | 2 | ||||||
| 2026-02-13 | 13F | Public Employees Retirement Association Of Colorado | 10.326 | 0,00 | 0 | |||||
| 2026-02-13 | 13F | Mml Investors Services, Llc | 7.745 | -6,06 | 313 | -11,86 | ||||
| 2025-11-14 | 13F | Zurich Insurance Group Ltd/FI | 0 | -100,00 | 0 | |||||
| 2026-04-08 | 13F | Arlington Trust Co LLC | 225 | 9 | ||||||
| 2026-02-06 | 13F | Global Retirement Partners, LLC | 1.621 | 762,23 | 65 | 712,50 | ||||
| 2026-02-17 | 13F | Oddo Bhf Asset Management Sas | 0 | -100,00 | 0 | -100,00 | ||||
| 2026-02-10 | 13F | Ritter Daniher Financial Advisory LLC / DE | 0 | -100,00 | 0 | |||||
| 2026-02-17 | 13F | Boreal Capital Management LLC | 110 | 0,00 | 4 | 0,00 | ||||
| 2026-02-13 | 13F | Charles Schwab Investment Management Inc | 1.041.984 | 3,38 | 42.065 | -2,96 | ||||
| 2026-02-05 | 13F | Dana Investment Advisors, Inc. | 90.617 | 23,33 | 3.658 | 15,76 | ||||
| 2025-11-14 | 13F | ISAM Funds (UK) Ltd | 0 | -100,00 | 0 | |||||
| 2026-02-17 | 13F | Ancora Advisors, LLC | 7.264 | -32,89 | 293 | -36,99 | ||||
| 2025-11-13 | 13F | CLARET ASSET MANAGEMENT Corp | 0 | -100,00 | 0 | |||||
| 2026-02-17 | 13F | Hancock Whitney Corp | 15.236 | -49,33 | 615 | -52,44 | ||||
| 2025-11-17 | 13F | PharVision Advisers, LLC | 0 | -100,00 | 0 | |||||
| 2026-02-11 | 13F | Group One Trading, L.p. | Call | 0 | -100,00 | 0 | -100,00 | |||
| 2026-01-06 | 13F | RDA Financial Network | 0 | -100,00 | 0 | -100,00 | ||||
| 2026-02-17 | 13F | Balyasny Asset Management Llc | 232.826 | -48,23 | 9.399 | -51,41 | ||||
| 2026-02-12 | 13F | JPL Wealth Management, LLC | 0 | -100,00 | 0 | |||||
| 2026-02-18 | 13F | Vident Advisory, LLC | 0 | -100,00 | 0 | |||||
| 2026-01-15 | 13F | Allspring Global Investments Holdings, LLC | 1.968.534 | -20,44 | 81.202 | -23,80 | ||||
| 2026-02-05 | 13F | Elyxium Wealth, LLC | 40 | 2 | ||||||
| 2026-02-13 | 13F | Neo Ivy Capital Management | 0 | -100,00 | 0 | |||||
| 2026-02-11 | 13F | Jpmorgan Chase & Co | 9.274.095 | 22,07 | 374.395 | 14,58 | ||||
| 2026-02-11 | 13F | J.Safra Asset Management Corp | 64 | 3 | ||||||
| 2026-01-15 | 13F | Retirement Systems of Alabama | 105.260 | -1,97 | 4.249 | -7,97 | ||||
| 2026-02-17 | 13F | SummitTX Capital, L.P. | 48.092 | 193,01 | 1.941 | 175,32 | ||||
| 2026-02-13 | 13F | Kennedy Capital Management, Inc. | 0 | -100,00 | 0 | |||||
| 2026-01-07 | 13F | Harbor Investment Advisory, Llc | 242 | 10 | ||||||
| 2026-02-12 | 13F | Steward Partners Investment Advisory, Llc | 61 | -63,25 | 2 | -71,43 | ||||
| 2026-04-07 | 13F | Farther Finance Advisors, LLC | 276 | 102,94 | 11 | 100,00 | ||||
| 2026-02-09 | 13F | Quest Partners LLC | 5.281 | -62,60 | 213 | -64,91 | ||||
| 2025-11-07 | 13F | Synovus Financial Corp | 32.282 | 1,15 | 1.388 | -19,72 | ||||
| 2026-02-02 | 13F | Oppenheimer & Co Inc | 6.880 | 0,00 | 278 | -6,10 | ||||
| 2026-02-09 | 13F | Keating Financial Advisory Services, Inc. | 600 | 24 | ||||||
| 2026-02-06 | 13F | Pnc Financial Services Group, Inc. | 7.711 | -22,76 | 311 | -27,51 | ||||
| 2026-02-17 | 13F | Numerai GP LLC | 7.615 | 307 | ||||||
| 2026-01-09 | 13F | Park Place Capital Corp | 0 | -100,00 | 0 | |||||
| 2025-11-14 | 13F | Walleye Capital LLC | 0 | -100,00 | 0 | |||||
| 2025-11-14 | 13F | Walleye Capital LLC | Put | 0 | -100,00 | 0 | ||||
| 2025-11-07 | 13F | Shell Asset Management Co | 954 | -59,85 | 0 | |||||
| 2026-04-14 | 13F | Zrc Wealth Management, Llc | 50 | 2 | ||||||
| 2026-02-17 | 13F | Captrust Financial Advisors | 0 | -100,00 | 0 | -100,00 | ||||
| 2026-02-11 | 13F | LPL Financial LLC | 22.638 | -6,77 | 914 | -12,55 | ||||
| 2026-02-13 | 13F | Quarry LP | 0 | -100,00 | 0 | |||||
| 2026-02-17 | 13F | Delaware Management Holdings, Inc. | 845.391 | 34.128 | ||||||
| 2026-04-17 | 13F | Leeward Investments, LLC - MA | 271.586 | -2,60 | 10.538 | -6,39 | ||||
| 2026-02-10 | 13F | Lido Advisors, LLC | 8.536 | 0,16 | 367 | 0,00 | ||||
| 2026-02-17 | 13F | California State Teachers Retirement System | 87.328 | 1,59 | 3.525 | -4,65 | ||||
| 2026-01-14 | 13F | Jfs Wealth Advisors, Llc | 88 | 12,82 | 4 | 0,00 | ||||
| 2026-02-17 | 13F | Frontier Capital Management Co Llc | 895.925 | 9,91 | 36.168 | 3,16 | ||||
| 2025-11-14 | 13F | Gotham Asset Management, LLC | 0 | -100,00 | 0 | |||||
| 2026-02-17 | 13F | Twinbeech Capital Lp | 5.500 | 222 | ||||||
| 2026-02-17 | 13F | Price T Rowe Associates Inc /md/ | 73.047 | 17,81 | 3 | 0,00 | ||||
| 2026-02-10 | 13F | Rothschild Investment Llc | 62 | 3 | ||||||
| 2026-02-13 | 13F | Fairman Group, LLC | 114 | 5 | ||||||
| 2025-11-12 | 13F | Group One Trading, L.p. | Put | 0 | -100,00 | 0 | -100,00 | |||
| 2026-02-13 | 13F | Brown Advisory Inc | 14.287 | 7,35 | 577 | 0,70 | ||||
| 2026-01-26 | 13F | Whittier Trust Co Of Nevada Inc | 0 | -100,00 | 0 | |||||
| 2026-02-11 | 13F | Hughes Financial Services, LLC | 4 | 0 | ||||||
| 2026-02-11 | 13F | Hilton Head Capital Partners, LLC | 512 | 21 | ||||||
| 2026-01-28 | 13F | WPG Advisers, LLC | 112 | 0,00 | 5 | 0,00 | ||||
| 2026-02-12 | 13F | Hohimer Wealth Management, Llc | 0 | -100,00 | 0 | |||||
| 2026-02-03 | 13F | Manning & Napier Advisors Llc | 22 | 1 | ||||||
| 2026-02-09 | 13F | William Blair Investment Management, Llc | 666.415 | 11,48 | 26.903 | 4,64 | ||||
| 2026-02-05 | 13F | High Note Wealth, LLC | 119 | 5 | ||||||
| 2026-02-12 | 13F | Ci Investments Inc. | 0 | -100,00 | 0 | |||||
| 2026-02-02 | 13F | Qrg Capital Management, Inc. | 20.983 | -10,72 | 847 | -16,14 | ||||
| 2026-02-18 | 13F | First Citizens Bank & Trust Co | 11.156 | 1,36 | 450 | -4,86 | ||||
| 2026-02-17 | 13F | Dean Investment Associates, Llc | 0 | -100,00 | 0 | |||||
| 2026-02-11 | 13F | Deutsche Bank Ag\ | 44.341 | 323,14 | 1.790 | 297,78 | ||||
| 2025-11-14 | 13F | Bank Of Nova Scotia | 0 | -100,00 | 0 | |||||
| 2026-02-13 | 13F | Transamerica Financial Advisors, Inc. | 2 | 0 | ||||||
| 2026-02-17 | 13F | Russell Investments Group, Ltd. | 204.526 | -11,22 | 8.258 | -16,66 | ||||
| 2026-02-13 | 13F | OMERS ADMINISTRATION Corp | 0 | -100,00 | 0 | |||||
| 2026-02-13 | 13F | Caitong International Asset Management Co., Ltd | 0 | -100,00 | 0 | |||||
| 2025-11-14 | 13F | Strategic Wealth Partners, Ltd. | 300 | 13 | ||||||
| 2025-10-22 | 13F | Geneos Wealth Management Inc. | 0 | -100,00 | 0 | -100,00 | ||||
| 2026-01-29 | 13F | UBS Group AG | 1.226.566 | -24,71 | 49.516 | -29,33 | ||||
| 2026-01-29 | 13F | Dunhill Financial, LLC | 2 | 0 | ||||||
| 2026-01-21 | 13F | Signature Resources Capital Management, LLC | 8 | 0 | ||||||
| 2026-02-13 | 13F | Wells Fargo & Company/mn | 94.385 | -1,57 | 3.810 | -7,61 | ||||
| 2026-04-09 | 13F | Moody National Bank Trust Division | 7.851 | -55,35 | 305 | -57,12 | ||||
| 2026-02-12 | 13F | CIBC Private Wealth Group, LLC | 798 | 12,87 | 32 | 6,67 | ||||
| 2026-01-27 | 13F | GHP Investment Advisors, Inc. | 120.906 | -5,51 | 4.881 | -11,32 | ||||
| 2026-02-10 | 13F | Commonwealth Of Pennsylvania Public School Empls Retrmt Sys | 21.947 | -3,70 | 886 | -9,59 | ||||
| 2026-02-06 | 13F | Larson Financial Group LLC | 361 | -1,90 | 15 | -6,67 | ||||
| 2026-02-11 | 13F | EULAV Asset Management | 0 | -100,00 | 0 | |||||
| 2026-02-17 | 13F | Optiver Holding B.V. | 0 | -100,00 | 0 | |||||
| 2026-01-21 | 13F | SJS Investment Consulting Inc. | 3 | -72,73 | 0 | |||||
| 2026-02-04 | 13F | Oregon Public Employees Retirement Fund | 17.553 | -1,68 | 709 | -7,69 | ||||
| 2026-02-12 | 13F | California Public Employees Retirement System | 205.688 | -16,08 | 8.304 | -21,23 | ||||
| 2025-10-29 | 13F | Maryland State Retirement & Pension System | 0 | -100,00 | 0 | |||||
| 2026-02-17 | 13F | CastleKnight Management LP | 54.400 | 0,00 | 2.196 | -6,11 | ||||
| 2025-11-04 | 13F | Jackson Creek Investment Advisors LLC | 0 | -100,00 | 0 | |||||
| 2026-02-13 | 13F | Bridgewater Associates, LP | 0 | -100,00 | 0 | |||||
| 2026-02-13 | 13F | Barclays Plc | 68.468 | -31,77 | 2.764 | -35,96 | ||||
| 2025-11-14 | 13F | Texas Permanent School Fund | 0 | -100,00 | 0 | |||||
| 2026-02-03 | 13F | We Are One Seven, LLC | 5.081 | 205 | ||||||
| 2025-10-22 | 13F | Vaughan Nelson Investment Management, L.p. | 0 | -100,00 | 0 | -100,00 | ||||
| 2026-02-13 | 13F/A | Ontario Teachers Pension Plan Board | 0 | -100,00 | 0 | |||||
| 2026-01-22 | 13F | Massachusetts Financial Services Co /ma/ | 866.966 | 5,08 | 34.999 | -1,37 | ||||
| 2026-02-13 | 13F | Smartleaf Asset Management LLC | 800 | -23,00 | 33 | -27,27 | ||||
| 2026-02-03 | 13F | Bernzott Capital Advisors | 203.262 | 54,09 | 8.206 | 44,63 | ||||
| 2026-01-29 | 13F | Comerica Bank | 74.325 | 65,74 | 3.000 | 55,60 | ||||
| 2026-02-11 | 13F | GW&K Investment Management, LLC | 539.766 | 22 | ||||||
| 2026-02-13 | 13F | Y-Intercept (Hong Kong) Ltd | 17.494 | 706 | ||||||
| 2026-02-17 | 13F | Utah Retirement Systems | 0 | -100,00 | 0 | -100,00 | ||||
| 2025-11-20 | 13F | Wbi Investments, Inc. | 0 | -100,00 | 0 | |||||
| 2026-02-12 | 13F | EntryPoint Capital, LLC | 7.459 | 0,00 | 301 | -5,94 | ||||
| 2026-02-17 | 13F | Aster Capital Management (DIFC) Ltd | 7.703 | 71,25 | 311 | 60,62 | ||||
| 2026-02-10 | 13F | Envestnet Asset Management Inc | 59.926 | -27,43 | 2.419 | -31,88 | ||||
| 2025-10-24 | 13F | Forum Financial Management, LP | 0 | -100,00 | 0 | -100,00 | ||||
| 2026-02-17 | 13F | Raymond James Financial Inc | 278.284 | -23,03 | 11.283 | -27,44 | ||||
| 2026-04-07 | 13F | Signaturefd, Llc | 75 | -16,67 | 3 | -33,33 | ||||
| 2026-02-12 | 13F | Xponance, Inc. | 8.158 | -17,50 | 329 | -22,59 | ||||
| 2026-02-17 | 13F | Lazard Asset Management Llc | 0 | -100,00 | 0 | |||||
| 2026-04-16 | 13F | SG Americas Securities, LLC | 190.755 | -83,77 | 7 | -85,11 | ||||
| 2026-02-04 | 13F | Pacer Advisors, Inc. | 0 | -100,00 | 0 | -100,00 | ||||
| 2026-02-12 | 13F | Atlas FRM LLC | 170.000 | 6.863 | ||||||
| 2026-02-04 | 13F | Securian Asset Management, Inc | 6.391 | -3,89 | 258 | -9,79 | ||||
| 2025-10-30 | 13F | Twin Peaks Wealth Advisors, LLC | 0 | -100,00 | 0 | |||||
| 2026-02-17 | 13F | Buckland Partners Management Co LLC | 138.800 | 5.603 | ||||||
| 2026-02-17 | 13F | Millennium Management Llc | 641.585 | -33,28 | 25.901 | -37,37 | ||||
| 2026-02-17 | 13F | Voloridge Investment Management, Llc | 56.600 | -74,49 | 2.285 | -76,07 | ||||
| 2026-02-17 | 13F | Fmr Llc | 15.850.200 | 49,12 | 639.873 | 39,97 | ||||
| 2026-01-29 | 13F | Vanguard Group Inc | 8.680.399 | -2,77 | 350.428 | -8,74 | ||||
| 2026-01-27 | 13F | Financial Management Professionals, Inc. | 0 | -100,00 | 0 | |||||
| 2026-04-13 | 13F | Mather Group, Llc. | 50 | 2 | ||||||
| 2026-01-21 | 13F | Yousif Capital Management, Llc | 27.109 | -1,70 | 1.140 | -3,96 | ||||
| 2026-02-12 | 13F | South Dakota Investment Council | 12.300 | -8,89 | 0 | |||||
| 2026-02-17 | 13F | SageView Advisory Group, LLC | 205 | 8 | ||||||
| 2026-01-26 | 13F | KBC Group NV | 3.066 | 0,00 | 0 | |||||
| 2025-10-28 | 13F | Richardson Financial Services Inc. | 0 | -100,00 | 0 | |||||
| 2026-02-05 | 13F | Atria Investments Llc | 0 | -100,00 | 0 | |||||
| 2026-02-03 | 13F | Mitsubishi UFJ Kokusai Asset Management Co., Ltd. | 158 | 0,00 | 7 | 0,00 | ||||
| 2026-02-12 | 13F | Bank of Jackson Hole Trust | 0 | -100,00 | 0 | |||||
| 2026-02-10 | 13F | Mutual Of America Capital Management Llc | 36.500 | -11,00 | 1.474 | -16,45 | ||||
| 2026-02-09 | 13F | Huntington National Bank | 2.216 | 20,50 | 89 | 12,66 | ||||
| 2026-02-13 | 13F | Pathstone Holdings, LLC | 24.760 | 4,53 | 1.000 | -1,87 | ||||
| 2026-02-11 | 13F | Prestige Wealth Management Group LLC | 74 | 0,00 | 3 | -33,33 | ||||
| 2026-02-13 | 13F | Police & Firemen's Retirement System of New Jersey | 38.055 | -3,20 | 1.536 | -9,11 | ||||
| 2026-02-13 | 13F | Fiduciary Trust Co | 5.651 | -15,14 | 228 | -20,28 | ||||
| 2026-02-12 | 13F | Federated Hermes, Inc. | 3.916 | -15,95 | 158 | -21,00 | ||||
| 2026-02-13 | 13F | Stifel Financial Corp | 38.715 | -40,57 | 1.563 | -44,23 | ||||
| 2026-02-13 | 13F | Neuberger Berman Group LLC | 0 | -100,00 | 0 | -100,00 | ||||
| 2026-02-02 | 13F | Sachetta, LLC | 0 | -100,00 | 0 | |||||
| 2026-02-03 | 13F | Robeco Schweiz AG | 155.787 | -21,79 | 6.289 | -26,59 | ||||
| 2025-11-10 | 13F | Rosenberg Matthew Hamilton | 0 | -100,00 | 0 | |||||
| 2026-04-06 | 13F | Highline Wealth Partners Llc | 21 | 1 | ||||||
| 2026-02-05 | 13F | Bessemer Group Inc | 424 | -15,20 | 0 | |||||
| 2026-01-29 | 13F | Quent Capital, LLC | 564 | -50,26 | 23 | -54,17 | ||||
| 2026-02-17 | 13F | Royal Bank Of Canada | 22.059 | -31,17 | 891 | -35,34 | ||||
| 2026-01-27 | 13F | TD Waterhouse Canada Inc. | 100 | 0,00 | 4 | 0,00 | ||||
| 2026-02-13 | 13F | Pinnacle Wealth Planning Services, Inc. | 9 | 0 | ||||||
| 2026-01-28 | 13F | Klp Kapitalforvaltning As | 19.400 | -39,75 | 783 | -43,42 | ||||
| 2026-02-13 | 13F | SRS Capital Advisors, Inc. | 6.108 | -43,55 | 247 | -47,10 | ||||
| 2026-02-17 | 13F | Advisor Group Holdings, Inc. | 1.579 | -62,57 | 64 | -67,02 | ||||
| 2026-02-10 | 13F | CIBC World Markets Inc. | 21.141 | 853 | ||||||
| 2026-02-03 | 13F | Crossmark Global Holdings, Inc. | 6.378 | 2,52 | 257 | -3,75 | ||||
| 2026-02-10 | 13F | Daiwa Securities Group Inc. | 0 | -100,00 | 0 | |||||
| 2026-04-17 | 13F | Stephenson National Bank & Trust | 0 | -100,00 | 0 | |||||
| 2026-02-09 | 13F | Frazier Financial Advisors, LLC | 23 | 1 | ||||||
| 2025-11-14 | 13F | Brevan Howard Capital Management LP | 0 | -100,00 | 0 | |||||
| 2026-01-23 | 13F | Ritholtz Wealth Management | 7.613 | -65,58 | 307 | -67,72 | ||||
| 2026-02-13 | 13F | Morgan Stanley | 1.980.712 | 11,72 | 79.961 | 4,86 | ||||
| 2026-04-17 | 13F | Bell Investment Advisors, Inc | 0 | -100,00 | 0 | |||||
| 2026-02-12 | 13F | New York State Common Retirement Fund | 39.355 | -82,94 | 1.589 | -83,99 | ||||
| 2026-02-13 | 13F | Citigroup Inc | 18.987 | -91,67 | 767 | -92,19 | ||||
| 2026-02-12 | 13F | Penserra Capital Management LLC | 433 | -0,92 | 0 | |||||
| 2026-02-13 | 13F | MAI Capital Management | 21 | -40,00 | 1 | -100,00 | ||||
| 2026-02-17 | 13F | Dark Forest Capital Management Lp | 65.336 | -36,43 | 2.638 | -40,34 | ||||
| 2026-02-11 | 13F | Livforsakringsbolaget Skandia, Omsesidigt | 0 | -100,00 | 0 | |||||
| 2026-02-12 | 13F | Quadrant Capital Group Llc | 164 | -80,24 | 7 | -82,86 | ||||
| 2026-02-06 | 13F | Covestor Ltd | 206 | 0,98 | 0 | |||||
| 2026-01-22 | 13F | Mechanics Financial Corp | 250 | 0,00 | 10 | 0,00 | ||||
| 2026-02-17 | 13F | Worldquant Millennium Advisors Llc | 7.726 | 312 | ||||||
| 2025-11-14 | 13F | Hotchkis & Wiley Capital Management Llc | 0 | -100,00 | 0 | -100,00 | ||||
| 2026-04-20 | 13F | Louisiana State Employees Retirement System | 25.400 | 4,53 | 986 | 0,51 | ||||
| 2026-02-11 | 13F | Parallel Advisors, LLC | 315 | 96,88 | 13 | 100,00 | ||||
| 2026-02-05 | 13F | Northwestern Mutual Investment Management Company, Llc | 19.623 | -0,86 | 792 | -6,93 | ||||
| 2026-02-17 | 13F | Bank Of America Corp /de/ | 2.815.734 | 38,85 | 113.671 | 30,33 | ||||
| 2026-02-17 | 13F | Prelude Capital Management, Llc | 5.550 | 224 | ||||||
| 2026-02-11 | 13F | SOUTH STATE Corp | 10 | 0,00 | 0 | |||||
| 2025-11-14 | 13F | Qube Research & Technologies Ltd | 0 | -100,00 | 0 | |||||
| 2026-02-19 | 13F | Invesco Ltd. | 2.028.154 | 9,37 | 81.877 | 2,66 | ||||
| 2026-02-10 | 13F | Goldman Sachs Group Inc | 125.639 | -64,74 | 5.072 | -66,90 | ||||
| 2026-02-09 | 13F | Coldstream Capital Management Inc | 5.508 | -18,24 | 222 | -23,18 | ||||
| 2026-02-13 | 13F | Sterling Capital Management LLC | 5.227 | -4,30 | 211 | -9,83 | ||||
| 2026-02-06 | 13F | Lsv Asset Management | 0 | -100,00 | 0 | |||||
| 2026-02-13 | 13F | Rhumbline Advisers | 246.420 | -4,77 | 9.948 | -10,62 | ||||
| 2026-02-12 | 13F | DRW Securities, LLC | 0 | -100,00 | 0 | |||||
| 2026-02-12 | 13F | BlackRock, Inc. | 7.476.834 | -2,25 | 301.840 | -8,25 | ||||
| 2026-01-30 | 13F | Keybank National Association/oh | 10.237 | 20,98 | 413 | 13,77 | ||||
| 2026-02-17 | 13F | Pinnacle Financial Partners, Inc. | 29.492 | 1.191 | ||||||
| 2026-04-13 | 13F | Massmutual Trust Co Fsb/adv | 7.497 | -5,71 | 291 | -9,37 | ||||
| 2026-02-06 | 13F | Envestnet Portfolio Solutions, Inc. | 17.441 | 1,28 | 704 | -4,86 | ||||
| 2026-02-11 | 13F | Simplex Trading, Llc | Put | 700 | 40,00 | 28 | ||||
| 2026-02-11 | 13F | Simplex Trading, Llc | 862 | 1.526,42 | 35 | |||||
| 2026-02-03 | 13F | Jlb & Associates Inc | 28.964 | -36,88 | 1.169 | -40,75 | ||||
| 2026-02-11 | 13F | Simplex Trading, Llc | Call | 300 | 50,00 | 12 | ||||
| 2025-10-28 | 13F | Wright Investors Service Inc | 0 | -100,00 | 0 | |||||
| 2026-02-13 | 13F | Prudential Financial Inc | 6.071 | -33,64 | 245 | -37,66 | ||||
| 2026-02-10 | 13F | Bnp Paribas Arbitrage, Sa | 12.565 | -93,76 | 507 | -94,14 | ||||
| 2026-02-03 | 13F | Farmers & Merchants Investments Inc | 74 | 5,71 | 3 | -33,33 | ||||
| 2026-02-12 | 13F | Callan Family Office, LLC | 5.728 | 231 | ||||||
| 2026-02-13 | 13F | Manufacturers Life Insurance Company, The | 0 | -100,00 | 0 | |||||
| 2026-02-13 | 13F | Union Heritage Capital, LLC | 58.335 | -8,46 | 2.355 | -14,09 | ||||
| 2026-02-02 | 13F | Fifth Third Bancorp | 1.084 | 37,39 | 44 | 30,30 | ||||
| 2026-02-10 | 13F | Measured Wealth Private Client Group, LLC | 713 | -7,04 | 29 | -12,50 | ||||
| 2025-11-12 | 13F | Bellwether Advisors, LLC | 0 | -100,00 | 0 | |||||
| 2026-02-12 | 13F | Swiss National Bank | 179.300 | 1,70 | 7.238 | -4,54 | ||||
| 2025-11-14 | 13F | Aristeia Capital Llc | 0 | -100,00 | 0 | -100,00 | ||||
| 2026-01-13 | 13F | Fort Washington Investment Advisors Inc /oh/ | 489.825 | -16,58 | 19.774 | -21,70 | ||||
| 2026-02-02 | 13F | Cornerstone Planning Group LLC | 37 | 2,78 | 2 | -75,00 | ||||
| 2026-02-05 | 13F | Td Private Client Wealth Llc | 257 | -2,65 | 10 | -9,09 | ||||
| 2026-02-17 | 13F | ExodusPoint Capital Management, LP | 0 | -100,00 | 0 | -100,00 | ||||
| 2026-02-10 | 13F/A | Northwestern Mutual Wealth Management Co | 22.286 | -20,55 | 900 | -25,46 | ||||
| 2026-01-08 | 13F | True Wealth Design, LLC | 0 | -100,00 | 0 | |||||
| 2026-01-27 | 13F | Zurcher Kantonalbank (Zurich Cantonalbank) | 17.348 | 0,00 | 700 | -6,17 | ||||
| 2026-02-11 | 13F | Empowered Funds, LLC | 2.831 | -85,57 | 114 | -86,48 | ||||
| 2026-01-29 | 13F | State Of Michigan Retirement System | 20.700 | -1,90 | 836 | -7,94 | ||||
| 2026-02-11 | 13F | Winton Capital Group Ltd | 131.032 | 5.290 | ||||||
| 2026-01-16 | 13F | Ronald Blue Trust, Inc. | 1.627 | 172,53 | 66 | 160,00 | ||||
| 2026-02-17 | 13F | CWM Advisors, LLC | 14.083 | 13,65 | 569 | 6,77 | ||||
| 2026-02-17 | 13F | Citadel Advisors Llc | 324.912 | -0,50 | 13.117 | -6,61 | ||||
| 2026-02-06 | 13F | ProShare Advisors LLC | 736.780 | 17,10 | 29.744 | 9,91 | ||||
| 2026-01-29 | 13F | Teachers Retirement System Of The State Of Kentucky | 28.037 | 0,00 | 1 | 0,00 | ||||
| 2026-02-17 | 13F | Wellington Management Group Llp | 213.738 | -96,19 | 8.629 | -96,42 | ||||
| 2026-02-10 | 13F | Private Wealth Asset Management, LLC | 270 | 0,00 | 11 | -9,09 | ||||
| 2026-02-10 | 13F | Nomura Asset Management Co Ltd | 680 | 0,00 | 27 | -6,90 | ||||
| 2026-04-15 | 13F | Fortitude Family Office, LLC | 90 | 1.400,00 | 3 | |||||
| 2026-02-06 | 13F | Legato Capital Management LLC | 0 | -100,00 | 0 | |||||
| 2026-02-04 | 13F | Dogwood Wealth Management LLC | 0 | -100,00 | 0 | |||||
| 2026-01-23 | 13F | Rsm Us Wealth Management Llc | 13.286 | 13,33 | 540 | 7,14 | ||||
| 2025-11-13 | 13F | Crewe Advisors LLC | 0 | -100,00 | 0 | |||||
| 2026-02-10 | 13F | Natixis Advisors, L.p. | 19.374 | -32,21 | 1 | -100,00 | ||||
| 2026-02-13 | 13F | Sei Investments Co | 282.235 | -7,23 | 11.394 | -12,92 | ||||
| 2026-02-20 | 13F | Dean Capital Management | 0 | -100,00 | 0 | |||||
| 2026-02-17 | 13F | Cetera Investment Advisers | 9.322 | 21,44 | 376 | 13,94 | ||||
| 2026-01-29 | 13F | Verdence Capital Advisors LLC | 11.285 | 2,53 | 456 | -7,52 | ||||
| 2026-02-10 | 13F | New Mexico Educational Retirement Board | 17.100 | 0,00 | 1 | |||||
| 2026-02-13 | 13F | FORA Capital, LLC | 0 | -100,00 | 0 | |||||
| 2026-02-03 | 13F | SBI Securities Co., Ltd. | 86 | 1,18 | 3 | 0,00 | ||||
| 2026-02-17 | 13F | Mercer Global Advisors Inc /adv | 8.634 | 22,73 | 349 | 15,23 | ||||
| 2026-02-05 | 13F | Allworth Financial LP | 700 | -5,66 | 28 | -9,68 | ||||
| 2026-01-28 | 13F | Boston Trust Walden Corp | 1.533.779 | -5,85 | 61.919 | -11,63 | ||||
| 2025-11-06 | 13F | Drake & Associates, LLC | 0 | -100,00 | 0 | |||||
| 2026-02-12 | 13F | BRYN MAWR TRUST Co | 0 | -100,00 | 0 | -100,00 | ||||
| 2026-02-11 | 13F | Franklin Resources Inc | 95.136 | 17,16 | 3.841 | 9,97 | ||||
| 2026-04-06 | 13F | CX Institutional | 1.325 | 10,60 | 0 | |||||
| 2026-02-13 | 13F | Atlas Capital Advisors Llc | 0 | -100,00 | 0 | |||||
| 2026-02-04 | 13F | Hirtle Callaghan & Co LLC | 0 | -100,00 | 0 | |||||
| 2026-02-06 | 13F | Gsa Capital Partners Llp | 5.314 | 0 | ||||||
| 2026-02-13 | 13F | Umb Bank N A/mo | 2.086 | 2.609,09 | 84 | 2.700,00 | ||||
| 2026-02-13 | 13F | Schroder Investment Management Group | 413.368 | 16.803 | ||||||
| 2026-02-11 | 13F | Zions Bancorporation, National Association /ut/ | 40 | 2 | ||||||
| 2026-04-08 | 13F | DiNuzzo Private Wealth, Inc. | 23 | 43,75 | 1 | |||||
| 2026-02-12 | 13F | Wealthspire Advisors, LLC | 0 | -100,00 | 0 | |||||
| 2026-02-17 | 13F | Tower Research Capital LLC (TRC) | 5.063 | 61,40 | 204 | 52,24 | ||||
| 2026-01-26 | 13F | Cwm, Llc | 792 | 10,00 | 0 | |||||
| 2026-02-12 | 13F | Colonial Trust Advisors | 0 | -100,00 | 0 | |||||
| 2026-02-24 | 13F | MidFirst Bank | 4.159 | 168 | ||||||
| 2026-02-13 | 13F | JustInvest LLC | 9.365 | -10,70 | 378 | -16,19 | ||||
| 2026-01-29 | 13F | Sanctuary Advisors, LLC | 6.222 | -17,51 | 251 | -22,53 | ||||
| 2025-11-06 | 13F | MQS Management LLC | 0 | -100,00 | 0 | -100,00 | ||||
| 2026-02-17 | 13F | Guggenheim Capital Llc | 7.720 | 65,56 | 312 | 55,50 | ||||
| 2026-02-17 | 13F | Point72 Asset Management, L.P. | 73.570 | -66,99 | 2.970 | -69,02 | ||||
| 2026-02-17 | 13F | Engineers Gate Manager LP | 60.112 | -38,48 | 2.427 | -42,27 | ||||
| 2026-02-02 | 13F | Danske Bank A/s | 1.000 | 233,33 | 40 | 233,33 | ||||
| 2026-04-20 | 13F | City State Bank | 300 | -25,00 | 12 | -31,25 | ||||
| 2026-02-17 | 13F | Adage Capital Partners Gp, L.l.c. | 0 | -100,00 | 0 | |||||
| 2026-01-30 | 13F | New York State Teachers Retirement System | 97.618 | 1,52 | 4 | -25,00 | ||||
| 2026-02-09 | 13F | CBIZ Investment Advisory Services, LLC | 31 | 0,00 | 1 | 0,00 | ||||
| 2026-01-07 | 13F | Aventura Private Wealth, LLC | 0 | -100,00 | 0 | |||||
| 2026-02-09 | 13F | AIA Group Ltd | 18.100 | 0,00 | 731 | -6,17 | ||||
| 2026-01-30 | 13F/A | M&t Bank Corp | 9.252 | 22,19 | 374 | 14,77 | ||||
| 2026-02-12 | 13F | Ensign Peak Advisors, Inc | 5.538 | -55,30 | 224 | -58,08 | ||||
| 2026-02-09 | 13F | Geode Capital Management, Llc | 1.744.745 | 1,83 | 70.449 | -4,41 | ||||
| 2026-02-17 | 13F | Aqr Capital Management Llc | 22.038 | 191,59 | 890 | 175,23 | ||||
| 2026-02-17 | 13F | Boothbay Fund Management, Llc | 0 | -100,00 | 0 | |||||
| 2026-02-13 | 13F | Great West Life Assurance Co /can/ | 53.840 | -8,61 | 2 | 0,00 | ||||
| 2026-02-02 | 13F | Principal Financial Group Inc | 188.689 | -4,38 | 7.617 | -10,25 | ||||
| 2025-10-27 | 13F | Janney Montgomery Scott LLC | 0 | -100,00 | 0 | |||||
| 2026-02-11 | 13F | Rise Advisors, LLC | 0 | -100,00 | 0 | |||||
| 2026-02-12 | 13F | State Board Of Administration Of Florida Retirement System | 74.890 | 0,00 | 3.023 | -6,15 | ||||
| 2026-02-10 | 13F | Quantbot Technologies LP | 15.186 | 69,02 | 613 | 58,81 | ||||
| 2026-02-12 | 13F | Principal Securities, Inc. | 0 | -100,00 | 0 | -100,00 | ||||
| 2025-11-14 | 13F | Mount Yale Investment Advisors, LLC | 0 | -100,00 | 0 | -100,00 | ||||
| 2026-04-17 | 13F | Vermillion Wealth Management, Inc. | 7 | 0 | ||||||
| 2026-01-22 | 13F | Financial Consulate, Inc | 0 | -100,00 | 0 | |||||
| 2026-02-11 | 13F | Illinois Municipal Retirement Fund | 0 | -100,00 | 0 | |||||
| 2026-02-18 | 13F | State of Tennessee, Treasury Department | 34.035 | -6,99 | 1.469 | -6,68 | ||||
| 2025-10-24 | 13F | Hemington Wealth Management | 70 | -52,05 | 0 | |||||
| 2026-02-12 | 13F | Hrt Financial Lp | 10.908 | -31,66 | 0 | |||||
| 2026-02-05 | 13F | Thrivent Financial For Lutherans | 19.749 | -3,20 | 1 | |||||
| 2026-02-10 | 13F | MainStreet Investment Advisors LLC | 12.688 | -12,68 | 512 | -17,95 | ||||
| 2026-02-17 | 13F | T. Rowe Price Investment Management, Inc. | 994.353 | 16,55 | 40 | 11,11 | ||||
| 2026-01-20 | 13F | Cromwell Holdings LLC | 14 | 1 | ||||||
| 2026-02-18 | 13F/A | Alberta Investment Management Corp | 35.400 | 1.429 | ||||||
| 2026-01-23 | 13F | Robeco Institutional Asset Management B.V. | 18.100 | 0,00 | 731 | -6,17 | ||||
| 2026-02-13 | 13F | Dynamic Technology Lab Private Ltd | 22.971 | 927 | ||||||
| 2026-02-17 | 13F | Two Sigma Investments, Lp | 495.962 | 1.968,84 | 20.022 | 1.841,90 | ||||
| 2026-04-14 | 13F | Bay Harbor Wealth Management, LLC | 19 | 171,43 | 1 | |||||
| 2026-01-28 | 13F | Arizona State Retirement System | 25.288 | -6,03 | 1.021 | -11,84 | ||||
| 2026-02-12 | 13F | Skopos Labs, Inc. | 5.564 | 228 | ||||||
| 2026-02-17 | 13F | Holocene Advisors, LP | 34.856 | 1.407 | ||||||
| 2026-01-30 | 13F | Rogco, Lp | 297 | 0,00 | 12 | -8,33 | ||||
| 2026-02-13 | 13F | Verition Fund Management LLC | 21.420 | 31,18 | 865 | 23,08 | ||||
| 2026-02-10 | 13F | DT Investment Partners, LLC | 187 | 0,00 | 8 | -12,50 | ||||
| 2026-02-13 | 13F | Virtus ETF Advisers LLC | 3.190 | 0,00 | 129 | -6,57 | ||||
| 2026-01-23 | 13F | Assetmark, Inc | 880 | -29,32 | 36 | -33,96 | ||||
| 2026-02-12 | 13F | Cloud Capital Management, LLC | 0 | -100,00 | 0 | |||||
| 2026-01-23 | 13F | Steigerwald, Gordon & Koch Inc. | 220 | 0,00 | 9 | -11,11 | ||||
| 2026-02-17 | 13F | Two Sigma Advisers, Lp | 253.600 | 221,42 | 10.238 | 201,71 | ||||
| 2026-02-10 | 13F | Norges Bank | 763.275 | 30.813 | ||||||
| 2026-02-17 | 13F | Glenmede Trust Co Na | 258.372 | -15,48 | 10.430 | -33,25 | ||||
| 2026-02-10 | 13F | State of Wyoming | 1.482 | -57,39 | 60 | -60,40 | ||||
| 2026-02-17 | 13F | Janus Henderson Group Plc | 1.533.926 | -3,72 | 61.925 | -9,63 | ||||
| 2026-01-12 | 13F | Rialto Wealth Management, LLC | 0 | -100,00 | 0 | |||||
| 2026-02-10 | 13F | Bank of New York Mellon Corp | 855.002 | 0,57 | 34.516 | -5,60 | ||||
| 2026-02-13 | 13F | Silicon Valley Capital Partners | 1.447 | 0,49 | 58 | -4,92 | ||||
| 2026-02-17 | 13F | Ameriprise Financial Inc | 180.703 | -10,36 | 7.295 | -15,86 | ||||
| 2025-11-13 | 13F | Magnetar Financial LLC | 0 | -100,00 | 0 | |||||
| 2026-02-18 | 13F | GWM Advisors LLC | 0 | -100,00 | 0 | |||||
| 2026-02-12 | 13F | MetLife Investment Management, LLC | 42.865 | -6,07 | 1.730 | -11,82 | ||||
| 2025-11-14 | 13F | Ieq Capital, Llc | 0 | -100,00 | 0 | |||||
| 2026-01-13 | 13F | Ausbil Investment Management Ltd | 0 | -100,00 | 0 | -100,00 | ||||
| 2026-02-17 | 13F | Susquehanna International Group, Llp | Call | 5.600 | 226 | |||||
| 2026-02-11 | 13F | Vestcor Inc | 0 | -100,00 | 0 | |||||
| 2026-02-12 | 13F | Jane Street Group, Llc | 0 | -100,00 | 0 | |||||
| 2025-11-14 | 13F | Horizon Investments, LLC | 0 | -100,00 | 0 | |||||
| 2026-02-13 | 13F | Segall Bryant & Hamill, Llc | 990.036 | -6,38 | 39.968 | -12,13 | ||||
| 2026-02-26 | 13F | TD Capital Management LLC | 88 | 0,00 | 4 | 0,00 | ||||
| 2025-11-14 | 13F | Toroso Investments, LLC | 0 | -100,00 | 0 | -100,00 | ||||
| 2026-04-06 | 13F | Versant Capital Management, Inc | 593 | 3,67 | 23 | 0,00 | ||||
| 2026-02-17 | 13F | Susquehanna International Group, Llp | 14.879 | -0,75 | 601 | -6,83 | ||||
| 2026-02-17 | 13F | State Of Wisconsin Investment Board | 82.702 | 844,09 | 3.339 | 787,77 | ||||
| 2026-01-28 | 13F | Teacher Retirement System Of Texas | 18.914 | -48,73 | 764 | -51,89 | ||||
| 2026-02-06 | 13F | Handelsbanken Fonder AB | 22.588 | 0,00 | 1 | |||||
| 2026-01-27 | 13F | First Horizon Corp | 100 | 0,00 | 4 | 0,00 | ||||
| 2026-02-13 | 13F | Golden State Wealth Management, LLC | 0 | -100,00 | 0 | |||||
| 2026-02-05 | 13F | Amalgamated Bank | 38.892 | -4,02 | 2 | 0,00 | ||||
| 2026-02-12 | 13F | Rossby Financial, LCC | 12 | 500,00 | 0 | |||||
| 2026-02-17 | 13F | Signature Equity Partners, LLC | 6 | 0 | ||||||
| 2026-02-14 | 13F | Rockefeller Capital Management L.P. | 2.674 | 150,37 | 108 | 134,78 | ||||
| 2025-11-04 | 13F | Agf Management Ltd | 0 | -100,00 | 0 | -100,00 | ||||
| 2025-11-14 | 13F | Clark Capital Management Group, Inc. | 0 | -100,00 | 0 | |||||
| 2026-02-11 | 13F | Ameritas Investment Partners, Inc. | 49.804 | 2.011 | ||||||
| 2026-02-12 | 13F | Voya Investment Management Llc | 6.518 | -31,10 | 263 | -35,22 |
Other Listings
| DE:SL3 | 34,40 € |