Grundlæggende statistik
| Institutionelle ejere | 251 total, 243 long only, 1 short only, 7 long/short - change of -23,17% MRQ |
| Gennemsnitlig porteføljeallokering | 0.5772 % - change of -11,72% MRQ |
| Institutionelle aktier (lange) | 26.367.657 (ex 13D/G) - change of -7,07MM shares -21,15% MRQ |
| Institutionel værdi (lang) | $ 2.229.033 USD ($1000) |
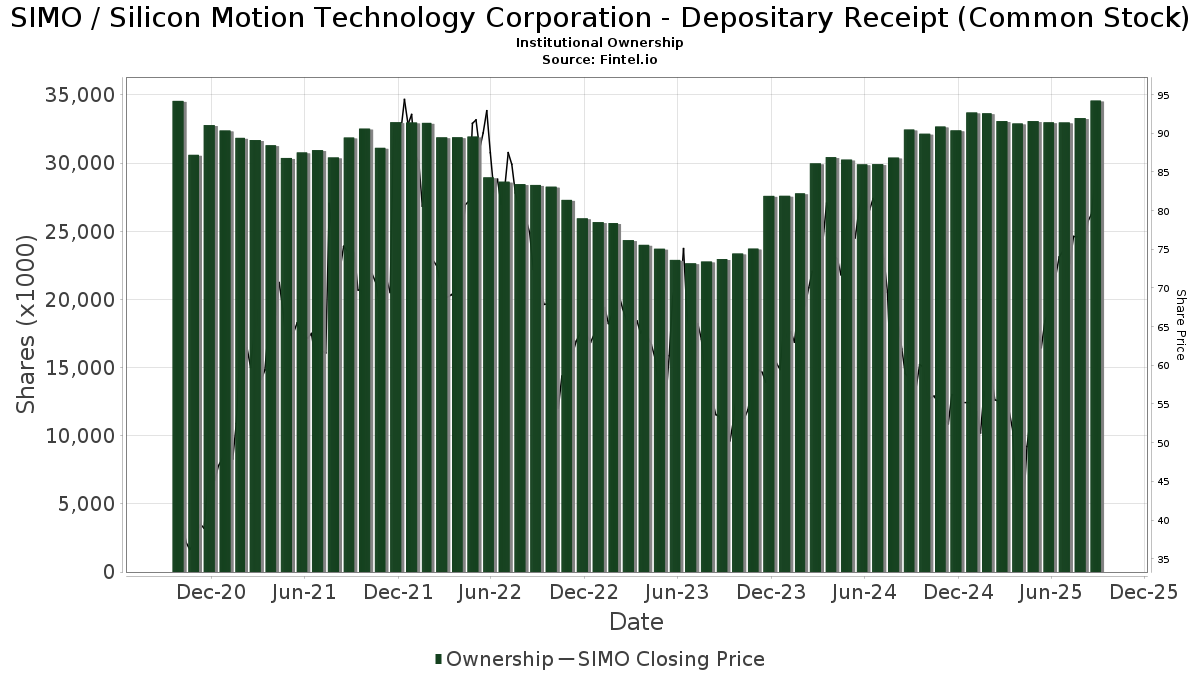
Institutionelt ejerskab og aktionærer
Silicon Motion Technology Corporation - Depositary Receipt (Common Stock) (US:SIMO) har 251 institutionelle ejere og aktionærer, der har indsendt 13D/G- eller 13F-formularer til Securities Exchange Commission (SEC). Disse institutioner har i alt 26,367,657 aktier. Største aktionærer omfatter Fmr Llc, Reinhart Partners, Inc., Acadian Asset Management Llc, Pertento Partners LLP, Lord, Abbett & Co. Llc, Hawk Ridge Capital Management Lp, Lazard Asset Management Llc, Wellington Management Group Llp, Invesco Ltd., and Robeco Institutional Asset Management B.V. .
Silicon Motion Technology Corporation - Depositary Receipt (Common Stock) (NasdaqGS:SIMO) institutionel ejerskabsstruktur viser aktuelle positioner i virksomheden efter institutioner og fonde, samt seneste ændringer i positionsstørrelse. Større aktionærer kan omfatte individuelle investorer, investeringsforeninger, hedgefonde eller institutioner. Skema 13D angiver, at investoren besidder (eller besidder) mere end 5 % af virksomheden og har til hensigt (eller har til hensigt at) aktivt at forfølge en ændring i forretningsstrategi. Skema 13G indikerer en passiv investering på over 5%.
The share price as of April 14, 2026 is 130,14 / share. Previously, on April 15, 2025, the share price was 41,36 / share. This represents an increase of 214,65% over that period.
Fondens stemningsscore
Fund Sentiment Score (fka Ownership Accumulation Score) finder de aktier, der bliver mest købt af fonde. Det er resultatet af en sofistikeret, multi-faktor kvantitativ model, der identificerer virksomheder med de højeste niveauer af institutionel akkumulering. Scoringsmodellen bruger en kombination af den samlede stigning i oplyste ejere, ændringerne i porteføljeallokeringer i disse ejere og andre målinger. Tallet går fra 0 til 100, hvor højere tal indikerer et højere niveau af akkumulering for sine jævnaldrende, og 50 er gennemsnittet.
Opdateringsfrekvens: Dagligt
Se Ownership Explorer, som giver en liste over højest rangerende virksomheder.
AI+ Ask Fintel’s AI assistant about Silicon Motion Technology Corporation - Depositary Receipt (Common Stock).
Select a question to share a public post with an AI-crafted answer.
Thinking of good questions…
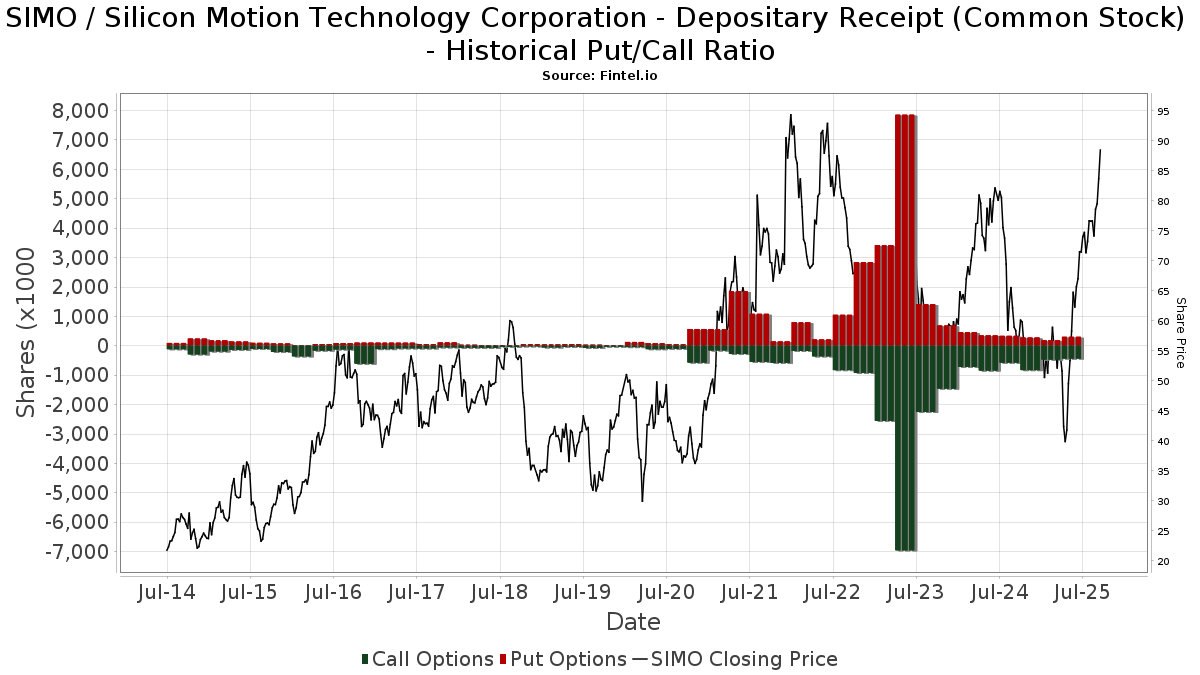
Institutionel Put/Call-forhold
Ud over at indberette standardaktie- og gældsudstedelser skal institutter med mere end 100 mill. aktiver under forvaltning også oplyse deres put- og call-optionsbeholdninger. Da salgsoptioner generelt indikerer negativ stemning, og købsoptioner indikerer positiv stemning, kan vi få en fornemmelse af den overordnede institutionelle stemning ved at plotte forholdet mellem put og kald. Diagrammet til højre viser det historiske put/call-forhold for dette instrument.
Brug af Put/Call Ratio som en indikator for investorernes stemning overvinder en af de vigtigste mangler ved at bruge totalt institutionelt ejerskab, som er, at en betydelig mængde af aktiver under forvaltning investeres passivt for at spore indekser. Passivt forvaltede fonde køber typisk ikke optioner, så indikatoren for put/call-forholdet følger mere nøje følelsen af aktivt forvaltede fonde.
13D/G-arkivering
Vi præsenterer 13D/G ansøgninger separat fra 13F ansøgninger på grund af den forskellige behandling af SEC. 13D/G-ansøgninger kan indgives af grupper af investorer (med én ledende), hvorimod 13F-ansøgninger ikke kan. Dette resulterer i situationer, hvor en investor kan indsende en 13D/G, der rapporterer én værdi for de samlede aktier (der repræsenterer alle de aktier, der ejes af investorgruppen), men derefter indsender en 13F, der rapporterer en anden værdi for de samlede aktier (der udelukkende repræsenterer deres egne) ejendomsret). Det betyder, at aktieejerskab af 13D/G-arkiver og 13F-arkiveringer ofte ikke er direkte sammenlignelige, så vi præsenterer dem separat.
Bemærk: Fra den 16. maj 2021 viser vi ikke længere ejere, der ikke har indsendt en 13D/G inden for det seneste år. Tidligere viste vi den fulde historie af 13D/G-arkiver. Generelt skal enheder, der er forpligtet til at indgive 13D/G-ansøgninger, indgive mindst årligt, før de indsender en afsluttende ansøgning. Dog forlader fonde nogle gange positioner uden at indsende en afsluttende ansøgning (dvs. de afvikler), så visning af den fulde historie resulterede nogle gange i forvirring om det nuværende ejerskab. For at undgå forvirring viser vi nu kun 'aktuelle' ejere - det vil sige - ejere, der har anmeldt inden for det seneste år.
Upgrade to unlock premium data.
13F og NPORT arkivering
Detaljer om 13F-arkivering er gratis. Detaljer om NP-ansøgninger kræver et premium-medlemskab. Grønne rækker angiver nye positioner. Røde rækker angiver lukkede positioner. Klik på linket ikon for at se den fulde transaktionshistorik.
Opgrader
for at låse premium-data op og eksportere til Excel ![]() .
.
| Fil dato | Kilde | Investor | Type | Gennemsnitlig pris (Øst) |
Aktier | Δ Aktier (%) |
Rapporteret Værdi ($1000) |
Δ Værdi (%) |
Port Alloc (%) |
|
|---|---|---|---|---|---|---|---|---|---|---|
| 2026-02-10 | 13F | Easterly Investment Partners Llc | 123.807 | -0,18 | 11.477 | -2,40 | ||||
| 2026-02-17 | 13F | Jones Financial Companies Lllp | 57 | -24,00 | 5 | -16,67 | ||||
| 2026-02-13 | 13F | University Of Texas/texas Am Investment Managment Co | 15.256 | 1.414 | ||||||
| 2026-03-03 | 13F/A | Caitong International Asset Management Co., Ltd | 23 | -85,35 | 2 | -85,71 | ||||
| 2026-02-09 | 13F | Huntington National Bank | 81 | 9,46 | 8 | 0,00 | ||||
| 2025-11-14 | 13F | State Of Wisconsin Investment Board | 0 | -100,00 | 0 | |||||
| 2026-02-06 | 13F | Hardy Reed LLC | 4.844 | -2,26 | 449 | -4,26 | ||||
| 2026-02-17 | 13F | Adage Capital Partners Gp, L.l.c. | 371.662 | -16,70 | 34.453 | -18,55 | ||||
| 2026-02-09 | 13F | Harbour Investments, Inc. | 0 | -100,00 | 0 | |||||
| 2026-01-30 | 13F | Us Bancorp \de\ | 16.945 | 35,21 | 1.571 | 32,15 | ||||
| 2026-02-17 | 13F | Aspen Grove Capital, LLC | 2.507 | -29,10 | 232 | -30,75 | ||||
| 2026-02-06 | 13F | Abn Amro Investment Solutions | 106.851 | 159,47 | 9.905 | 153,71 | ||||
| 2026-02-17 | 13F | Jump Financial, LLC | 22.000 | 113,59 | 2.039 | 108,91 | ||||
| 2026-01-16 | 13F | Ronald Blue Trust, Inc. | 1.891 | -10,12 | 175 | -12,06 | ||||
| 2026-02-11 | 13F | Erste Asset Management GmbH | 4.000 | 371 | ||||||
| 2026-01-29 | 13F | Camelot Portfolios, LLC | 2.389 | -14,74 | 221 | -16,60 | ||||
| 2026-01-30 | 13F | Caldwell Securities, Inc | 32 | 0,00 | 3 | -33,33 | ||||
| 2026-01-29 | 13F | IMC-Chicago, LLC | Call | 18.800 | -38,36 | 1.743 | -39,74 | |||
| 2026-01-26 | 13F | Private Trust Co Na | 54 | 0,00 | 5 | 0,00 | ||||
| 2026-01-29 | 13F | UMA Financial Services, Inc. | 27 | 170,00 | 3 | |||||
| 2026-02-13 | 13F | National Bank Of Canada /fi/ | 375 | 0,00 | 35 | -2,86 | ||||
| 2026-02-17 | 13F | Alliancebernstein L.p. | 6.236 | 578 | ||||||
| 2026-02-13 | 13F | MAI Capital Management | 15 | 0,00 | 1 | 0,00 | ||||
| 2026-02-13 | 13F | Walleye Trading LLC | 0 | -100,00 | 0 | -100,00 | ||||
| 2026-02-13 | 13F | Marshall Wace, Llp | 132.651 | 12.297 | ||||||
| 2026-02-17 | 13F | Think Investments LP | 289.300 | 0,00 | 26.818 | -2,22 | ||||
| 2026-02-05 | 13F | Bessemer Group Inc | 16 | -33,33 | 0 | |||||
| 2026-02-05 | 13F | Gamco Investors, Inc. Et Al | 18.560 | -17,84 | 1.721 | -19,66 | ||||
| 2026-01-30 | 13F | North Star Investment Management Corp. | 5.400 | 0,00 | 501 | -2,15 | ||||
| 2026-01-30 | 13F | Skylands Capital, LLC | 53.219 | 37,89 | 4.933 | 34,82 | ||||
| 2025-11-14 | 13F | Skopos Labs, Inc. | 0 | -100,00 | 0 | |||||
| 2026-02-17 | 13F | Polar Asset Management Partners Inc. | 0 | -100,00 | 0 | -100,00 | ||||
| 2026-02-17 | 13F | Kite Lake Capital Management (uk) Llp | 456.271 | 25,02 | 42.296 | 22,24 | ||||
| 2026-02-17 | 13F | Advisor Group Holdings, Inc. | 7.094 | -74,51 | 658 | -70,54 | ||||
| 2026-01-30 | 13F | NJ State Employees Deferred Compensation Plan | 0 | -100,00 | 0 | |||||
| 2025-11-14 | 13F | Wolverine Trading, Llc | Put | 0 | -100,00 | 0 | -100,00 | |||
| 2026-02-17 | 13F | potrero capital research llc | 0 | -100,00 | 0 | |||||
| 2026-02-17 | 13F | Melqart Asset Management (uk) Ltd | 98.417 | -7,30 | 9.123 | -9,37 | ||||
| 2026-02-13 | 13F | State Street Corp | 91.040 | 13,48 | 8.439 | 10,95 | ||||
| 2026-02-17 | 13F | Man Group plc | 381.048 | 820,74 | 35.323 | 800,41 | ||||
| 2026-02-17 | 13F | Royal Bank Of Canada | 46.927 | -12,55 | 4.349 | -14,52 | ||||
| 2026-02-17 | 13F | Creative Planning | 4.811 | -0,93 | 446 | -3,26 | ||||
| 2026-02-13 | 13F | Pinnacle Wealth Planning Services, Inc. | 303 | 28 | ||||||
| 2026-02-17 | 13F | Summit Partners Public Asset Management, Llc | Call | 0 | -100,00 | 0 | ||||
| 2026-01-30 | 13F | CBOE Vest Financial, LLC | 2.605 | 241 | ||||||
| 2026-02-17 | 13F | Summit Partners Public Asset Management, Llc | Put | 0 | -100,00 | 0 | ||||
| 2026-02-17 | 13F | Oberweis Asset Management Inc/ | 236.300 | 2,47 | 21.905 | 0,19 | ||||
| 2026-02-17 | 13F | Sora Investors Llc | 128.221 | 79,24 | 11.886 | 75,26 | ||||
| 2026-02-17 | 13F | Northern Trust Corp | 125.464 | -8,38 | 11.631 | -10,41 | ||||
| 2026-02-13 | 13F | Toroso Investments, LLC | 28.118 | 32,32 | 2.607 | 29,39 | ||||
| 2026-02-06 | 13F | Global Retirement Partners, LLC | 1.131 | 88,81 | 105 | 85,71 | ||||
| 2026-02-12 | 13F | M&G Plc | 202.799 | 12,02 | 18.860 | 9,66 | ||||
| 2026-02-12 | 13F | New York State Common Retirement Fund | 36.015 | 0,00 | 3.339 | -2,23 | ||||
| 2026-02-24 | 13F | Bell Investment Advisors, Inc | 85 | 0,00 | 8 | -12,50 | ||||
| 2026-02-13 | 13F | Citigroup Inc | 3.698 | 8,67 | 343 | 6,21 | ||||
| 2026-02-18 | 13F | GWM Advisors LLC | 0 | -100,00 | 0 | |||||
| 2026-02-17 | 13F | Susquehanna Portfolio Strategies, LLC | 77.322 | 0,00 | 7.168 | -2,22 | ||||
| 2026-02-17 | 13F | Clearline Capital LP | 132.911 | -21,67 | 12.321 | -23,42 | ||||
| 2026-01-26 | 13F | Cwm, Llc | 2 | 0,00 | 0 | |||||
| 2026-01-16 | 13F | FNY Investment Advisers, LLC | 1.000 | -50,35 | 0 | |||||
| 2025-11-07 | 13F | Credit Industriel Et Commercial | 0 | -100,00 | 0 | |||||
| 2026-02-17 | 13F | Jain Global LLC | 61.789 | 137,59 | 5.728 | 132,33 | ||||
| 2026-01-30 | 13F | BancorpSouth Bank | 15.969 | 3,23 | 1.480 | 0,95 | ||||
| 2026-02-06 | 13F | Covestor Ltd | 4.351 | 5,76 | 0 | |||||
| 2026-02-11 | 13F | Simplex Trading, Llc | Put | 0 | -100,00 | 0 | -100,00 | |||
| 2026-02-11 | 13F | Simplex Trading, Llc | Call | 0 | -100,00 | 0 | -100,00 | |||
| 2025-11-14 | 13F | Trexquant Investment LP | 0 | -100,00 | 0 | |||||
| 2026-02-12 | 13F | Campbell & CO Investment Adviser LLC | 7.406 | 687 | ||||||
| 2026-02-11 | 13F | Parallel Advisors, LLC | 715 | 6,88 | 66 | 4,76 | ||||
| 2026-01-26 | 13F | Patriot Financial Group Insurance Agency, LLC | 2.984 | -0,57 | 277 | -2,82 | ||||
| 2026-03-11 | 13F | Leonteq Securities AG | 0 | -100,00 | 0 | |||||
| 2026-02-12 | 13F | Principal Securities, Inc. | 0 | -100,00 | 0 | |||||
| 2026-02-17 | 13F | Prelude Capital Management, Llc | 6.901 | -54,48 | 640 | -55,53 | ||||
| 2025-11-14 | 13F | Black Maple Capital Management LP | Put | 0 | -100,00 | 0 | ||||
| 2026-02-17 | 13F | Bank Of America Corp /de/ | 183.417 | 1,34 | 17.003 | -0,91 | ||||
| 2026-02-19 | 13F | Invesco Ltd. | 632.105 | -30,22 | 58.596 | -31,78 | ||||
| 2026-02-13 | 13F | Walleye Trading LLC | Put | 1.600 | -97,55 | 148 | -97,61 | |||
| 2026-02-13 | 13F | Walleye Trading LLC | Call | 2.900 | -85,78 | 269 | -86,14 | |||
| 2026-01-27 | 13F | Proffitt & Goodson Inc | 69 | 0,00 | 6 | 0,00 | ||||
| 2026-02-12 | 13F | Federation des caisses Desjardins du Quebec | 25 | 0,00 | 2 | 0,00 | ||||
| 2026-02-13 | 13F | Squarepoint Ops LLC | 15.430 | 1.430 | ||||||
| 2026-02-10 | 13F | Goldman Sachs Group Inc | 37.966 | -6,03 | 3.519 | -8,12 | ||||
| 2026-02-04 | 13F | West Tower Group, LLC | 12.300 | 0,00 | 1.140 | -2,23 | ||||
| 2026-03-26 | 13F/A | Peak6 Llc | Put | 0 | -100,00 | 0 | -100,00 | |||
| 2026-02-12 | 13F | BlackRock, Inc. | 70.190 | -11,02 | 6.507 | -13,00 | ||||
| 2026-02-09 | 13F | Royce & Associates Lp | 92.540 | 41,28 | 8.578 | 38,13 | ||||
| 2025-11-13 | 13F | Total Investment Management Inc | 0 | -100,00 | 0 | |||||
| 2026-02-18 | 13F | Vident Advisory, LLC | 26.452 | -5,97 | 2.452 | -8,03 | ||||
| 2026-02-13 | 13F | Rhumbline Advisers | 3.997 | 26,49 | 371 | 23,75 | ||||
| 2026-02-09 | 13F | Systematic Financial Management Lp | 582.826 | -0,93 | 54.028 | -3,14 | ||||
| 2026-02-17 | 13F | Ardsley Advisory Partners Lp | 0 | -100,00 | 0 | |||||
| 2026-02-11 | 13F | Heartland Advisors Inc | 272.398 | -23,43 | 25.251 | -25,14 | ||||
| 2026-02-11 | 13F | Group One Trading, L.p. | Put | 15.300 | -32,00 | 1.418 | -33,52 | |||
| 2026-02-17 | 13F | Wiley Bros.-aintree Capital, Llc | 13.620 | 0,15 | 1.263 | -2,09 | ||||
| 2026-01-20 | 13F | Stratos Wealth Partners, LTD. | 2.290 | 1,42 | 212 | -0,93 | ||||
| 2026-02-17 | 13F | Osterweis Capital Management Inc | 5.222 | 45,14 | ||||||
| 2026-02-11 | 13F | Group One Trading, L.p. | Call | 31.400 | -73,70 | 2.911 | -74,29 | |||
| 2026-02-05 | 13F | Atria Investments Llc | 3.642 | -3,14 | 338 | -5,34 | ||||
| 2026-02-10 | 13F | Clear Harbor Asset Management, LLC | 0 | -100,00 | 0 | |||||
| 2026-02-13 | 13F | Arrowstreet Capital, Limited Partnership | 200.476 | 132,27 | 18.584 | 127,10 | ||||
| 2026-02-13 | 13F | Van Eck Associates Corp | 31.180 | -2,52 | 3 | -33,33 | ||||
| 2026-03-05 | 13F | Bayban | 25 | 2 | ||||||
| 2026-04-08 | 13F | Canandaigua National Corp | 1.815 | 204 | ||||||
| 2026-02-10 | 13F | Bnp Paribas Arbitrage, Sa | 5.351 | 92,69 | 496 | 88,59 | ||||
| 2026-02-12 | 13F | Brinker Capital Investments, LLC | 13.625 | -17,76 | 1.263 | -19,55 | ||||
| 2025-11-14 | 13F | Point72 Hong Kong Ltd | 0 | -100,00 | 0 | |||||
| 2025-11-14 | 13F | Ubs Asset Management Americas Inc | 0 | -100,00 | 0 | |||||
| 2025-11-13 | 13F | Renaissance Technologies Llc | 0 | -100,00 | 0 | -100,00 | ||||
| 2026-02-17 | 13F | Pertento Partners LLP | 1.151.411 | -10,77 | 106.736 | -12,76 | ||||
| 2026-04-10 | 13F | Henry James International Management Inc. | 3.615 | 406 | ||||||
| 2026-02-13 | 13F | Lord, Abbett & Co. Llc | 994.977 | -12,31 | 92 | -14,02 | ||||
| 2026-02-10 | 13F | Quantbot Technologies LP | 1 | 0 | ||||||
| 2026-02-17 | 13F | Apis Capital Advisors, LLC | 214.080 | -25,15 | 19.845 | -26,81 | ||||
| 2026-02-09 | 13F | Legal & General Group Plc | 7.470 | -10,42 | 692 | -12,41 | ||||
| 2026-02-13 | 13F | Herald Investment Management Ltd | 384.906 | 0,00 | 35.642 | -2,07 | ||||
| 2025-10-21 | 13F | McElhenny Sheffield Capital Management, LLC | 0 | -100,00 | 0 | -100,00 | ||||
| 2025-11-12 | 13F | Cambridge Investment Research Advisors, Inc. | 0 | -100,00 | 0 | |||||
| 2026-02-13 | 13F | Heights Point Management, LP | 34.770 | 3.223 | ||||||
| 2025-11-14 | 13F | Knightsbridge Asset Management, Llc | 101.105 | -1,85 | 9.585 | 24,05 | ||||
| 2026-02-13 | 13F/A | Alberta Investment Management Corp | 0 | -100,00 | 0 | |||||
| 2026-02-17 | 13F | Concentric Capital Strategies, LP | 69.044 | -30,18 | 6.400 | -31,74 | ||||
| 2026-02-06 | 13F | Gsa Capital Partners Llp | 9.991 | 119,05 | 1 | |||||
| 2026-02-05 | 13F | Td Private Client Wealth Llc | 814 | -3,33 | 75 | -5,06 | ||||
| 2026-02-10 | 13F/A | Northwestern Mutual Wealth Management Co | 284 | 3,65 | 26 | 4,00 | ||||
| 2026-02-13 | 13F | First Trust Advisors Lp | 41.719 | -5,10 | 3.867 | -7,20 | ||||
| 2025-11-14 | 13F | LMR Partners LLP | 0 | -100,00 | 0 | -100,00 | ||||
| 2026-02-13 | 13F | Brian Low Financial Group, Llc | 9.403 | 872 | ||||||
| 2026-02-13 | 13F | Walleye Capital LLC | Call | 1.000 | 93 | |||||
| 2026-02-13 | 13F | Walleye Capital LLC | Put | 1.600 | 148 | |||||
| 2025-10-27 | 13F | First Horizon Corp | 0 | -100,00 | 0 | |||||
| 2026-02-13 | 13F | Solstein Capital, LLC | 300 | 0,00 | 28 | -3,57 | ||||
| 2026-02-13 | 13F | Walleye Capital LLC | 70.743 | 6.558 | ||||||
| 2026-02-13 | 13F | Headlands Technologies LLC | 4.294 | 398 | ||||||
| 2026-01-26 | 13F | Merit Financial Group, LLC | 3.506 | -0,93 | 325 | -2,99 | ||||
| 2026-02-17 | 13F | Citadel Advisors Llc | Put | 27.700 | 50,54 | 2.568 | 47,19 | |||
| 2026-02-17 | 13F | XTX Topco Ltd | 31.855 | 2.953 | ||||||
| 2025-11-14 | 13F | Manatuck Hill Partners, LLC | 0 | -100,00 | 0 | |||||
| 2026-02-17 | 13F | D. E. Shaw & Co., Inc. | 102.038 | 29,87 | 9.459 | 26,97 | ||||
| 2026-04-08 | 13F | Legacy Wealth Asset Management, LLC | 2.338 | 263 | ||||||
| 2026-02-17 | 13F | Citadel Advisors Llc | Call | 32.700 | -13,03 | 3.031 | -14,96 | |||
| 2025-12-09 | 13F/A | Tudor Investment Corp Et Al | Put | 0 | -100,00 | 0 | -100,00 | |||
| 2026-02-17 | 13F | Citadel Advisors Llc | 133.056 | 82,89 | 12.334 | 78,83 | ||||
| 2026-01-15 | 13F | Nisa Investment Advisors, Llc | 45 | 4 | ||||||
| 2026-01-29 | 13F | Deltec Asset Management Llc | 2.750 | 0,00 | 255 | -2,31 | ||||
| 2026-02-04 | 13F | Schwartz Investment Counsel Inc | 220.000 | 0,00 | 20.394 | -2,22 | ||||
| 2026-01-20 | 13F | Harbor Capital Advisors, Inc. | 68.556 | 1,92 | 6 | 0,00 | ||||
| 2026-02-17 | 13F | Wellington Management Group Llp | 696.999 | 0,15 | 64.612 | -2,08 | ||||
| 2026-02-06 | 13F | Vestmark Advisory Solutions, Inc. | 13.472 | 1.249 | ||||||
| 2026-01-28 | 13F | Oversea-Chinese Banking CORP Ltd | 75.707 | 7.014 | ||||||
| 2026-02-11 | 13F | Ramirez Asset Management, Inc. | 31.604 | 2.930 | ||||||
| 2026-02-17 | 13F | Harvest Management Llc | 5.000 | 0,00 | 464 | -2,32 | ||||
| 2026-02-10 | 13F | Nomura Asset Management Co Ltd | 0 | 0 | ||||||
| 2026-02-13 | 13F | Mml Investors Services, Llc | 3.887 | 5,42 | 360 | 3,15 | ||||
| 2026-02-13 | 13F | Cramer Rosenthal Mcglynn Llc | 143.604 | 13.312 | ||||||
| 2026-02-10 | 13F | Natixis Advisors, L.p. | 0 | -100,00 | 0 | |||||
| 2026-01-09 | 13F | SG Americas Securities, LLC | 16.290 | 44,31 | 2 | 0,00 | ||||
| 2026-02-13 | 13F | Sei Investments Co | 95.396 | 55,83 | 8.843 | 52,36 | ||||
| 2026-02-03 | 13F | F/M Investments LLC | 49.010 | -2,59 | 4.543 | -4,76 | ||||
| 2026-02-17 | 13F | Cetera Investment Advisers | 2.411 | -2,39 | 223 | -4,70 | ||||
| 2026-02-13 | 13F | Boston Partners | 383.801 | -28,85 | 35.590 | -30,41 | ||||
| 2026-02-17 | 13F | Balyasny Asset Management Llc | 142.561 | 11,98 | 13.215 | 9,50 | ||||
| 2026-02-17 | 13F | Grantham, Mayo, Van Otterloo & Co. LLC | 16.100 | 0,00 | 1.492 | -2,23 | ||||
| 2025-11-14 | 13F | Point72 Asia (Singapore) Pte. Ltd. | 21.188 | 2.009 | ||||||
| 2026-02-17 | 13F | Qube Research & Technologies Ltd | 95.389 | 8.843 | ||||||
| 2026-02-14 | 13F | Rockefeller Capital Management L.P. | 6.068 | 25,37 | 563 | 22,71 | ||||
| 2026-02-11 | 13F | Jpmorgan Chase & Co | 17.494 | 102,62 | 1.622 | 98,17 | ||||
| 2026-02-10 | 13F | State of Wyoming | 5.045 | 63,59 | 468 | 59,93 | ||||
| 2026-02-13 | 13F | SRS Capital Advisors, Inc. | 446 | 220,86 | 41 | 215,38 | ||||
| 2026-04-07 | 13F | Farther Finance Advisors, LLC | 743 | -68,69 | 87 | -60,73 | ||||
| 2026-02-17 | 13F | SummitTX Capital, L.P. | 64.069 | -34,67 | 5.939 | -36,12 | ||||
| 2026-02-06 | 13F | Kilter Group LLC | 0 | -100,00 | 0 | |||||
| 2026-02-03 | 13F | Ballentine Partners, LLC | 4.006 | 2,82 | 371 | 0,54 | ||||
| 2026-02-13 | 13F | Pinpoint Asset Management (Singapore) Pte. Ltd. | 0 | -100,00 | 0 | |||||
| 2026-02-13 | 13F | Macquarie Group Ltd | 0 | -100,00 | 0 | |||||
| 2026-01-27 | 13F | Cannon Global Investment Management, LLC | 0 | -100,00 | 0 | |||||
| 2026-02-06 | 13F | Pnc Financial Services Group, Inc. | 5.298 | 0,00 | 491 | -2,19 | ||||
| 2026-02-17 | 13F | Numerai GP LLC | 2.309 | 214 | ||||||
| 2025-11-14 | 13F | Peak6 Llc | Call | 0 | -100,00 | 0 | -100,00 | |||
| 2026-02-13 | 13F | Wolf Hill Capital Management, LP | 581.370 | 53.893 | ||||||
| 2026-02-17 | 13F | Tower Research Capital LLC (TRC) | 248 | 23 | ||||||
| 2025-11-12 | 13F | NewSquare Capital LLC | 0 | -100,00 | 0 | -100,00 | ||||
| 2026-02-13 | 13F | Schroder Investment Management Group | 37.720 | 541,82 | 3.412 | 519,24 | ||||
| 2026-01-29 | 13F | Sanctuary Advisors, LLC | 4.331 | 4,01 | 401 | 1,78 | ||||
| 2026-02-17 | 13F | Lombard Odier Asset Management (USA) Corp | 7.757 | -44,45 | 719 | -45,69 | ||||
| 2026-02-13 | 13F | JustInvest LLC | 8.523 | -3,19 | 790 | -5,28 | ||||
| 2026-02-02 | 13F | Oppenheimer Asset Management Inc. | 11.724 | -7,90 | 1.087 | -9,95 | ||||
| 2026-02-09 | 13F | Employees Retirement System of Texas | 13.285 | 0,00 | 1 | 0,00 | ||||
| 2026-01-22 | 13F | HHM Wealth Advisors, LLC | 640 | 0,00 | 59 | -1,67 | ||||
| 2026-02-11 | 13F | LPL Financial LLC | 11.649 | 0,03 | 1.080 | -2,26 | ||||
| 2026-02-13 | 13F | Entropy Technologies, LP | 6.600 | 612 | ||||||
| 2026-02-17 | 13F | Guggenheim Capital Llc | 11.703 | 1.085 | ||||||
| 2026-02-05 | 13F | Allworth Financial LP | 188 | 64,91 | 17 | 70,00 | ||||
| 2026-02-17 | 13F | Prospect Capital Advisors, LLC | 88.350 | 0,00 | 8.190 | -2,22 | ||||
| 2026-02-13 | 13F | Morgan Stanley | 264.858 | 48,67 | 24.553 | 45,36 | ||||
| 2026-02-17 | 13F | Summit Partners Public Asset Management, Llc | 534.932 | -4,13 | 49.588 | -6,27 | ||||
| 2026-02-17 | 13F | Delaware Management Holdings, Inc. | 109.060 | 10.110 | ||||||
| 2026-02-17 | 13F | Engineers Gate Manager LP | 8.494 | 787 | ||||||
| 2026-04-09 | 13F | Diversified Management Inc | 1.818 | 204 | ||||||
| 2025-11-14 | 13F | Marex Group plc | 0 | -100,00 | 0 | -100,00 | ||||
| 2026-02-17 | 13F | Capitolis Liquid Global Markets LLC | 83.900 | 7.778 | ||||||
| 2026-02-17 | 13F | Advisory Services Network, LLC | 0 | -100,00 | 0 | |||||
| 2026-02-17 | 13F | Frontier Capital Management Co Llc | 511.471 | -50,97 | 47.413 | -52,06 | ||||
| 2026-02-11 | 13F | Renaissance Group Llc | 11.666 | -26,60 | 1.081 | -28,22 | ||||
| 2026-01-23 | 13F | Assetmark, Inc | 2.751 | 12,06 | 255 | 9,91 | ||||
| 2026-02-04 | 13F | Naples Global Advisors, Llc | 17.445 | -2,76 | 1.617 | -4,88 | ||||
| 2026-02-12 | 13F | Oak Associates Ltd /oh/ | 32.294 | -1,79 | 2.994 | 99.666,67 | ||||
| 2026-02-12 | 13F | Advisors Asset Management, Inc. | 3.785 | 342,69 | 351 | 332,10 | ||||
| 2025-11-14 | 13F | Strategic Wealth Partners, Ltd. | 1.458 | 0,00 | 138 | 26,61 | ||||
| 2026-02-04 | 13F | LRI Investments, LLC | 2.374 | -5,27 | 220 | -7,17 | ||||
| 2026-03-09 | 13F/A | CI Private Wealth, LLC | 3.036 | -10,50 | 281 | -12,46 | ||||
| 2026-01-14 | 13F | MeadowBrook Investment Advisors LLC | 770 | 71 | ||||||
| 2026-02-17 | 13F | Driehaus Capital Management Llc | 319.624 | -3,41 | 29.629 | -5,56 | ||||
| 2026-02-06 | 13F | GPS Wealth Strategies Group, LLC | 0 | -100,00 | 0 | |||||
| 2025-11-12 | 13F | GABELLI & Co INVESTMENT ADVISERS, INC. | 0 | -100,00 | 0 | |||||
| 2026-02-09 | 13F | Geode Capital Management, Llc | 43.901 | 5,98 | 4.070 | 3,62 | ||||
| 2026-02-11 | 13F | Janney Montgomery Scott LLC | 88.775 | 0,16 | 8 | 0,00 | ||||
| 2026-02-02 | 13F | Truist Financial Corp | 2.377 | 11,18 | 220 | 8,91 | ||||
| 2026-01-27 | 13F | WealthCollab, LLC | 346 | 77,44 | 32 | 77,78 | ||||
| 2025-11-12 | 13F | Gabelli Funds Llc | 0 | -100,00 | 0 | |||||
| 2026-01-29 | 13F | Quent Capital, LLC | 3.000 | 278 | ||||||
| 2026-02-12 | 13F | Highland Peak Capital, LLC | 0 | -100,00 | 0 | |||||
| 2026-04-14 | 13F | Opal Wealth Advisors, LLC | 272 | 31 | ||||||
| 2025-11-14 | 13F | Wolverine Trading, Llc | Call | 3.600 | -5,26 | 338 | 17,42 | |||
| 2026-01-21 | 13F | Westfuller Advisors, LLC | 22 | 0,00 | 2 | 0,00 | ||||
| 2026-04-13 | 13F | Reinhart Partners, Inc. | 1.314.039 | -16,48 | 147.555 | 1,17 | ||||
| 2026-02-17 | 13F | Two Sigma Investments, Lp | Put | 2.800 | 260 | |||||
| 2026-02-13 | 13F | Glen Eagle Advisors, LLC | 18 | 0,00 | 2 | 0,00 | ||||
| 2026-02-17 | 13F | Two Sigma Investments, Lp | Call | 4.700 | 436 | |||||
| 2026-02-13 | 13F | Aviso Wealth Management | 5.138 | -5,53 | 476 | -7,57 | ||||
| 2026-02-12 | 13F | Rossby Financial, LCC | 2 | 0,00 | 0 | |||||
| 2026-02-03 | 13F | SBI Securities Co., Ltd. | 72 | 94,59 | 7 | 100,00 | ||||
| 2026-02-12 | 13F | Commonwealth Equity Services, Llc | 7.798 | -1,58 | 723 | |||||
| 2026-02-17 | 13F | Lazard Asset Management Llc | 758.578 | -3,20 | 70.320 | -5,36 | ||||
| 2025-11-14 | 13F | Shay Capital LLC | 0 | -100,00 | 0 | -100,00 | ||||
| 2026-02-17 | 13F | Oddo Bhf Asset Management Sas | 192.500 | -11,49 | 17.845 | -13,47 | ||||
| 2026-04-09 | 13F | Tealwood Asset Management Inc | 17.157 | -0,84 | 2 | 0,00 | ||||
| 2026-02-17 | 13F | Monolith Management Ltd | 0 | -100,00 | 0 | |||||
| 2026-01-22 | 13F | Financial Consulate, Inc | 107 | 0,00 | 10 | -10,00 | ||||
| 2026-02-05 | 13F | Alpine Associates Management Inc. | 79.976 | -67,68 | 7.414 | -68,40 | ||||
| 2026-02-03 | 13F | NewEdge Wealth, LLC | 2.631 | 3,58 | 244 | -2,80 | ||||
| 2026-02-13 | 13F | SG Capital Management LLC | 90.411 | 8.381 | ||||||
| 2026-02-12 | 13F | Jane Street Group, Llc | 79.390 | 7.359 | ||||||
| 2025-11-12 | 13F/A | Norges Bank | 190.000 | 336,34 | 11.541 | 227,28 | ||||
| 2026-01-12 | 13F | CVA Family Office, LLC | 1.054 | 0,00 | 98 | -2,02 | ||||
| 2026-01-23 | 13F | Westside Investment Management, Inc. | 395 | 0,00 | 37 | -2,70 | ||||
| 2026-02-12 | 13F | Jane Street Group, Llc | Put | 29.600 | -11,64 | 2.744 | -13,63 | |||
| 2026-02-06 | 13F | EverSource Wealth Advisors, LLC | 648 | 3,02 | 60 | 1,69 | ||||
| 2026-02-12 | 13F | Jane Street Group, Llc | Call | 58.100 | -55,41 | 5.386 | -56,41 | |||
| 2026-02-11 | 13F | Deutsche Bank Ag\ | 67.900 | 6.294 | ||||||
| 2026-02-13 | 13F | Kestra Advisory Services, LLC | 1.608 | 149 | ||||||
| 2026-02-13 | 13F | Transamerica Financial Advisors, Inc. | 15 | 1 | ||||||
| 2025-10-31 | 13F | Whittier Trust Co | 0 | -100,00 | 0 | |||||
| 2026-02-09 | 13F | Penn Capital Management Co Inc | 4.970 | -14,62 | 461 | -16,52 | ||||
| 2026-04-14 | 13F | Beacon Investment Advisory Services, Inc. | 300 | 34 | ||||||
| 2026-02-13 | 13F | Victory Capital Management Inc | 19.350 | 0,00 | 1.794 | -2,24 | ||||
| 2026-01-14 | 13F | Tradewinds Capital Management, LLC | 215 | -48,19 | 20 | -51,28 | ||||
| 2026-02-17 | 13F | Two Sigma Investments, Lp | 379.837 | 390,99 | 35.211 | 380,09 | ||||
| 2026-02-13 | 13F | Manufacturers Life Insurance Company, The | 0 | -100,00 | 0 | |||||
| 2026-02-17 | 13F | Russell Investments Group, Ltd. | 198.737 | -19,02 | 18.251 | -21,27 | ||||
| 2026-04-14 | 13F | Congress Asset Management Co /ma | 20.674 | 2.321 | ||||||
| 2026-02-12 | 13F | CIBC Private Wealth Group, LLC | 110 | 0,00 | 10 | 0,00 | ||||
| 2026-02-13 | 13F | Wells Fargo & Company/mn | 66.721 | 1,56 | 6.185 | -0,69 | ||||
| 2026-02-10 | 13F | Commonwealth Of Pennsylvania Public School Empls Retrmt Sys | 3.837 | 0,00 | 356 | -2,20 | ||||
| 2026-02-12 | 13F | Barometer Capital Management Inc. | 0 | -100,00 | 0 | |||||
| 2026-02-13 | 13F | Verition Fund Management LLC | 4.463 | 414 | ||||||
| 2026-02-04 | 13F | First Eagle Investment Management, LLC | 153.519 | 2,01 | 14.231 | -0,25 | ||||
| 2026-02-13 | 13F | Centiva Capital, LP | 2.500 | -60,79 | 232 | -61,75 | ||||
| 2026-02-17 | 13F | Ophir Asset Management Pty Ltd | 467.564 | -7,50 | 43.343 | -9,56 | ||||
| 2026-01-23 | 13F | Robeco Institutional Asset Management B.V. | 623.953 | 40,93 | 57.840 | 37,79 | ||||
| 2026-02-10 | 13F | Acadian Asset Management Llc | 1.279.087 | -1,73 | 119 | -4,07 | ||||
| 2026-01-29 | 13F | UBS Group AG | 351.541 | 38,95 | 32.588 | 35,86 | ||||
| 2026-02-17 | 13F | CastleKnight Management LP | Call | 13.700 | 1.270 | |||||
| 2026-02-12 | 13F | Wedbush Securities Inc | 4.685 | 1,72 | 0 | |||||
| 2026-02-17 | 13F | CastleKnight Management LP | 82.236 | 7.623 | ||||||
| 2026-02-17 | 13F | Two Sigma Advisers, Lp | 124.681 | 437,86 | 11.558 | 426,04 | ||||
| 2026-02-13 | 13F | Fifth Lane Capital, Lp | Put | 1.000 | 93 | |||||
| 2026-02-13 | 13F | Kennedy Capital Management, Inc. | 22.373 | 1,15 | 2.074 | -1,14 | ||||
| 2026-02-13 | 13F | Barclays Plc | 419 | -75,61 | 39 | -76,54 | ||||
| 2025-11-14 | 13F | Susquehanna International Group, Llp | 0 | -100,00 | 0 | -100,00 | ||||
| 2026-02-17 | 13F | Boothbay Fund Management, Llc | 63.081 | 29,80 | 5.848 | 26,92 | ||||
| 2026-02-13 | 13F | Arkadios Wealth Advisors | 4.326 | 55,39 | 401 | 52,47 | ||||
| 2026-02-17 | 13F | Ameriprise Financial Inc | Put | 0 | -100,00 | 0 | -100,00 | |||
| 2026-02-11 | 13F | CSM Advisors, LLC | 3.984 | 87,04 | 0 | |||||
| 2026-02-17 | 13F | Point72 Asset Management, L.P. | 0 | -100,00 | 0 | |||||
| 2026-02-12 | 13F | Advocate Investing Services LLC | 21 | 2 | ||||||
| 2026-02-13 | 13F | Y-Intercept (Hong Kong) Ltd | 9.328 | 865 | ||||||
| 2026-01-22 | 13F | Massachusetts Financial Services Co /ma/ | 206.716 | -64,76 | 19.163 | -65,55 | ||||
| 2026-02-10 | 13F | Bank of New York Mellon Corp | 4.212 | -2,88 | 390 | -5,11 | ||||
| 2026-02-11 | 13F | Fox Run Management, L.l.c. | 7.047 | 653 | ||||||
| 2026-02-17 | 13F | Ameriprise Financial Inc | 36.734 | -25,40 | 3.405 | -27,06 | ||||
| 2026-02-10 | 13F | Envestnet Asset Management Inc | 88.016 | -19,95 | 8.159 | -21,73 | ||||
| 2026-02-04 | 13F | Pacer Advisors, Inc. | 0 | -100,00 | 0 | |||||
| 2026-02-11 | 13F | Neumeier Poma Investment Counsel Llc | 481.818 | 0,70 | 44.665 | -1,54 | ||||
| 2026-02-17 | 13F | Susquehanna International Group, Llp | Put | 74.300 | -40,27 | 6.888 | -41,61 | |||
| 2026-02-13 | 13F | Smartleaf Asset Management LLC | 6 | -92,00 | 1 | -100,00 | ||||
| 2026-02-13 | 13F | Colony Group, LLC | 7.181 | 0,96 | 681 | 0,89 | ||||
| 2026-02-17 | 13F | Granahan Investment Management Inc/ma | 229.129 | 10,29 | 21.240 | 7,83 | ||||
| 2026-02-17 | 13F | Raymond James Financial Inc | 38.963 | 3.612 | ||||||
| 2026-02-17 | 13F | Susquehanna International Group, Llp | Call | 102.300 | -37,81 | 9.483 | -39,20 | |||
| 2026-02-17 | 13F | Tudor Investment Corp Et Al | Call | 2.500 | 232 | |||||
| 2025-11-14 | 13F | Mount Yale Investment Advisors, LLC | 0 | -100,00 | 0 | -100,00 | ||||
| 2026-04-06 | 13F | GAMMA Investing LLC | 1.252 | 11,89 | 141 | 35,92 | ||||
| 2026-04-07 | 13F | Signaturefd, Llc | 1.554 | 2,44 | 174 | 24,29 | ||||
| 2026-02-17 | 13F | Public Employees Retirement System Of Ohio | 41.152 | 0,00 | 3.815 | -2,23 | ||||
| 2026-03-24 | 13F/A | Barclays Plc | Call | 0 | -100,00 | 0 | -100,00 | |||
| 2026-02-17 | 13F | Fmr Llc | 3.398.367 | 0,00 | 315.029 | -2,23 | ||||
| 2026-02-17 | 13F | Millennium Management Llc | 147.030 | -31,03 | 13.630 | -32,57 | ||||
| 2026-02-06 | 13F | Handelsbanken Fonder AB | 10.000 | -3,85 | 1 | |||||
| 2026-02-12 | 13F | Brown Brothers Harriman & Co | 85 | -68,52 | 8 | -72,00 | ||||
| 2026-02-12 | 13F | Hrt Financial Lp | 0 | -100,00 | 0 | |||||
| 2026-02-17 | 13F | Cinctive Capital Management LP | 0 | -100,00 | 0 | |||||
| 2026-02-13 | 13F | Mariner, LLC | 3.131 | -0,48 | 290 | -2,68 | ||||
| 2026-02-17 | 13F | Black Maple Capital Management LP | 7.300 | 677 | ||||||
| 2026-02-17 | 13F | Voloridge Investment Management, Llc | 112.458 | 10.425 | ||||||
| 2026-02-10 | 13F | 1492 Capital Management LLC | 41.696 | 3,29 | 3.865 | 0,99 | ||||
| 2026-02-17 | 13F | Hawk Ridge Capital Management Lp | 787.747 | 111,34 | 73.024 | 106,63 | ||||
| 2026-02-12 | 13F | Quadrant Capital Group Llc | 14.600 | -21,43 | 1.353 | -23,17 | ||||
| 2026-02-13 | 13F | Stifel Financial Corp | 9.662 | -1,33 | 896 | -3,56 | ||||
| 2026-04-13 | 13F | Mather Group, Llc. | 49 | 6 | ||||||
| 2026-02-17 | 13F | Fund 1 Investments, LLC | 0 | -100,00 | 0 | |||||
| 2025-11-12 | 13F | Simplex Trading, Llc | 0 | -100,00 | 0 | |||||
| 2026-02-13 | 13F | Diametric Capital, LP | 24.365 | 118,13 | 2.259 | 113,22 | ||||
| 2026-02-11 | 13F | Cerity Partners LLC | 21.654 | -3,00 | 2.007 | -5,15 | ||||
| 2026-01-09 | 13F | Diversified Trust Co | 8.628 | -0,07 | 800 | -2,32 | ||||
| 2026-02-13 | 13F | Cornerstone Financial Management LLC | 37 | 3 |
Other Listings
| DE:S9M | 110,00 € |