Grundlæggende statistik
| Institutionelle ejere | 232 total, 232 long only, 0 short only, 0 long/short - change of 2,19% MRQ |
| Gennemsnitlig porteføljeallokering | 0.3589 % - change of -4,20% MRQ |
| Institutionelle aktier (lange) | 72.270.525 (ex 13D/G) - change of 0,88MM shares 1,24% MRQ |
| Institutionel værdi (lang) | $ 2.368.132 USD ($1000) |
Institutionelt ejerskab og aktionærer
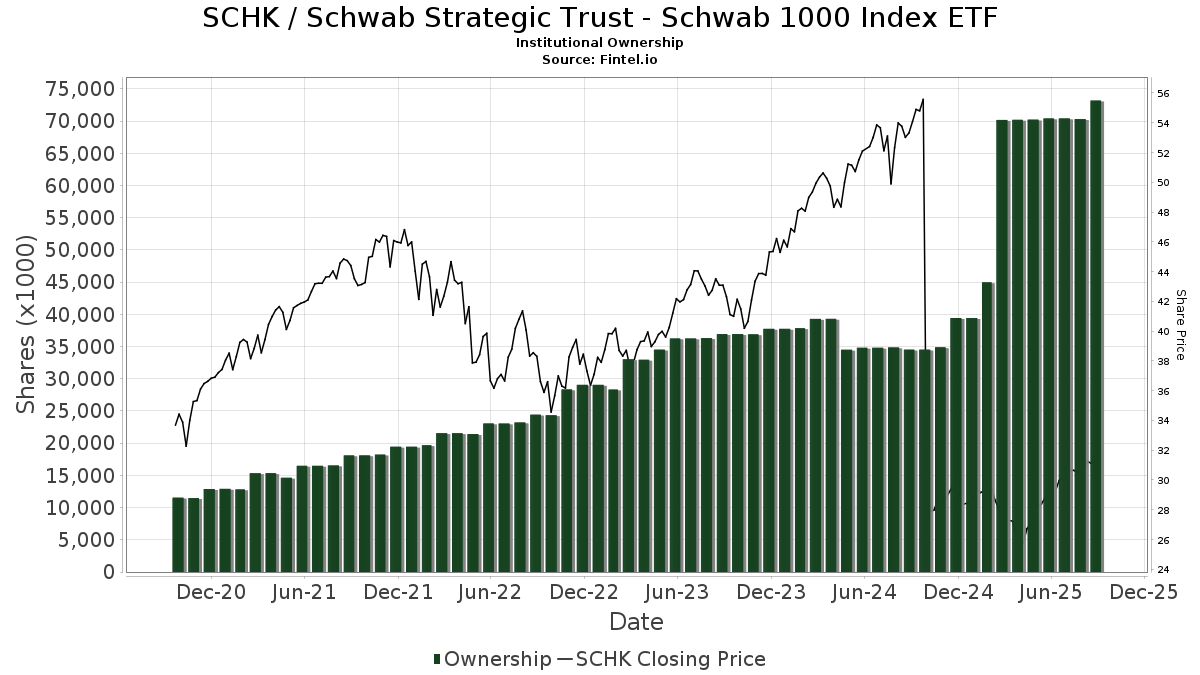
Schwab Strategic Trust - Schwab 1000 Index ETF (US:SCHK) har 232 institutionelle ejere og aktionærer, der har indsendt 13D/G- eller 13F-formularer til Securities Exchange Commission (SEC). Disse institutioner har i alt 72,270,525 aktier. Største aktionærer omfatter Financial Engines Advisors L.L.C., Legacy Wealth Management, Inc, Warwick Investment Management, Inc., Charles Schwab Investment Management Inc, Creative Planning, Armstrong Advisory Group, Inc, Waddell & Associates, Llc, Plum Street Advisors, LLC, Colony Group, LLC, and Main Street Financial Solutions, LLC .
Schwab Strategic Trust - Schwab 1000 Index ETF (ARCA:SCHK) institutionel ejerskabsstruktur viser aktuelle positioner i virksomheden efter institutioner og fonde, samt seneste ændringer i positionsstørrelse. Større aktionærer kan omfatte individuelle investorer, investeringsforeninger, hedgefonde eller institutioner. Skema 13D angiver, at investoren besidder (eller besidder) mere end 5 % af virksomheden og har til hensigt (eller har til hensigt at) aktivt at forfølge en ændring i forretningsstrategi. Skema 13G indikerer en passiv investering på over 5%.
The share price as of March 11, 2026 is 32,54 / share. Previously, on March 12, 2025, the share price was 26,91 / share. This represents an increase of 20,92% over that period.
Fondens stemningsscore
Fund Sentiment Score (fka Ownership Accumulation Score) finder de aktier, der bliver mest købt af fonde. Det er resultatet af en sofistikeret, multi-faktor kvantitativ model, der identificerer virksomheder med de højeste niveauer af institutionel akkumulering. Scoringsmodellen bruger en kombination af den samlede stigning i oplyste ejere, ændringerne i porteføljeallokeringer i disse ejere og andre målinger. Tallet går fra 0 til 100, hvor højere tal indikerer et højere niveau af akkumulering for sine jævnaldrende, og 50 er gennemsnittet.
Opdateringsfrekvens: Dagligt
Se Ownership Explorer, som giver en liste over højest rangerende virksomheder.
AI+ Ask Fintel’s AI assistant about Schwab Strategic Trust - Schwab 1000 Index ETF.
Select a question to share a public post with an AI-crafted answer.
Thinking of good questions…
Institutionel Put/Call-forhold
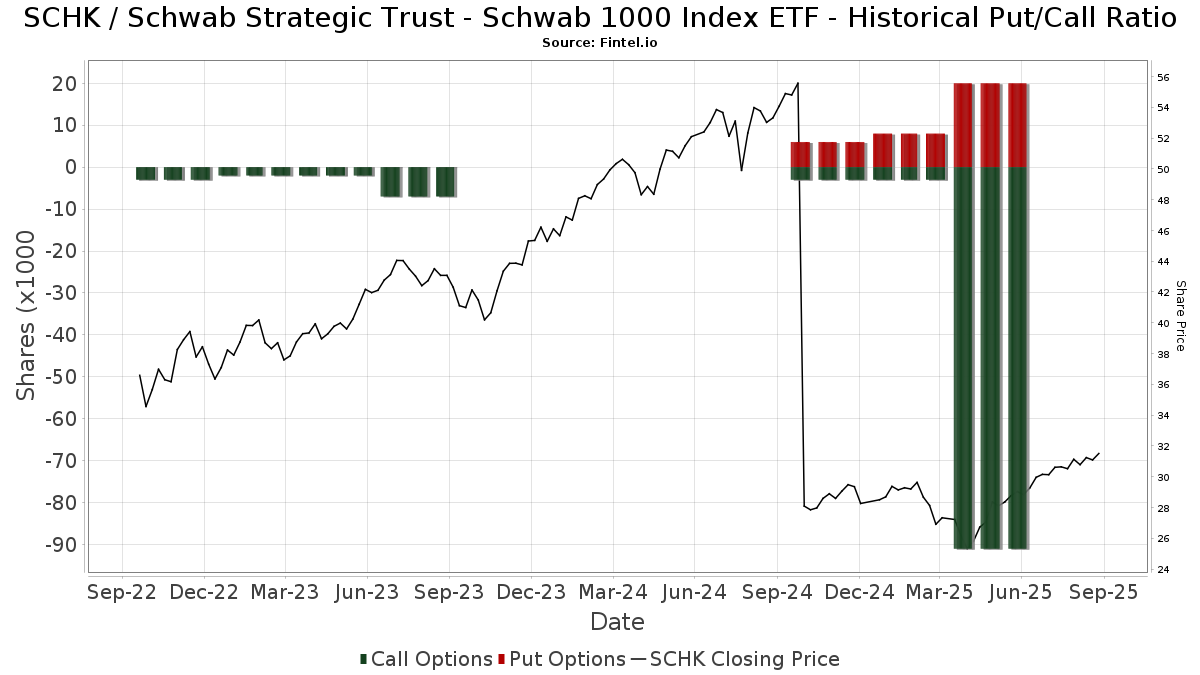
Ud over at indberette standardaktie- og gældsudstedelser skal institutter med mere end 100 mill. aktiver under forvaltning også oplyse deres put- og call-optionsbeholdninger. Da salgsoptioner generelt indikerer negativ stemning, og købsoptioner indikerer positiv stemning, kan vi få en fornemmelse af den overordnede institutionelle stemning ved at plotte forholdet mellem put og kald. Diagrammet til højre viser det historiske put/call-forhold for dette instrument.
Brug af Put/Call Ratio som en indikator for investorernes stemning overvinder en af de vigtigste mangler ved at bruge totalt institutionelt ejerskab, som er, at en betydelig mængde af aktiver under forvaltning investeres passivt for at spore indekser. Passivt forvaltede fonde køber typisk ikke optioner, så indikatoren for put/call-forholdet følger mere nøje følelsen af aktivt forvaltede fonde.
13F og NPORT arkivering
Detaljer om 13F-arkivering er gratis. Detaljer om NP-ansøgninger kræver et premium-medlemskab. Grønne rækker angiver nye positioner. Røde rækker angiver lukkede positioner. Klik på linket ikon for at se den fulde transaktionshistorik.
Opgrader
for at låse premium-data op og eksportere til Excel ![]() .
.
| Fil dato | Kilde | Investor | Type | Gennemsnitlig pris (Øst) |
Aktier | Δ Aktier (%) |
Rapporteret Værdi ($1000) |
Δ Værdi (%) |
Port Alloc (%) |
|
|---|---|---|---|---|---|---|---|---|---|---|
| 2026-01-21 | 13F | Prime Capital Investment Advisors, LLC | 24.827 | 0,02 | 814 | 2,13 | ||||
| 2026-01-28 | 13F | Old National Bancorp /in/ | 23.064 | 0,00 | 756 | 2,16 | ||||
| 2026-01-29 | 13F | Comerica Bank | 19.122 | -0,88 | 627 | 1,29 | ||||
| 2026-01-15 | 13F | Ironwood Financial, llc | 8.752 | 0,00 | 293 | 4,27 | ||||
| 2026-01-30 | 13F | Richardson Capital Management LLC | 45.885 | -36,97 | 1.505 | -35,63 | ||||
| 2026-02-18 | 13F | GWM Advisors LLC | 1.690 | -42,56 | 55 | -41,49 | ||||
| 2026-02-12 | 13F | Principal Securities, Inc. | 0 | -100,00 | 0 | |||||
| 2026-02-17 | 13F | Raymond James Financial Inc | 45.332 | -2,05 | 1.487 | 0,00 | ||||
| 2026-02-17 | 13F | Royal Bank Of Canada | 11.318 | 12,46 | 371 | 14,86 | ||||
| 2026-02-17 | 13F | Main Street Financial Solutions, LLC | 413.934 | 0,63 | 13.577 | 2,76 | ||||
| 2026-02-10 | 13F | Verity & Verity, LLC | 13.201 | 0,00 | 433 | 1,89 | ||||
| 2025-11-14 | 13F | Blue Barn Wealth, LLC | 0 | -100,00 | 0 | |||||
| 2026-02-13 | 13F | Smartleaf Asset Management LLC | 440 | 15 | ||||||
| 2026-02-13 | 13F | Colony Group, LLC | 477.310 | -0,13 | 15.656 | 1,98 | ||||
| 2026-02-17 | 13F | Strive Financial Group ,LLC | 2.150 | 71 | ||||||
| 2026-02-13 | 13F | Element Wealth, LLC | 6.504 | 0,00 | 213 | 2,40 | ||||
| 2026-01-22 | 13F | Brookwood Investment Group LLC | 42.506 | -1,18 | 1.394 | 0,94 | ||||
| 2026-02-17 | 13F | Tudor Investment Corp Et Al | 6.735 | 221 | ||||||
| 2026-02-06 | 13F | Associated Banc-corp | 15.838 | 0,00 | 519 | 2,17 | ||||
| 2026-01-23 | 13F | Farther Finance Advisors, LLC | 24.912 | 119,64 | 817 | 124,45 | ||||
| 2026-01-21 | 13F | Legacy Wealth Management, Inc | 6.117.568 | -3,84 | 200.656 | -1,80 | ||||
| 2026-02-18 | 13F | EP Wealth Advisors, Inc. | 6.440 | 211 | ||||||
| 2026-02-17 | 13F | Creative Planning | 3.134.187 | 0,04 | 102.801 | 2,15 | ||||
| 2026-02-13 | 13F | Stifel Financial Corp | 33.316 | 15,62 | 1.093 | 18,05 | ||||
| 2026-01-21 | 13F | Flagship Harbor Advisors, Llc | 103 | 3 | ||||||
| 2026-02-12 | 13F | Renaissance Technologies Llc | 50.800 | -54,48 | 1.666 | -53,52 | ||||
| 2026-02-13 | 13F | Integrated Wealth Concepts LLC | 6.408 | -24,74 | 210 | -23,08 | ||||
| 2026-01-13 | 13F | SMI Advisory Services, LLC | 19.574 | -0,06 | 656 | 3,64 | ||||
| 2026-01-05 | 13F | GAMMA Investing LLC | 18.364 | 0,00 | 602 | 2,21 | ||||
| 2025-11-14 | 13F | Imprint Wealth LLC | 0 | -100,00 | 0 | -100,00 | ||||
| 2026-01-28 | 13F | Glassman Wealth Services | 0 | -100,00 | 0 | |||||
| 2026-01-20 | 13F | Signaturefd, Llc | 301 | 0,00 | 10 | 0,00 | ||||
| 2026-02-11 | 13F | Cerity Partners LLC | 118.305 | 4,01 | 3.880 | 6,21 | ||||
| 2026-02-03 | 13F | Costello Asset Management, INC | 817 | -47,96 | 27 | -48,00 | ||||
| 2026-02-11 | 13F | Waddell & Associates, Llc | 2.071.165 | 1,02 | 67.934 | 3,15 | ||||
| 2025-10-28 | 13F | Pinnacle Financial Partners Inc | 0 | -100,00 | 0 | |||||
| 2026-01-20 | 13F | Pflug Koory, LLC | 4.850 | 0,14 | 159 | 2,58 | ||||
| 2026-01-16 | 13F | Ronald Blue Trust, Inc. | 1.500 | 149,58 | 49 | 157,89 | ||||
| 2026-02-11 | 13F | SOUTH STATE Corp | 6.320 | -27,77 | 207 | -26,33 | ||||
| 2026-02-12 | 13F | Jane Street Group, Llc | Call | 8.200 | 269 | |||||
| 2026-02-13 | 13F | Mariner, LLC | 313.584 | -0,35 | 10.286 | 1,76 | ||||
| 2026-02-13 | 13F | Aptus Capital Advisors, LLC | 79.895 | 6,35 | 2.621 | 8,58 | ||||
| 2026-02-17 | 13F | Blair William & Co/il | 6.124 | 0,00 | 201 | 2,04 | ||||
| 2025-11-13 | 13F | Promus Capital, LLC | 216 | 0,00 | 7 | 0,00 | ||||
| 2026-02-13 | 13F | Kestra Advisory Services, LLC | 0 | -100,00 | 0 | |||||
| 2026-02-10 | 13F | Envestnet Asset Management Inc | 0 | -100,00 | 0 | |||||
| 2026-01-07 | 13F | Everhart Financial Group, Inc. | 37.521 | -0,19 | 1.231 | 1,91 | ||||
| 2026-02-13 | 13F | Kilter Group LLC | 598 | 0,00 | 20 | 0,00 | ||||
| 2025-11-13 | 13F | Alamar Capital Management, LLC | 16.031 | 0,17 | 515 | 7,76 | ||||
| 2026-02-12 | 13F | Bank Of Montreal /can/ | 7.507 | 0,11 | 246 | 2,50 | ||||
| 2026-01-29 | 13F | UBS Group AG | 9.457 | 2,79 | 310 | 5,08 | ||||
| 2026-01-20 | 13F | Stratos Wealth Advisors, LLC | 16.110 | -1,00 | 528 | 1,15 | ||||
| 2026-02-17 | 13F | Cape Investment Advisory, Inc. | 100 | 3 | ||||||
| 2026-02-02 | 13F | Grantvest Financial Group LLC | 6.765 | -0,24 | 222 | 1,84 | ||||
| 2026-02-17 | 13F | Advisor Group Holdings, Inc. | 21.978 | 11,49 | 721 | 15,57 | ||||
| 2026-02-06 | 13F | Axxcess Wealth Management, Llc | 8.908 | 292 | ||||||
| 2026-02-12 | 13F | Wescott Financial Advisory Group, LLC | 90.623 | 2.972 | ||||||
| 2026-02-13 | 13F | Avant Capital LLC | 31.055 | 5,88 | 1.019 | 8,07 | ||||
| 2026-02-13 | 13F | Plum Street Advisors, LLC | 696.130 | 2,06 | 22.833 | 4,22 | ||||
| 2026-02-17 | 13F | Millennium Management Llc | 15.608 | 512 | ||||||
| 2026-01-23 | 13F | Blue Sky Capital Consultants Group, Inc. | 28.330 | 54,71 | 929 | 57,99 | ||||
| 2026-02-03 | 13F | Sequoia Financial Advisors, LLC | 8.230 | 0,02 | 270 | 1,89 | ||||
| 2026-02-17 | 13F | Fmr Llc | 81.931 | 0,04 | 2.687 | 2,17 | ||||
| 2026-01-14 | 13F | Game Plan Financial Advisors, LLC | 202 | 0,00 | 7 | 0,00 | ||||
| 2026-02-09 | 13F | HBK Sorce Advisory LLC | 124.797 | -1,35 | 4.153 | 2,24 | ||||
| 2026-02-09 | 13F | Hartland & Co., LLC | 33.854 | -0,07 | 1.110 | 2,02 | ||||
| 2026-01-30 | 13F | Trifecta Capital Advisors, LLC | 80 | 0,00 | 3 | 0,00 | ||||
| 2026-01-30 | 13F | Kohmann Bosshard Financial Services, LLC | 61.009 | 0,00 | 2.001 | 2,14 | ||||
| 2026-01-20 | 13F | Red Door Wealth Management, LLC | 9.552 | -17,99 | 313 | -16,31 | ||||
| 2026-02-02 | 13F | Miracle Mile Advisors, LLC | 8.244 | 0,00 | 270 | 2,27 | ||||
| 2026-02-12 | 13F | Financial Engines Advisors L.L.C. | 43.678.983 | -2,13 | 1.432.671 | -0,06 | ||||
| 2025-11-13 | 13F | Brown Brothers Harriman & Co | 0 | -100,00 | 0 | |||||
| 2026-01-28 | 13F | HB Wealth Management, LLC | 14.010 | 0,00 | 460 | 2,00 | ||||
| 2026-02-05 | 13F | Armor Investment Advisors, LLC | 135 | 206,82 | 4 | 300,00 | ||||
| 2026-02-24 | 13F | Bell Investment Advisors, Inc | 514 | -0,77 | 17 | 0,00 | ||||
| 2026-02-13 | 13F | MAI Capital Management | 109.220 | -1,55 | 3.582 | 0,53 | ||||
| 2026-01-12 | 13F | Sherrill & Hutchins Financial Advisory, Inc | 46.182 | 0,32 | 1.515 | 2,44 | ||||
| 2026-01-26 | 13F | Welch Group, LLC | 14.380 | 0,00 | 472 | 2,17 | ||||
| 2026-01-14 | 13F | Wolfstich Capital, LLC | 108.453 | 1.578 | ||||||
| 2026-01-26 | 13F | Cwm, Llc | 427 | -5,11 | 0 | |||||
| 2026-02-10 | 13F | Welch & Forbes Llc | 0 | -100,00 | 0 | |||||
| 2026-01-21 | 13F | Signature Resources Capital Management, LLC | 50 | 0,00 | 2 | 0,00 | ||||
| 2026-01-30 | 13F | Arlington Trust Co LLC | 1.100 | -64,52 | 36 | -63,64 | ||||
| 2026-01-21 | 13F | Kaizen Financial Strategies | 21.003 | 0,00 | 689 | 1,62 | ||||
| 2026-02-12 | 13F | FreeGulliver LLC | 77.041 | 2.527 | ||||||
| 2026-02-13 | 13F | Integrity Financial Corp /WA | 20 | 0,00 | 1 | |||||
| 2026-02-13 | 13F | Atlas Capital Advisors Llc | 954 | -55,71 | 31 | -51,56 | ||||
| 2025-09-26 | NP | BVAL - Bluemonte Large Cap Value ETF | 16 | 0 | ||||||
| 2026-02-09 | 13F | Leavell Investment Management, Inc. | 11.325 | -14,50 | 371 | -12,71 | ||||
| 2026-02-17 | 13F | Quantinno Capital Management LP | 19.850 | 167,59 | 651 | 173,53 | ||||
| 2026-02-11 | 13F | Premier Private Wealth Management LLC | 12.543 | 420 | ||||||
| 2026-02-19 | 13F | CI Private Wealth, LLC | 17.460 | 39,61 | 573 | 42,64 | ||||
| 2026-01-23 | 13F | Optima Capital Llc | 29 | 1 | ||||||
| 2026-01-15 | 13F | Lighthouse Wealth Management Inc. | 375.340 | 4,53 | 12.311 | 6,75 | ||||
| 2026-02-13 | 13F | River Wealth Advisors LLC | 19.515 | 0,00 | 640 | 2,24 | ||||
| 2026-02-04 | 13F | Atlantic Union Bankshares Corp | 1.551 | -45,56 | 51 | -45,05 | ||||
| 2026-02-06 | 13F | Larson Financial Group LLC | 0 | -100,00 | 0 | |||||
| 2025-11-10 | 13F | Choate Investment Advisors | 0 | -100,00 | 0 | |||||
| 2026-02-12 | 13F | Wealthspire Advisors, LLC | 0 | -100,00 | 0 | |||||
| 2026-02-13 | 13F | Citigroup Inc | 0 | -100,00 | 0 | |||||
| 2026-01-07 | 13F | Massmutual Trust Co Fsb/adv | 20 | 0,00 | 1 | |||||
| 2026-01-30 | 13F | Us Bancorp \de\ | 108.954 | -44,39 | 3.574 | -43,22 | ||||
| 2026-01-30 | 13F | Kiker Wealth Management, LLC | 0 | -100,00 | 0 | |||||
| 2026-02-10 | 13F | BKD Wealth Advisors, LLC | 7.979 | 0,28 | 262 | 2,35 | ||||
| 2026-01-08 | 13F | Wealth Enhancement Advisory Services, Llc | 146.261 | -0,13 | 4.879 | 3,28 | ||||
| 2026-02-13 | 13F | Charles Schwab Investment Management Inc | 3.477.532 | 118,97 | 114.063 | 123,61 | ||||
| 2026-02-11 | 13F | Parallel Advisors, LLC | 357 | 12 | ||||||
| 2026-02-13 | 13F | Venture Visionary Partners LLC | 0 | -100,00 | 0 | |||||
| 2026-01-09 | 13F | Zrc Wealth Management, Llc | 30.262 | 0,00 | 993 | 2,06 | ||||
| 2026-01-23 | 13F | Halbert Hargrove Global Advisors, Llc | 3.510 | 0,00 | 115 | 2,68 | ||||
| 2026-02-13 | 13F | National Bank Of Canada /fi/ | 2.572 | 0,00 | 84 | 2,44 | ||||
| 2026-02-17 | 13F | Susquehanna International Group, Llp | 40.540 | -33,91 | 1.330 | -32,54 | ||||
| 2026-01-15 | 13F | Bernard Wealth Management Corp. | 750 | 0,00 | 25 | 0,00 | ||||
| 2026-01-12 | 13F | ARS Wealth Advisors Group, LLC | 10.068 | 0,31 | 330 | 2,48 | ||||
| 2026-01-21 | 13F | Capital Advisors, Ltd. LLC | 1.600 | 0,00 | 0 | |||||
| 2026-02-03 | 13F | McIlrath & Eck, LLC | 3.738 | 0,00 | 123 | 1,67 | ||||
| 2026-01-08 | 13F | Armstrong Advisory Group, Inc | 2.526.887 | 4,00 | 82.882 | 6,20 | ||||
| 2026-01-16 | 13F | Dorato Capital Management | 1.200 | 40 | ||||||
| 2026-02-02 | 13F | Breakwater Investment Management | 1.174 | 0,00 | 39 | 2,70 | ||||
| 2026-02-06 | 13F | Signature Estate & Investment Advisors Llc | 205.569 | -1,23 | 6.743 | 0,87 | ||||
| 2026-01-29 | 13F | KC Investment Advisors, LLC | 16.507 | 0,30 | 541 | 0,74 | ||||
| 2026-01-16 | 13F | Crewe Advisors LLC | 17.518 | -14,56 | 575 | -12,77 | ||||
| 2026-02-26 | 13F | TD Capital Management LLC | 4.007 | -18,90 | 131 | -17,09 | ||||
| 2026-02-02 | 13F | Holistic Planning, LLC | 6.542 | 0,00 | 215 | 1,90 | ||||
| 2026-02-10 | 13F/A | Northwestern Mutual Wealth Management Co | 41.189 | -5,83 | 1.351 | -3,85 | ||||
| 2026-01-23 | 13F | Gemmer Asset Management LLC | 33.451 | 8,64 | 1.097 | 10,92 | ||||
| 2026-02-12 | 13F | Federation des caisses Desjardins du Quebec | 400 | 0,00 | 13 | 8,33 | ||||
| 2025-11-14 | 13F | Two Sigma Investments, Lp | 0 | -100,00 | 0 | -100,00 | ||||
| 2026-02-03 | 13F | Garner Asset Management Corp | 1.341 | 44 | ||||||
| 2025-11-24 | 13F | CIBC Private Wealth Group, LLC | 0 | -100,00 | 0 | -100,00 | ||||
| 2026-02-17 | 13F | D L Carlson Investment Group Inc | 17.961 | 0,30 | 589 | 2,43 | ||||
| 2026-02-17 | 13F | Claro Advisors LLC | 0 | -100,00 | 0 | |||||
| 2026-02-20 | 13F | Catalyst Investment Management LLC | 36.521 | 1.198 | ||||||
| 2026-02-03 | 13F | RFG Advisory, LLC | 45.917 | -25,95 | 1.506 | -24,36 | ||||
| 2026-02-12 | 13F | Skopos Labs, Inc. | 6.992 | 0,00 | 232 | 3,13 | ||||
| 2026-02-10 | 13F | Principia Wealth Advisory, LLC | 108.220 | 3.550 | ||||||
| 2026-01-22 | 13F | Red Tortoise LLC | 33.275 | -4,91 | 1.091 | -2,94 | ||||
| 2025-10-16 | 13F | Kingstone Capital Partners Texas, LLC | 0 | -100,00 | 0 | -100,00 | ||||
| 2026-02-17 | 13F | Bank Of America Corp /de/ | 178.118 | -40,45 | 5.842 | -39,18 | ||||
| 2026-01-12 | 13F | Evanson Asset Management, LLC | 32.428 | 3,14 | 1.064 | 5,35 | ||||
| 2026-01-15 | 13F | DB Fitzpatrick & Co, Inc | 191 | 0,00 | 6 | 0,00 | ||||
| 2026-02-17 | 13F | Prosperity Consulting Group, LLC | 7.042 | 0,00 | 231 | 1,77 | ||||
| 2025-11-14 | 13F | Citadel Advisors Llc | Call | 0 | -100,00 | 0 | ||||
| 2026-01-16 | 13F | YHB Investment Advisors, Inc. | 0 | -100,00 | 0 | |||||
| 2026-02-12 | 13F | Manchester Financial Inc | 7.450 | 0,00 | 244 | 2,09 | ||||
| 2026-01-12 | 13F | Fiduciary Financial Group, Llc | 40.009 | 0,23 | 1.312 | 2,34 | ||||
| 2026-01-15 | 13F | Lodestone Wealth Management LLC | 846 | 28 | ||||||
| 2026-02-11 | 13F | O'shaughnessy Asset Management, Llc | 412 | 0,00 | 14 | 0,00 | ||||
| 2026-02-17 | 13F | NorthRock Partners, LLC | 179.217 | 167,87 | 5.878 | 173,65 | ||||
| 2025-11-07 | 13F | Beacon Capital Management, LLC | 0 | -100,00 | 0 | |||||
| 2026-01-29 | 13F | Sanctuary Advisors, LLC | 30.161 | 0,04 | 989 | 2,17 | ||||
| 2026-01-14 | 13F | True Vision MN LLC | 8.000 | 0,00 | 262 | 2,34 | ||||
| 2026-01-23 | 13F | U.S. Capital Wealth Advisors, LLC | 13.618 | 0,00 | 447 | 2,06 | ||||
| 2026-02-06 | 13F | VSM Wealth Advisory, LLC | 405 | 0,25 | 13 | 8,33 | ||||
| 2026-02-17 | 13F | Two Sigma Securities, Llc | 0 | -100,00 | 0 | |||||
| 2026-02-05 | 13F | AlphaCore Capital LLC | 3.792 | 2,60 | 124 | 5,08 | ||||
| 2026-02-06 | 13F | Fortis Group Advisors, LLC | 7.016 | 233 | ||||||
| 2026-01-26 | 13F | Merit Financial Group, LLC | 26.597 | -21,64 | 872 | -20,00 | ||||
| 2026-02-10 | 13F | Goldman Sachs Group Inc | 0 | -100,00 | 0 | |||||
| 2026-02-17 | 13F | Cardiff Park Advisors, Llc | 4.442 | 0,00 | 146 | 2,11 | ||||
| 2025-09-26 | NP | BLUC - Bluemonte Large Cap Core ETF | 11 | 0 | ||||||
| 2026-02-12 | 13F | Jane Street Group, Llc | 0 | -100,00 | 0 | -100,00 | ||||
| 2026-02-02 | 13F | Headinvest, Llc | 0 | -100,00 | 0 | |||||
| 2026-02-05 | 13F | Cambridge Investment Research Advisors, Inc. | 7.905 | -10,61 | 0 | |||||
| 2026-01-29 | 13F | Midwest Capital Advisors, LLC | 0 | -100,00 | 0 | |||||
| 2026-02-19 | 13F | Professional Financial Solutions Llc /adv | 9.287 | 305 | ||||||
| 2026-02-17 | 13F | Advisory Services Network, LLC | 0 | -100,00 | 0 | |||||
| 2026-02-17 | 13F | Mercer Global Advisors Inc /adv | 12.411 | -16,75 | 407 | -14,85 | ||||
| 2026-02-09 | 13F | Key FInancial Inc | 1.179 | -46,34 | 39 | -45,71 | ||||
| 2026-02-12 | 13F | BlackRock, Inc. | 9.825 | -33,73 | 322 | -32,35 | ||||
| 2026-02-17 | 13F | Tower Research Capital LLC (TRC) | 0 | -100,00 | 0 | |||||
| 2026-02-17 | 13F | Warren Averett Asset Management, LLC | 16.583 | 30,56 | 544 | 33,42 | ||||
| 2026-01-27 | 13F | My Purposeful Wealth Corp. | 12.759 | 0,31 | 418 | 2,45 | ||||
| 2026-01-12 | 13F | Brucke Financial, Inc. | 8.939 | -1,61 | 293 | -1,68 | ||||
| 2026-02-11 | 13F | Manchester Capital Management LLC | 196 | 6 | ||||||
| 2026-02-13 | 13F | Mml Investors Services, Llc | 70.100 | -0,88 | 2.299 | 1,23 | ||||
| 2026-02-17 | 13F | Ancora Advisors, LLC | 22.916 | 0,00 | 752 | 2,04 | ||||
| 2026-02-03 | 13F | Anfield Capital Management, LLC | 134 | 0,00 | 4 | 0,00 | ||||
| 2026-02-13 | 13F | Resources Investment Advisors, LLC. | 9.905 | -18,36 | 325 | -16,71 | ||||
| 2026-02-13 | 13F | Johnson Investment Counsel Inc | 0 | -100,00 | 0 | |||||
| 2026-02-17 | 13F | Engineers Gate Manager LP | 25.466 | 835 | ||||||
| 2026-01-07 | 13F | Bannerman Wealth Management Group, Llc | 9.427 | 0,00 | 309 | 2,32 | ||||
| 2026-02-05 | 13F | Accredited Investors Inc. | 8.744 | 0,05 | 287 | 2,14 | ||||
| 2026-01-22 | 13F | Financial Consulate, Inc | 346 | 0,29 | 11 | 0,00 | ||||
| 2026-02-17 | 13F | Cetera Investment Advisers | 76.825 | 3,83 | 2.520 | 6,02 | ||||
| 2026-02-11 | 13F | Buckingham Strategic Partners | 11.805 | 387 | ||||||
| 2026-01-30 | 13F | Bogart Wealth, LLC | 624 | 0,00 | 20 | 0,00 | ||||
| 2026-02-06 | 13F | Global Retirement Partners, LLC | 3.277 | 163.750,00 | 107 | |||||
| 2026-02-11 | 13F | LPL Financial LLC | 236.115 | 12,21 | 7.745 | 14,59 | ||||
| 2026-02-13 | 13F | SRS Capital Advisors, Inc. | 13.393 | 439 | ||||||
| 2026-01-21 | 13F | Clayton Financial Group LLC | 307 | 10 | ||||||
| 2026-02-11 | 13F | Vise Technologies, Inc. | 15.839 | -0,48 | 520 | 1,57 | ||||
| 2026-01-28 | 13F | Geneos Wealth Management Inc. | 200 | 0,00 | 7 | 0,00 | ||||
| 2026-02-10 | 13F | Opulen Financial Group LLC | 31.160 | 2,55 | 1.022 | 4,71 | ||||
| 2026-02-17 | 13F | Qube Research & Technologies Ltd | 3.511 | -39,09 | 115 | -37,84 | ||||
| 2026-02-11 | 13F | Cornerstone Advisors Asset Management, Inc | 194.308 | 130,32 | 6.373 | 135,25 | ||||
| 2026-01-23 | 13F | Schwab Charitable Fund | 117.247 | -2,53 | 3.846 | -0,47 | ||||
| 2026-02-13 | 13F | Morgan Stanley | 85.631 | 5,66 | 2.809 | 7,88 | ||||
| 2026-02-13 | 13F | McAdam, LLC | 30.657 | -1,32 | 1.006 | 0,80 | ||||
| 2026-02-17 | 13F | Equitable Holdings, Inc. | 20.876 | -3,20 | 685 | -1,16 | ||||
| 2026-02-09 | 13F | Blue Bell Private Wealth Management, Llc | 12.388 | -8,59 | 406 | -6,67 | ||||
| 2026-01-22 | 13F | Bartlett & Co. Wealth Management Llc | 3.294 | 0,30 | 108 | 2,86 | ||||
| 2026-02-13 | 13F | Heritage Wealth Advisors | 0 | 0 | ||||||
| 2026-01-28 | 13F | Cornerstone Advisory, LLC | 0 | -100,00 | 0 | |||||
| 2026-01-21 | 13F | Crews Bank & Trust | 826 | 0,00 | 27 | 3,85 | ||||
| 2026-02-13 | 13F | Brown Advisory Inc | 26.000 | 0,00 | 853 | 2,04 | ||||
| 2025-11-14 | 13F | Citadel Advisors Llc | Put | 0 | -100,00 | 0 | ||||
| 2026-01-27 | 13F | Vestia Personal Wealth Advisors | 7.860 | 0,00 | 260 | 2,78 | ||||
| 2025-10-20 | 13F | Mid-American Wealth Advisory Group, Inc. | 0 | -100,00 | 0 | |||||
| 2026-01-27 | 13F | Brighton Jones Llc | 0 | -100,00 | 0 | |||||
| 2025-11-14 | 13F | Citadel Advisors Llc | 0 | -100,00 | 0 | |||||
| 2026-01-12 | 13F | Orser Capital Management, Llc | 83.197 | -0,12 | 2.729 | 1,98 | ||||
| 2026-02-06 | 13F | Pnc Financial Services Group, Inc. | 710 | 0,00 | 23 | 4,55 | ||||
| 2026-02-17 | 13F | Guardian Wealth Advisors, Llc / Nc | 79.895 | 6,35 | 2.621 | 8,58 | ||||
| 2026-01-14 | 13F | Jfs Wealth Advisors, Llc | 394 | 0,00 | 13 | 0,00 | ||||
| 2026-02-13 | 13F | Visionary Wealth Advisors | 31.593 | 14,83 | 1.036 | 17,33 | ||||
| 2025-09-26 | NP | BLGR - Bluemonte Large Cap Growth ETF | 11 | 0 | ||||||
| 2026-01-12 | 13F | Abound Wealth Management | 2.571 | 84 | ||||||
| 2025-10-29 | 13F | SOL Capital Management CO | 0 | -100,00 | 0 | |||||
| 2026-02-17 | 13F | Aqr Capital Management Llc | 14.909 | 489 | ||||||
| 2026-01-06 | 13F | Collective Family Office Llc | 25.702 | 18,88 | 843 | 21,47 | ||||
| 2025-09-26 | NP | BINT - Bluemonte Global Equity ETF | 18 | 1 | ||||||
| 2026-02-18 | 13F | Crusonia Wealth Advisors LLC | 78.464 | 2.574 | ||||||
| 2026-01-15 | 13F | Warwick Investment Management, Inc. | 3.502.454 | 0,09 | 114.880 | 2,21 | ||||
| 2026-01-14 | 13F | Exchange Traded Concepts, Llc | 49 | -33,78 | 2 | -50,00 | ||||
| 2026-02-11 | 13F | Jpmorgan Chase & Co | 15.826 | -6,45 | 519 | -4,42 | ||||
| 2026-01-23 | 13F | Steigerwald, Gordon & Koch Inc. | 1.000 | 0,00 | 33 | 0,00 | ||||
| 2026-02-13 | 13F | Glen Eagle Advisors, LLC | 40 | 0,00 | 1 | 0,00 | ||||
| 2026-02-02 | 13F | Fulcrum Wealth Advisors, Llc | 10.862 | 356 | ||||||
| 2026-02-11 | 13F | MCF Advisors LLC | 8.000 | 0,00 | 262 | 2,34 | ||||
| 2026-01-16 | 13F | Bouchey Financial Group Ltd | 8.378 | 0,00 | 275 | 1,86 | ||||
| 2026-02-12 | 13F | Commonwealth Equity Services, Llc | 25.476 | -15,60 | 836 | |||||
| 2026-01-28 | 13F | Quaker Wealth Management, LLC | 210 | 0,00 | 7 | 0,00 | ||||
| 2026-02-09 | 13F | Harbour Investments, Inc. | 5.692 | -1,73 | 187 | 0,00 | ||||
| 2026-01-21 | 13F | Long Island Wealth Management, Inc. | 6.800 | 0,00 | 223 | 2,29 | ||||
| 2026-02-05 | 13F | Allworth Financial LP | 17.840 | -20,05 | 585 | -18,30 | ||||
| 2025-09-26 | NP | BLUX - Bluemonte Dynamic Total Market ETF | 49 | 1 | ||||||
| 2026-02-02 | 13F | Robertson Stephens Wealth Management, LLC | 9.291 | 0,01 | 305 | 2,01 | ||||
| 2026-02-14 | 13F | Howe & Rusling Inc | 339 | 0,30 | 11 | 10,00 | ||||
| 2026-02-11 | 13F | Capital Analysts, Inc. | 510 | 0,39 | 0 | |||||
| 2026-02-10 | 13F | Lido Advisors, LLC | 108.648 | 3,87 | 3.493 | 3,96 | ||||
| 2026-02-13 | 13F | Gts Securities Llc | 0 | -100,00 | 0 | |||||
| 2026-01-26 | 13F | AE Wealth Management LLC | 501 | 0,00 | 16 | 0,00 | ||||
| 2026-02-17 | 13F | North Capital, Inc. | 0 | -100,00 | 0 | |||||
| 2026-02-10 | 13F | Spinnaker Trust | 7.244 | 0,00 | 238 | 2,16 | ||||
| 2026-02-04 | 13F | Meridian Wealth Management, LLC | 9.682 | 0,29 | 318 | 2,26 | ||||
| 2025-11-12 | 13F | Simplex Trading, Llc | 0 | -100,00 | 0 | |||||
| 2026-02-09 | 13F | Hantz Financial Services, Inc. | 0 | -100,00 | 0 | |||||
| 2026-02-17 | 13F | Captrust Financial Advisors | 78.753 | 1,61 | 2.583 | 3,78 | ||||
| 2026-01-13 | 13F | Adamsbrown Wealth Consultants Llc | 7.002 | 0,07 | 230 | 2,23 | ||||
| 2026-02-20 | 13F | Cambient Family Office, Llc | 23.620 | 775 | ||||||
| 2026-01-16 | 13F | Empirical Financial Services, LLC d.b.a. Empirical Wealth Management | 6.833 | -0,55 | 224 | 1,82 | ||||
| 2026-01-28 | 13F | Omega Financial Group, LLC | 8.894 | 0,25 | 292 | 2,46 | ||||
| 2025-11-14 | 13F | Blue Capital, Inc. | 0 | -100,00 | 0 | |||||
| 2026-02-06 | 13F | HighTower Advisors, LLC | 30.272 | 4,46 | 993 | 6,67 | ||||
| 2026-02-13 | 13F | Kcm Investment Advisors Llc | 9.712 | 0,00 | 319 | 2,25 | ||||
| 2026-01-12 | 13F | RVW Wealth, LLC | 9.436 | 0,00 | 309 | 1,98 | ||||
| 2026-01-06 | 13F | Investors Research Corp | 0 | -100,00 | 0 | |||||
| 2026-01-28 | 13F | Kingswood Wealth Advisors, Llc | 10.018 | 5,89 | 329 | 8,25 | ||||
| 2026-02-13 | 13F | Y-Intercept (Hong Kong) Ltd | 29.510 | -48,83 | 968 | -47,79 | ||||
| 2026-02-11 | 13F | Peachtree Investment Partners, LLC | 5.234 | 0,31 | 172 | 2,40 | ||||
| 2026-02-17 | 13F | Russell Investments Group, Ltd. | 4.200 | 0,00 | 138 | 2,24 | ||||
| 2026-02-10 | 13F | Rothschild Investment Llc | 4.880 | 0,00 | 160 | 2,56 | ||||
| 2026-01-21 | 13F | Sound Income Strategies, LLC | 1.306 | -12,82 | 44 | -10,42 | ||||
| 2026-02-09 | 13F | Koesten, Hirschmann & Crabtree, INC. | 0 | -100,00 | 0 | |||||
| 2026-01-12 | 13F | Heartwood Wealth Advisors LLC | 14.247 | 0,00 | 467 | 2,19 | ||||
| 2026-01-09 | 13F | Diversified Trust Co | 39.576 | 0,00 | 1.298 | 2,12 | ||||
| 2026-02-18 | 13F | Beacon Pointe Advisors, LLC | 15.273 | -23,68 | 501 | -22,12 | ||||
| 2026-02-06 | 13F | IFP Advisors, Inc | 3.891 | 10,89 | 128 | 13,39 | ||||
| 2026-01-16 | 13F | SigFig Wealth Management, LLC | 28.477 | 8,37 | 934 | 11,06 | ||||
| 2026-02-13 | 13F | Wells Fargo & Company/mn | 1.000 | -7,24 | 33 | -5,88 | ||||
| 2026-01-27 | 13F | Atlantic Edge Private Wealth Management, LLC | 0 | 0 | ||||||
| 2026-02-02 | 13F | Blake Schutter Theil Wealth Advisors, LLC | 250.139 | -7,54 | 8.205 | -5,58 | ||||
| 2026-01-28 | 13F | Chicago Partners Investment Group LLC | 15.077 | 0,01 | 501 | 0,40 | ||||
| 2026-02-12 | 13F | IFC & Insurance Marketing, Inc. | 400 | 0 | ||||||
| 2026-01-23 | 13F | Assetmark, Inc | 681 | 62,14 | 22 | 69,23 | ||||
| 2026-01-27 | 13F | GHP Investment Advisors, Inc. | 827 | 0,00 | 27 | 3,85 |