Grundlæggende statistik
| Institutionelle ejere | 213 total, 208 long only, 0 short only, 5 long/short - change of 5,94% MRQ |
| Gennemsnitlig porteføljeallokering | 0.6110 % - change of -39,88% MRQ |
| Institutionelle aktier (lange) | 21.820.271 (ex 13D/G) - change of 4,33MM shares 24,76% MRQ |
| Institutionel værdi (lang) | $ 1.541.655 USD ($1000) |
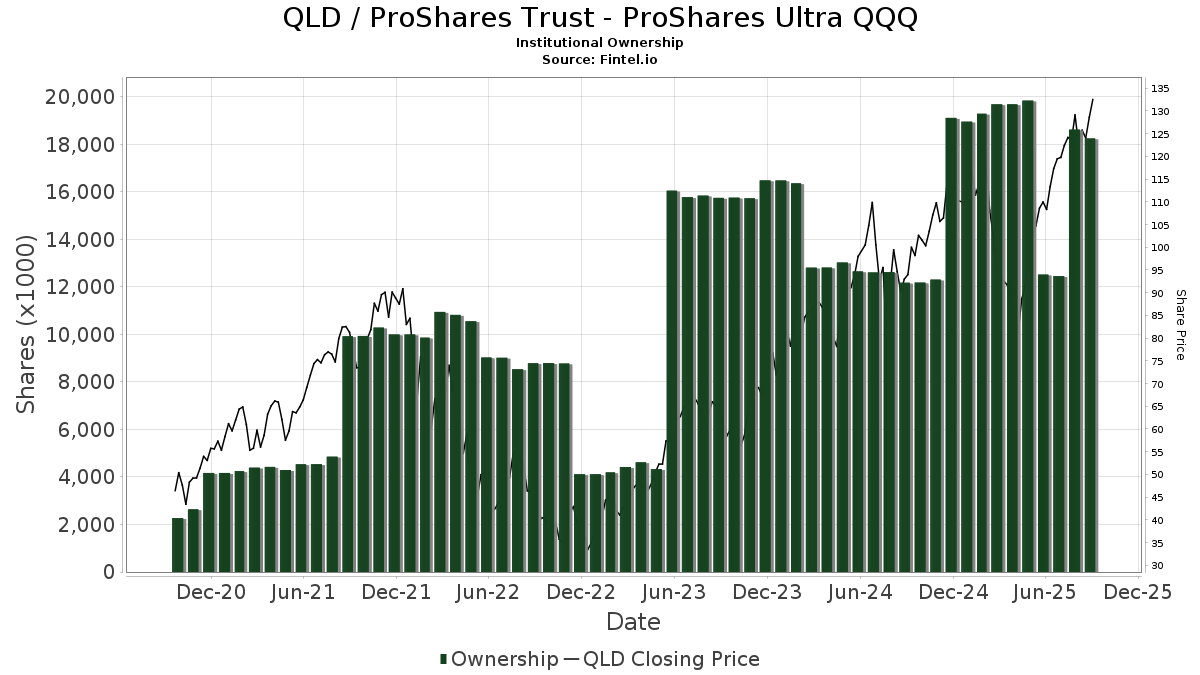
Institutionelt ejerskab og aktionærer
ProShares Trust - ProShares Ultra QQQ (US:QLD) har 213 institutionelle ejere og aktionærer, der har indsendt 13D/G- eller 13F-formularer til Securities Exchange Commission (SEC). Disse institutioner har i alt 21,820,271 aktier. Største aktionærer omfatter Howard Capital Management Inc., Global View Capital Management LLC, Susquehanna International Group, Llp, Main Street Group, LTD, Atlantic Trust, LLC, Susquehanna International Group, Llp, Focus Financial Network, Inc., Citadel Advisors Llc, Citadel Advisors Llc, and Citadel Advisors Llc .
ProShares Trust - ProShares Ultra QQQ (ARCA:QLD) institutionel ejerskabsstruktur viser aktuelle positioner i virksomheden efter institutioner og fonde, samt seneste ændringer i positionsstørrelse. Større aktionærer kan omfatte individuelle investorer, investeringsforeninger, hedgefonde eller institutioner. Skema 13D angiver, at investoren besidder (eller besidder) mere end 5 % af virksomheden og har til hensigt (eller har til hensigt at) aktivt at forfølge en ændring i forretningsstrategi. Skema 13G indikerer en passiv investering på over 5%.
The share price as of March 13, 2026 is 64,76 / share. Previously, on March 17, 2025, the share price was 47,20 / share. This represents an increase of 37,22% over that period.
Fondens stemningsscore
Fund Sentiment Score (fka Ownership Accumulation Score) finder de aktier, der bliver mest købt af fonde. Det er resultatet af en sofistikeret, multi-faktor kvantitativ model, der identificerer virksomheder med de højeste niveauer af institutionel akkumulering. Scoringsmodellen bruger en kombination af den samlede stigning i oplyste ejere, ændringerne i porteføljeallokeringer i disse ejere og andre målinger. Tallet går fra 0 til 100, hvor højere tal indikerer et højere niveau af akkumulering for sine jævnaldrende, og 50 er gennemsnittet.
Opdateringsfrekvens: Dagligt
Se Ownership Explorer, som giver en liste over højest rangerende virksomheder.
AI+ Ask Fintel’s AI assistant about ProShares Trust - ProShares Ultra QQQ.
Select a question to share a public post with an AI-crafted answer.
Thinking of good questions…
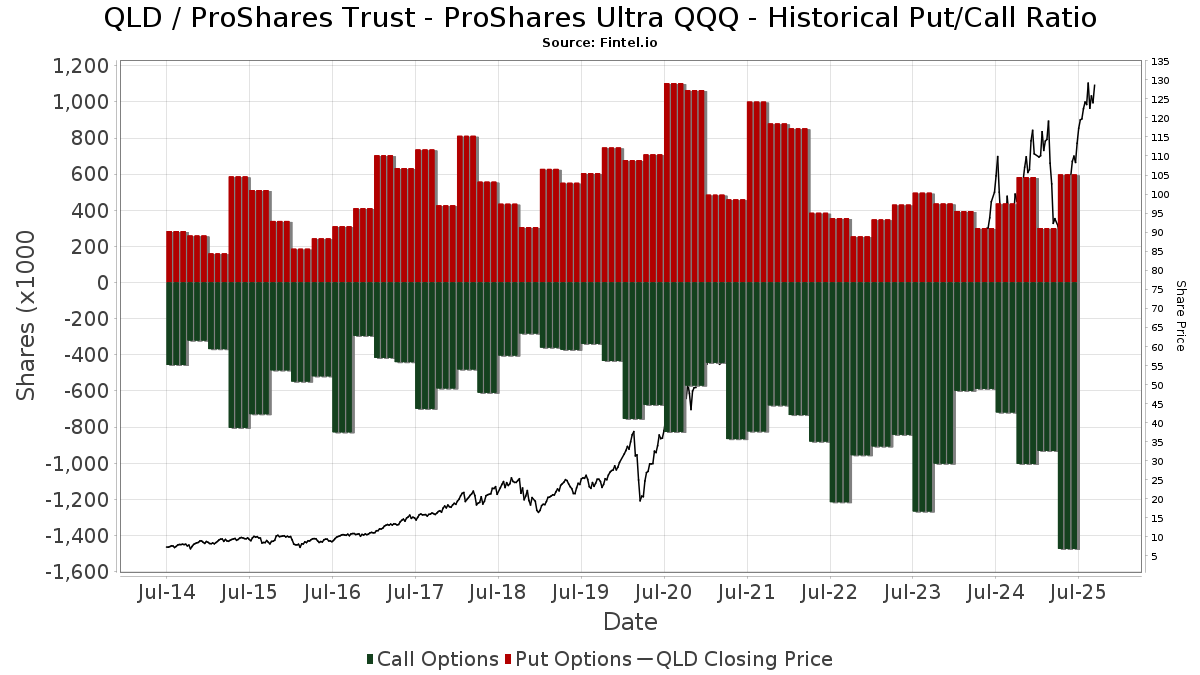
Institutionel Put/Call-forhold
Ud over at indberette standardaktie- og gældsudstedelser skal institutter med mere end 100 mill. aktiver under forvaltning også oplyse deres put- og call-optionsbeholdninger. Da salgsoptioner generelt indikerer negativ stemning, og købsoptioner indikerer positiv stemning, kan vi få en fornemmelse af den overordnede institutionelle stemning ved at plotte forholdet mellem put og kald. Diagrammet til højre viser det historiske put/call-forhold for dette instrument.
Brug af Put/Call Ratio som en indikator for investorernes stemning overvinder en af de vigtigste mangler ved at bruge totalt institutionelt ejerskab, som er, at en betydelig mængde af aktiver under forvaltning investeres passivt for at spore indekser. Passivt forvaltede fonde køber typisk ikke optioner, så indikatoren for put/call-forholdet følger mere nøje følelsen af aktivt forvaltede fonde.
13F og NPORT arkivering
Detaljer om 13F-arkivering er gratis. Detaljer om NP-ansøgninger kræver et premium-medlemskab. Grønne rækker angiver nye positioner. Røde rækker angiver lukkede positioner. Klik på linket ikon for at se den fulde transaktionshistorik.
Opgrader
for at låse premium-data op og eksportere til Excel ![]() .
.
| Fil dato | Kilde | Investor | Type | Gennemsnitlig pris (Øst) |
Aktier | Δ Aktier (%) |
Rapporteret Værdi ($1000) |
Δ Værdi (%) |
Port Alloc (%) |
|
|---|---|---|---|---|---|---|---|---|---|---|
| 2026-01-08 | 13F | PMV Capital Advisers, LLC | 33.288 | 125,68 | 2.344 | 15,82 | ||||
| 2026-01-21 | 13F | Capital Investment Advisory Services, LLC | 8.195 | 102,35 | 577 | 3,96 | ||||
| 2026-01-12 | 13F | Central Valley Advisors, Llc | 9.600 | 100,00 | 676 | 2,58 | ||||
| 2026-01-14 | 13F | Global View Capital Management LLC | 1.802.525 | 116,18 | 126.916 | 10,94 | ||||
| 2026-01-16 | 13F | Genesis Financial Group, LLC | 10.610 | 747 | ||||||
| 2026-02-12 | 13F | FineMark National Bank & Trust | 5.180 | 100,00 | 365 | 2,54 | ||||
| 2026-01-23 | 13F | Patriot Investment Management Inc. | 0 | -100,00 | 0 | |||||
| 2026-01-29 | 13F | Financial Life Planners | 3.094 | 204,53 | 218 | 56,12 | ||||
| 2026-02-10 | 13F | West Chester Capital Advisors, Inc | 14.075 | 86,23 | 991 | -4,34 | ||||
| 2025-10-22 | 13F | Compass Planning Associates Inc | 0 | -100,00 | 0 | |||||
| 2026-01-22 | 13F | Greenberg Financial Group | 5.200 | 366 | ||||||
| 2026-02-13 | 13F | Kestra Advisory Services, LLC | 0 | -100,00 | 0 | |||||
| 2026-02-10 | 13F | Lido Advisors, LLC | 7.601 | 0,00 | 1.043 | 0,00 | ||||
| 2026-01-14 | 13F | ORG Partners LLC | 172 | 100,00 | 12 | 9,09 | ||||
| 2026-01-28 | 13F | Chicago Partners Investment Group LLC | 4.469 | 99,96 | 322 | -5,03 | ||||
| 2026-01-23 | 13F | Clear Creek Financial Management, LLC | 2.950 | 208 | ||||||
| 2026-02-10 | 13F | Hilltop Partners LLC | 4.672 | 100,00 | 329 | 2,50 | ||||
| 2026-01-26 | 13F | United Advisor Group, LLC | 11.562 | 814 | ||||||
| 2026-01-13 | 13F | CoreCap Advisors, LLC | 0 | 0 | ||||||
| 2026-01-26 | 13F | Second Half Financial Partners, LLC | 0 | -100,00 | 0 | |||||
| 2025-10-28 | 13F | First National Corp /ma/ /adv | 89.256 | 13,17 | 12.364 | 33,18 | ||||
| 2025-09-19 | 13F | Canal Capital Management, LLC | 0 | -100,00 | 0 | -100,00 | ||||
| 2026-01-23 | 13F | Galvin, Gaustad & Stein, LLC | 12.360 | 121,51 | 870 | 13,73 | ||||
| 2026-01-16 | 13F | Empirical Financial Services, LLC d.b.a. Empirical Wealth Management | 3.948 | 100,00 | 278 | 2,59 | ||||
| 2026-02-05 | 13F | Cambridge Investment Research Advisors, Inc. | 53.089 | 392,02 | 4 | 200,00 | ||||
| 2026-02-13 | 13F | Citigroup Inc | 5 | -99,66 | 0 | -100,00 | ||||
| 2026-01-21 | 13F | Wealthbridge Capital Management, Llc | 8.844 | 100,00 | 623 | 2,64 | ||||
| 2026-01-07 | 13F | Innova Wealth Partners | 22.816 | 90,64 | 1.606 | -2,13 | ||||
| 2026-02-17 | 13F | Green Harvest Asset Management LLC | 15.000 | 1.056 | ||||||
| 2026-02-13 | 13F | Mariner, LLC | 66.332 | 90,23 | 4.670 | -2,38 | ||||
| 2026-02-04 | 13F | Nwam Llc | 4.130 | 34,75 | 300 | -30,88 | ||||
| 2026-02-17 | 13F | Quadrature Capital Ltd | 0 | -100,00 | 0 | |||||
| 2026-02-11 | 13F | Legacy Capital Wealth Management, Llc | 6.063 | 52,95 | 427 | -0,70 | ||||
| 2026-02-17 | 13F | Qube Research & Technologies Ltd | 502 | -2,52 | 35 | -50,00 | ||||
| 2026-01-14 | 13F | Accurate Wealth Management, LLC | 4.360 | 100,00 | 319 | 7,80 | ||||
| 2026-02-06 | 13F | Adell Harriman & Carpenter Inc | 6.520 | 88,44 | 459 | -3,16 | ||||
| 2026-02-17 | 13F | Coppell Advisory Solutions LLC | 3.771 | 89,78 | 270 | -0,37 | ||||
| 2026-02-11 | 13F | LPL Financial LLC | 141.071 | 125,10 | 9.933 | 15,52 | ||||
| 2026-01-14 | 13F | Wealthcare Advisory Partners LLC | 85.710 | 6.035 | ||||||
| 2026-02-10 | 13F | CIBC World Markets Inc. | 59.558 | 100,00 | 4.193 | 2,64 | ||||
| 2026-02-13 | 13F | Aire Advisors, Llc | 6.003 | 100,03 | 423 | 2,68 | ||||
| 2026-02-10 | 13F | Foundations Investment Advisors, LLC | 16.296 | 95,42 | 1.147 | 0,26 | ||||
| 2026-02-13 | 13F | Goldstone Financial Group, LLC | 0 | -100,00 | 0 | |||||
| 2026-02-09 | 13F | Fedenia Advisers LLC | 13.838 | 114,41 | 974 | 10,06 | ||||
| 2026-02-03 | 13F | Koshinski Asset Management, Inc. | 10.251 | 137,95 | 722 | 22,00 | ||||
| 2026-02-17 | 13F | Advisor Group Holdings, Inc. | 84.625 | 105,44 | 5.959 | 13,40 | ||||
| 2025-10-29 | 13F | BLVD Private Wealth, LLC | 0 | -100,00 | 0 | -100,00 | ||||
| 2025-10-28 | 13F | D. Scott Neal, Inc. | 24.928 | 0,00 | 3.420 | 16,56 | ||||
| 2026-02-12 | 13F | Financial Engines Advisors L.L.C. | 32.834 | 98,84 | 2.312 | 2,03 | ||||
| 2026-02-17 | 13F | Massar Capital Management, LP | 6.001 | 423 | ||||||
| 2025-11-07 | 13F | Beacon Capital Management, LLC | 0 | -100,00 | 0 | |||||
| 2025-11-06 | 13F | Abich Financial Wealth Management LLC | 0 | -100,00 | 0 | |||||
| 2026-02-17 | 13F | Momentous Wealth Management, Inc. | 3.043 | 214 | ||||||
| 2026-01-27 | 13F | Latitude Advisors, LLC | 27.439 | 116,48 | 1.932 | 11,10 | ||||
| 2026-01-15 | 13F | Brookstone Capital Management | 11.466 | 148,34 | 807 | 27,49 | ||||
| 2026-02-17 | 13F | Bank Of America Corp /de/ | 12.210 | 97,89 | 860 | 1,54 | ||||
| 2026-02-17 | 13F | Appalachian Capital Management Ltd | 7.327 | 516 | ||||||
| 2026-02-13 | 13F | Beck Capital Management, Llc | 2.948 | 208 | ||||||
| 2026-01-23 | 13F | SpringVest Wealth Management LLC | 8.019 | 100,07 | 565 | 2,73 | ||||
| 2026-02-17 | 13F | Wealth Watch Advisors, INC | 4.920 | 95,63 | 346 | 0,29 | ||||
| 2026-02-04 | 13F | Meridian Wealth Management, LLC | 26.220 | 100,70 | 1.846 | 3,01 | ||||
| 2025-11-13 | 13F | Van Hulzen Asset Management, LLC | 0 | -100,00 | 0 | |||||
| 2026-02-12 | 13F | Commonwealth Equity Services, Llc | 4.244 | 100,00 | 299 | |||||
| 2026-01-12 | 13F | Castleview Partners, Llc | 28.482 | 44,33 | 2.005 | -25,93 | ||||
| 2026-01-30 | 13F | Dale Q Rice Investment Management Ltd | 239.454 | 94,33 | 16.850 | -3,53 | ||||
| 2026-02-12 | 13F | Hrt Financial Lp | 7.976 | 1 | ||||||
| 2026-01-27 | 13F | Global Financial Private Client, LLC | 12.864 | 100,00 | 906 | 2,61 | ||||
| 2026-01-06 | 13F | Nelson, Van Denburg & Campbell Wealth Management Group, LLC | 16.570 | 71,09 | 1.167 | -12,20 | ||||
| 2026-01-29 | 13F | UBS Group AG | 48.310 | -38,14 | 3.402 | -68,26 | ||||
| 2026-02-17 | 13F | Cape Investment Advisory, Inc. | 697 | 49 | ||||||
| 2026-02-09 | 13F | Harbour Investments, Inc. | 56 | 4 | ||||||
| 2026-02-12 | 13F | Parsonex Advisory Services, Inc. | 19.236 | 89,57 | 1.354 | -2,73 | ||||
| 2026-02-03 | 13F | Emerald Investment Partners, Llc | 3.048 | 100,00 | 215 | 2,39 | ||||
| 2026-02-13 | 13F | Gts Securities Llc | 26.486 | 1.864 | ||||||
| 2025-11-14 | 13F | Sofos Investments, Inc. | 0 | -100,00 | 0 | |||||
| 2026-01-20 | 13F | Ethos Financial Group, LLC | 5.488 | 100,00 | 386 | 2,66 | ||||
| 2025-11-17 | 13F | Revere Asset Management, Inc | 0 | -100,00 | 0 | |||||
| 2026-02-03 | 13F | Sequoia Financial Advisors, LLC | 4.837 | 99,96 | 341 | 2,72 | ||||
| 2026-02-13 | 13F | Colony Group, LLC | 63.372 | 109,77 | 4.469 | 7,82 | ||||
| 2025-11-14 | 13F | StoneX Group Inc. | 0 | -100,00 | 0 | |||||
| 2026-01-09 | 13F | 180 Wealth Advisors, Llc | 19.979 | -6,65 | 1.407 | -52,11 | ||||
| 2026-02-12 | 13F | CIBC Private Wealth Group, LLC | 6.618 | 100,00 | 466 | 2,65 | ||||
| 2026-02-03 | 13F | SBI Securities Co., Ltd. | 60.940 | 185,33 | 4.291 | 46,42 | ||||
| 2025-10-30 | 13F | Envestnet Portfolio Solutions, Inc. | 0 | -100,00 | 0 | |||||
| 2026-02-05 | 13F | Allworth Financial LP | 16.266 | 100,00 | 1.145 | 2,69 | ||||
| 2025-11-21 | 13F | Watts Gwilliam & Co., LLC | 35.862 | 1,42 | 4.920 | 3,10 | ||||
| 2026-01-16 | 13F | Tempus Wealth Planning, LLC | 53.301 | 16,56 | 3.753 | -40,19 | ||||
| 2026-02-06 | 13F | HighTower Advisors, LLC | 136.905 | 121,82 | 9.639 | 13,84 | ||||
| 2026-01-23 | 13F | Howard Capital Management Inc. | 12.277.706 | 95,36 | 864.473 | 0,26 | ||||
| 2026-01-29 | 13F | Ashton Thomas Private Wealth, LLC | 3.735 | 263 | ||||||
| 2026-01-21 | 13F | Capital Advisory Group Advisory Services, LLC | 14.570 | 100,00 | 1.026 | 2,60 | ||||
| 2026-01-20 | 13F | Westwood Wealth Management | 0 | -100,00 | 0 | |||||
| 2026-01-26 | 13F | Turner Capital Investments, LLC | 84.396 | 4.379 | ||||||
| 2026-02-17 | 13F | Royal Bank Of Canada | 3.418 | 108,67 | 241 | 7,11 | ||||
| 2026-01-28 | 13F | Milestone Asset Management, Llc | 3.242 | 69,92 | 228 | -12,64 | ||||
| 2026-02-17 | 13F | Tower Research Capital LLC (TRC) | 16.979 | 15,42 | 1.195 | -40,78 | ||||
| 2026-02-03 | 13F | Brandywine Oak Private Wealth Llc | 4.911 | 99,96 | 346 | 2,68 | ||||
| 2026-02-10 | 13F | Hazlett, Burt & Watson, Inc. | 200 | 100,00 | 0 | |||||
| 2026-01-26 | 13F | Main Street Group, LTD | 1.039.176 | 89,87 | 73.168 | -2,56 | ||||
| 2026-02-06 | 13F | Pnc Financial Services Group, Inc. | 45.500 | 100,00 | 3.204 | 2,63 | ||||
| 2026-02-17 | 13F | Jump Financial, LLC | 91.687 | 6.456 | ||||||
| 2026-02-17 | 13F | Blair William & Co/il | 3.272 | 100,00 | 230 | 2,68 | ||||
| 2026-02-04 | 13F | Pensionmark Financial Group, Llc | 4.116 | 290 | ||||||
| 2026-01-23 | 13F | James J. Burns & Company, LLC | 5.688 | 100,00 | 400 | 2,56 | ||||
| 2026-01-12 | 13F | Traynor Capital Management, Inc. | 3.000 | 100,00 | 211 | 2,93 | ||||
| 2026-01-30 | 13F | American Capital Advisory, LLC | 328 | 100,00 | 23 | 4,55 | ||||
| 2026-02-10 | 13F | Spectrum Wealth Advisory Group, LLC | 8.360 | 100,00 | 589 | 2,62 | ||||
| 2026-02-19 | 13F | Connective Capital Management, LLC | 105.918 | 100,00 | 7.458 | 2,64 | ||||
| 2025-11-14 | 13F | Manchester Capital Management LLC | 1.000 | 0,00 | 137 | 17,09 | ||||
| 2026-02-12 | 13F | Lbmc Investment Advisors, Llc | 7.112 | 100,00 | 501 | 2,67 | ||||
| 2026-02-13 | 13F | Vontobel Holding Ltd. | 35.739 | 76,08 | 2.516 | -9,63 | ||||
| 2026-02-17 | 13F | Safe Harbor Fiduciary, LLC | 6.508 | 162,31 | 458 | 56,85 | ||||
| 2026-01-29 | 13F | Schnieders Capital Management, Llc. | 4.600 | 100,00 | 324 | 2,54 | ||||
| 2026-02-04 | 13F | Atlantic Union Bankshares Corp | 1.996 | 100,80 | 141 | 2,94 | ||||
| 2026-01-26 | 13F | Grandview Asset Management LLC | 6.400 | 100,00 | 451 | 2,51 | ||||
| 2026-02-17 | 13F | Citadel Advisors Llc | 568.776 | 980,17 | 40.048 | 454,36 | ||||
| 2026-02-17 | 13F | Citadel Advisors Llc | Call | 434.600 | 99,54 | 30.600 | 2,40 | |||
| 2026-02-10 | 13F | Envestnet Asset Management Inc | 34.396 | 94,13 | 2.422 | -0,37 | ||||
| 2026-02-17 | 13F | Citadel Advisors Llc | Put | 366.800 | 128,96 | 25.826 | 17,50 | |||
| 2026-01-14 | 13F | Spire Wealth Management | 1.527 | 151,98 | 108 | 28,92 | ||||
| 2026-02-04 | 13F | Wsfs Capital Management, Llc | 86.700 | 99,38 | 6.105 | 2,31 | ||||
| 2026-01-26 | 13F | Discipline Wealth Solutions, LLC | 29.398 | 220,24 | 2.070 | 64,34 | ||||
| 2026-02-12 | 13F | Skopos Labs, Inc. | 14.862 | 1.069 | ||||||
| 2026-02-26 | 13F | Anchor Investment Management, LLC | 3.480 | 100,00 | 245 | 2,94 | ||||
| 2026-01-27 | 13F | Aspiring Ventures, LLC | 4.531 | 319 | ||||||
| 2026-02-04 | 13F | Drive Wealth Management, Llc | 0 | -100,00 | 0 | -100,00 | ||||
| 2026-01-27 | 13F | Institute for Wealth Management, LLC. | 8.782 | 100,00 | 618 | 2,66 | ||||
| 2026-02-12 | 13F | Wealthspire Advisors, LLC | 3.608 | 100,00 | 254 | 2,83 | ||||
| 2026-02-13 | 13F | Advyzon Investment Management, LLC | 6.424 | 181,14 | 452 | 44,41 | ||||
| 2026-02-17 | 13F | United Capital Financial Advisers, Llc | 4.147 | -27,25 | 292 | -62,79 | ||||
| 2026-01-08 | 13F | Gradient Investments LLC | 3.328 | 0,00 | 234 | -48,68 | ||||
| 2026-02-17 | 13F | Two Sigma Securities, Llc | 7.267 | -23,71 | 512 | -60,87 | ||||
| 2026-02-05 | 13F | Aegis Wealth Management, Inc. | 3.146 | 222 | ||||||
| 2026-01-16 | 13F | Wall Street Financial Group, Inc. | 4.684 | 36,00 | 330 | -30,30 | ||||
| 2026-01-14 | 13F | Donaldson Capital Management, Llc | 28.000 | 100,00 | 1.971 | 2,66 | ||||
| 2026-02-12 | 13F | Jane Street Group, Llc | Put | 299.400 | 170,71 | 21.081 | 38,92 | |||
| 2026-02-12 | 13F | Burke & Herbert Bank & Trust Co | 0 | -100,00 | 0 | |||||
| 2026-02-05 | 13F | Tucker Asset Management Llc | 2 | 0 | ||||||
| 2026-01-21 | 13F | Sowell Financial Services LLC | 46.863 | 96,40 | 3.300 | 0,79 | ||||
| 2026-02-04 | 13F | Horizon Wealth Management, LLC | 8.813 | 100,02 | 621 | 2,65 | ||||
| 2026-02-13 | 13F | Apriem Advisors | 4.884 | 100,00 | 344 | 2,39 | ||||
| 2026-02-12 | 13F | Jane Street Group, Llc | Call | 342.600 | 73,47 | 24.122 | -10,98 | |||
| 2026-01-20 | 13F | Toth Financial Advisory Corp | 262.628 | 71,89 | 18.492 | -11,79 | ||||
| 2026-01-26 | 13F | Lowery Thomas, Llc | 7.875 | 105,13 | 554 | 5,32 | ||||
| 2026-01-12 | 13F | Focus Financial Network, Inc. | 599.334 | 100,06 | 42.199 | 2,67 | ||||
| 2026-02-12 | 13F | Brinker Capital Investments, LLC | 24.759 | 127,92 | 1.743 | 16,98 | ||||
| 2026-02-10 | 13F | Savant Capital, LLC | 4.848 | 100,00 | 341 | 2,71 | ||||
| 2026-02-12 | 13F | Bank Of Montreal /can/ | 38.658 | 101,43 | 2.722 | 3,34 | ||||
| 2026-02-17 | 13F | Creative Planning | 132.214 | 297,06 | 9.309 | 103,79 | ||||
| 2026-01-12 | 13F | GenWealth Group, Inc. | 135.127 | 98,95 | 9.791 | 5,08 | ||||
| 2026-02-03 | 13F | Wesbanco Bank Inc | 19.200 | 100,00 | 1.352 | 2,58 | ||||
| 2026-02-09 | 13F | Global Assets Advisory, LLC | 0 | -100,00 | 0 | |||||
| 2026-02-02 | 13F | RIA Advisory Group LLC | 34.820 | -36,05 | 2.452 | -67,18 | ||||
| 2026-02-11 | 13F | Jpmorgan Chase & Co | 2.462 | 41,41 | 173 | -27,31 | ||||
| 2026-02-13 | 13F | SRS Capital Advisors, Inc. | 35.192 | 2.478 | ||||||
| 2026-02-03 | 13F | Farmers & Merchants Investments Inc | 800 | 100,00 | 56 | 3,70 | ||||
| 2026-02-13 | 13F | Flow Traders U.s. Llc | 14.314 | -31,65 | 1 | -50,00 | ||||
| 2025-10-02 | 13F | Caldwell Trust Co | 0 | -100,00 | 0 | -100,00 | ||||
| 2026-01-28 | 13F | Davidson Capital Management Inc. | 6 | 100,00 | 0 | |||||
| 2026-02-12 | 13F | Federation des caisses Desjardins du Quebec | 30 | 2 | ||||||
| 2026-01-07 | 13F | Massmutual Trust Co Fsb/adv | 1.898 | 100,00 | 134 | 2,31 | ||||
| 2026-01-23 | 13F | Farther Finance Advisors, LLC | 46.151 | 275,03 | 3.249 | 92,48 | ||||
| 2026-01-30 | 13F | Keybank National Association/oh | 6.828 | 100,00 | 481 | 2,56 | ||||
| 2026-02-06 | 13F | IFP Advisors, Inc | 998 | 300,80 | 70 | 105,88 | ||||
| 2026-02-17 | 13F | Quantinno Capital Management LP | 7.668 | 100,00 | 540 | 2,47 | ||||
| 2025-11-14 | 13F | Wolverine Trading, Llc | Put | 55.500 | -1,42 | 7.577 | 15,79 | |||
| 2025-11-14 | 13F | Wolverine Trading, Llc | Call | 183.000 | 40,88 | 24.983 | 65,47 | |||
| 2025-11-14 | 13F | Wolverine Trading, Llc | 5.104 | 7,45 | 697 | 26,09 | ||||
| 2026-02-05 | 13F | Mesirow Financial Investment Management, Inc. | 92.200 | 95,75 | 6.492 | 0,45 | ||||
| 2026-02-17 | 13F | Boreal Capital Management LLC | 692 | 49 | ||||||
| 2026-02-12 | 13F | Richmond Brothers, Inc. | 0 | -100,00 | 0 | |||||
| 2026-01-26 | 13F | Merit Financial Group, LLC | 5.200 | 100,00 | 366 | 2,81 | ||||
| 2026-02-17 | 13F | Harvest Investment Services, LLC | 27.612 | 90,28 | 1.944 | -2,31 | ||||
| 2026-02-11 | 13F | Outlook Wealth Advisors, LLC | 3.664 | 100,00 | 258 | 2,39 | ||||
| 2025-11-12 | 13F | Aptus Capital Advisors, LLC | 0 | -100,00 | 0 | |||||
| 2026-01-26 | 13F | Cwm, Llc | 1.018 | -99,18 | 0 | -100,00 | ||||
| 2026-02-12 | 13F | Betterment LLC | 9.988 | 1 | ||||||
| 2026-01-13 | 13F | Norden Group Llc | 6.284 | 104,03 | 442 | 4,74 | ||||
| 2025-10-15 | 13F | Client First Investment Management LLC | 0 | -100,00 | 0 | |||||
| 2026-02-13 | 13F | Barclays Plc | 1.422 | 84,68 | 100 | -4,76 | ||||
| 2026-01-09 | 13F | Marshall Financial Group LLC | 72.265 | 55,70 | 5.088 | -20,09 | ||||
| 2026-02-19 | 13F | CI Private Wealth, LLC | 7.858 | 176,20 | 553 | 41,79 | ||||
| 2026-02-12 | 13F | Brown Brothers Harriman & Co | 10.000 | 37,82 | 704 | -29,25 | ||||
| 2025-11-12 | 13F | CIBC Bancorp USA Inc. | 16.109 | 2.210 | ||||||
| 2026-02-17 | 13F | DV Trading LLC | 9.100 | 641 | ||||||
| 2026-02-18 | 13F | Caitlin John, LLC | 4 | 0 | ||||||
| 2026-01-16 | 13F | Crowley Wealth Management, Inc. | 0 | -100,00 | 0 | |||||
| 2026-02-11 | 13F | Tradition Wealth Management, LLC | 4.000 | 100,00 | 282 | 2,55 | ||||
| 2026-02-13 | 13F | Wells Fargo & Company/mn | 4.801 | 100,04 | 338 | 2,74 | ||||
| 2026-02-03 | 13F | Legacy Wealth Managment, LLC/ID | 17.756 | 61,48 | 1.250 | -17,11 | ||||
| 2025-11-13 | 13F | Renaissance Technologies Llc | 0 | -100,00 | 0 | |||||
| 2026-02-17 | 13F | Permanens Capital L.P. | 20.750 | 141,14 | 1.461 | 23,81 | ||||
| 2026-02-12 | 13F | Benson Wealth Management INC | 1.594 | 112 | ||||||
| 2026-02-09 | 13F | Atlantic Trust, LLC | 731.539 | 102,39 | 51.508 | 3,86 | ||||
| 2026-02-13 | 13F | Headlands Technologies LLC | 0 | -100,00 | 0 | |||||
| 2026-02-17 | 13F | TCG Advisory Services, LLC | 127.047 | 123,38 | 8.945 | 14,64 | ||||
| 2026-01-23 | 13F | HBW Advisory Services LLC | 9.827 | 126,74 | 692 | 16,33 | ||||
| 2025-11-13 | 13F | Bnp Paribas Arbitrage, Sa | 0 | -100,00 | 0 | |||||
| 2026-01-08 | 13F | Wealth Enhancement Advisory Services, Llc | 29.275 | 848,95 | 2.121 | 395,56 | ||||
| 2026-02-06 | 13F | Banque Cantonale Vaudoise | 9.600 | 100,00 | 676 | |||||
| 2026-02-13 | 13F | Change Path, LLC | 8.599 | 235,51 | 605 | 72,36 | ||||
| 2026-01-20 | 13F | Steel Peak Wealth Management LLC | 52.229 | 100,00 | 3.677 | 2,65 | ||||
| 2026-01-26 | 13F | Zullo Investment Group, Inc. | 3.602 | 100,00 | 254 | 2,43 | ||||
| 2026-01-30 | 13F | Us Bancorp \de\ | 5.616 | 100,00 | 395 | 2,60 | ||||
| 2026-02-11 | 13F | Group One Trading, L.p. | 13.820 | -32,07 | 973 | -65,14 | ||||
| 2026-02-17 | 13F | Susquehanna International Group, Llp | 103.426 | 321,20 | 7.282 | 116,21 | ||||
| 2026-02-17 | 13F | Susquehanna International Group, Llp | Put | 665.600 | 201,59 | 46.865 | 54,77 | |||
| 2025-11-14 | 13F | Natixis | 0 | -100,00 | 0 | |||||
| 2026-02-17 | 13F | Susquehanna International Group, Llp | Call | 1.505.900 | 87,23 | 106.030 | -3,91 | |||
| 2026-02-03 | 13F | Cassaday & Co Wealth Management LLC | 20.522 | 99,03 | 1.445 | 2,12 | ||||
| 2026-02-11 | 13F | Parallel Advisors, LLC | 923 | 100,22 | 65 | 3,17 | ||||
| 2025-11-04 | 13F | Chung Wu Investment Group, LLC | 0 | -100,00 | 0 | |||||
| 2026-02-13 | 13F | Morgan Stanley | 8.483 | 152,62 | 597 | 29,78 | ||||
| 2026-02-13 | 13F | Squarepoint Ops LLC | 18.009 | 1.268 | ||||||
| 2026-02-13 | 13F | Squarepoint Ops LLC | Put | 4.600 | 100,00 | 324 | 2,54 | |||
| 2026-02-12 | 13F | Beacon Capital Management, Inc. | 29.383 | 456,92 | 2.069 | 186,03 | ||||
| 2025-10-28 | 13F | CarsonAllaria Wealth Management, Ltd. | 0 | -100,00 | 0 | |||||
| 2026-01-27 | 13F | Regions Financial Corp | 147.001 | 97,13 | 10.350 | 1,16 | ||||
| 2026-02-13 | 13F | Squarepoint Ops LLC | Call | 8.000 | 100,00 | 563 | 2,74 | |||
| 2026-02-17 | 13F | Raymond James Financial Inc | 0 | -100,00 | 0 | |||||
| 2026-02-17 | 13F | GeoWealth Management, LLC | 24.183 | 102,88 | 1.703 | 4,10 | ||||
| 2026-02-12 | 13F | Empower Advisory Group, LLC | 8.696 | 100,00 | 612 | 2,68 | ||||
| 2026-02-13 | 13F | Rosenblum Silverman Sutton S F Inc /ca | 0 | -100,00 | 0 | |||||
| 2026-02-11 | 13F | J.w. Cole Advisors, Inc. | 2.937 | 207 | ||||||
| 2026-02-12 | 13F | DRW Securities, LLC | 0 | -100,00 | 0 | |||||
| 2025-10-09 | 13F | Ridgepath Capital Management LLC | 0 | -100,00 | 0 | |||||
| 2026-02-13 | 13F | Ausdal Financial Partners, Inc. | 6.424 | 154,01 | 452 | 30,64 | ||||
| 2026-01-14 | 13F | CPR Investments Inc. | 12.673 | 277,28 | 926 | 91,51 | ||||
| 2026-01-29 | 13F | IMC-Chicago, LLC | 42.818 | 3.015 | ||||||
| 2026-01-12 | 13F | Silverleafe Capital Partners, LLC | 4.522 | 100,00 | 318 | 2,58 | ||||
| 2026-02-17 | 13F | XTX Topco Ltd | 4.897 | 345 | ||||||
| 2026-01-16 | 13F | CRA Financial Services, LLC | 5.714 | 104,29 | 402 | 4,96 | ||||
| 2026-02-13 | 13F | Ieq Capital, Llc | 31.144 | 100,03 | 2.193 | 2,62 | ||||
| 2026-02-06 | 13F | Larson Financial Group LLC | 0 | -100,00 | 0 | |||||
| 2026-02-13 | 13F | Walleye Trading LLC | Call | 8.600 | 606 | |||||
| 2026-02-13 | 13F | Walleye Trading LLC | 126 | 9 | ||||||
| 2026-02-17 | 13F/A | American Alpha Advisors, LLC | 6.604 | 100,00 | 465 | 2,43 | ||||
| 2025-11-14 | 13F | Mount Yale Investment Advisors, LLC | 0 | -100,00 | 0 | -100,00 | ||||
| 2026-02-17 | 13F | Mercer Global Advisors Inc /adv | 119.256 | 232,65 | 8.457 | 71,94 | ||||
| 2026-02-13 | 13F | Edgestream Partners, L.P. | 6.493 | 169,98 | 457 | 38,91 | ||||
| 2025-11-14 | 13F | Prosperity Wealth Management, Inc. | 6.644 | -74,06 | 912 | -69,77 | ||||
| 2026-01-23 | 13F | Capital Investment Counsel, Inc | 2.900 | 65,24 | 204 | -15,00 | ||||
| 2026-01-29 | 13F | Segment Wealth Management, LLC | 3.394 | 100,00 | 239 | 2,59 | ||||
| 2026-01-12 | 13F | VisionPoint Advisory Group, LLC | 5.396 | 83,66 | 380 | -5,96 | ||||
| 2026-02-11 | 13F | Vise Technologies, Inc. | 5.269 | 99,96 | 371 | 2,49 | ||||
| 2026-02-10 | 13F/A | Northwestern Mutual Wealth Management Co | 1.870 | -28,79 | 132 | -63,61 | ||||
| 2026-01-30 | 13F | Seek First Inc. | 3.018 | 93,21 | 212 | -0,93 | ||||
| 2025-11-14 | 13F | Millennium Management Llc | 0 | -100,00 | 0 | |||||
| 2026-02-17 | 13F | Cresset Asset Management, LLC | 53.560 | 100,00 | 3.771 | 2,64 | ||||
| 2026-01-27 | 13F | Krilogy Financial LLC | 0 | -100,00 | 0 | |||||
| 2026-02-06 | 13F | EverSource Wealth Advisors, LLC | 152 | 533,33 | 11 | 233,33 | ||||
| 2026-02-17 | 13F | Modern Wealth Management, LLC | 13.916 | 98,83 | 980 | 1,98 | ||||
| 2026-02-12 | 13F | Mindset Wealth Management, Llc | 14.028 | 100,00 | 988 | 2,60 | ||||
| 2026-02-02 | 13F | Miracle Mile Advisors, LLC | 54.594 | 102,05 | 3.844 | 3,67 | ||||
| 2026-02-18 | 13F/A | Virtue Capital Management, LLC | 11.112 | 69,24 | 779 | -13,56 | ||||
| 2026-01-29 | 13F | Sanctuary Advisors, LLC | 16.863 | 132,66 | 1.187 | 19,42 | ||||
| 2025-10-21 | 13F | Global Retirement Partners, LLC | 0 | -100,00 | 0 | |||||
| 2026-02-13 | 13F | Focused Alpha, Llc | 8.085 | 569 | ||||||
| 2026-02-23 | 13F | Monetary Solutions, Ltd | 840 | 59 | ||||||
| 2026-02-17 | 13F | Legacy Wealth Partners, LLC | 3.936 | 277 | ||||||
| 2026-01-22 | 13F | Financial Consulate, Inc | 1.067 | 88,52 | 75 | -2,60 | ||||
| 2026-02-04 | 13F | Rollins Financial Advisors, LLC | 29.427 | 109,86 | 2.072 | 7,70 | ||||
| 2026-01-14 | 13F | Woodward Diversified Capital, Llc | 26.519 | 128,26 | 1.867 | 17,20 |