Grundlæggende statistik
| Institutionelle aktier (lange) | 53.263.454 - 73,91% (ex 13D/G) - change of -23,95MM shares -31,02% MRQ |
| Institutionel værdi (lang) | $ 242.773 USD ($1000) |
Institutionelt ejerskab og aktionærer
Portillo's Inc. (US:PTLO) har 202 institutionelle ejere og aktionærer, der har indsendt 13D/G- eller 13F-formularer til Securities Exchange Commission (SEC). Disse institutioner har i alt 53,263,454 aktier. Største aktionærer omfatter Orbis Allan Gray Ltd, Alliancebernstein L.p., BlackRock, Inc., Vanguard Group Inc, Goldman Sachs Group Inc, Millennium Management Llc, Citadel Advisors Llc, Geode Capital Management, Llc, Engaged Capital LLC, and Dimensional Fund Advisors Lp .
Portillo's Inc. (NasdaqGS:PTLO) institutionel ejerskabsstruktur viser aktuelle positioner i virksomheden efter institutioner og fonde, samt seneste ændringer i positionsstørrelse. Større aktionærer kan omfatte individuelle investorer, investeringsforeninger, hedgefonde eller institutioner. Skema 13D angiver, at investoren besidder (eller besidder) mere end 5 % af virksomheden og har til hensigt (eller har til hensigt at) aktivt at forfølge en ændring i forretningsstrategi. Skema 13G indikerer en passiv investering på over 5%.
The share price as of April 24, 2026 is 6,42 / share. Previously, on April 28, 2025, the share price was 10,49 / share. This represents a decline of 38,80% over that period.

Fondens stemningsscore
Fund Sentiment Score (fka Ownership Accumulation Score) finder de aktier, der bliver mest købt af fonde. Det er resultatet af en sofistikeret, multi-faktor kvantitativ model, der identificerer virksomheder med de højeste niveauer af institutionel akkumulering. Scoringsmodellen bruger en kombination af den samlede stigning i oplyste ejere, ændringerne i porteføljeallokeringer i disse ejere og andre målinger. Tallet går fra 0 til 100, hvor højere tal indikerer et højere niveau af akkumulering for sine jævnaldrende, og 50 er gennemsnittet.
Opdateringsfrekvens: Dagligt
Se Ownership Explorer, som giver en liste over højest rangerende virksomheder.
AI+ Ask Fintel’s AI assistant about Portillo's Inc..
Select a question to share a public post with an AI-crafted answer.
Thinking of good questions…
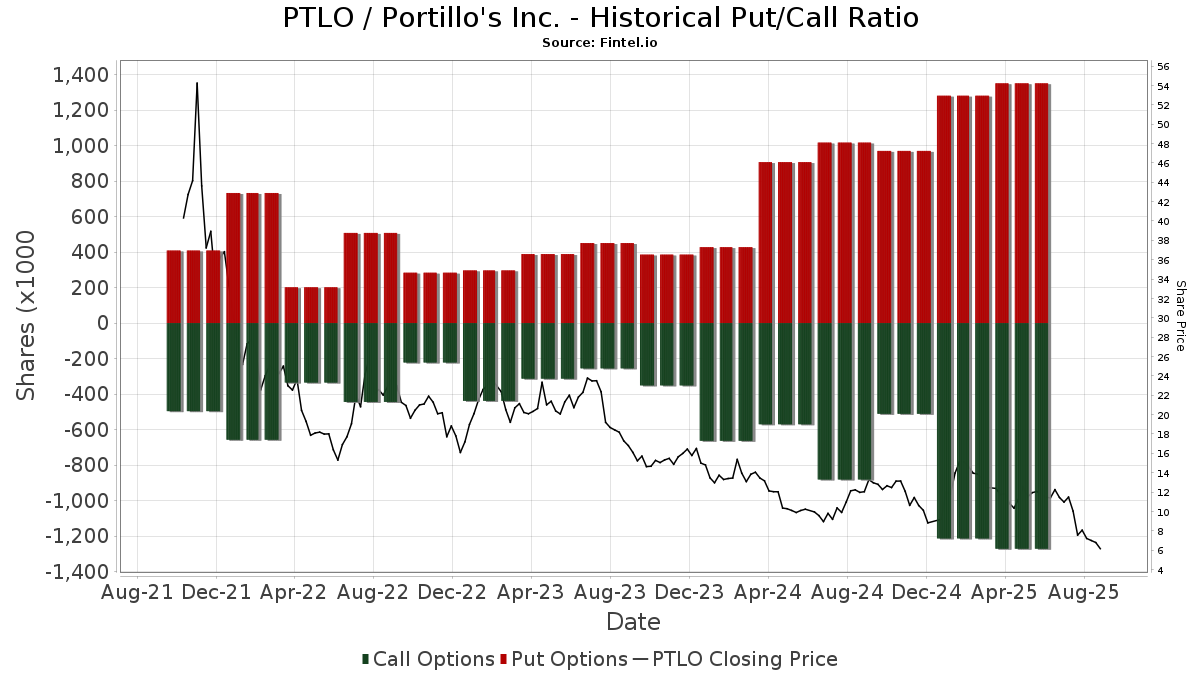
Institutionel Put/Call-forhold
Ud over at indberette standardaktie- og gældsudstedelser skal institutter med mere end 100 mill. aktiver under forvaltning også oplyse deres put- og call-optionsbeholdninger. Da salgsoptioner generelt indikerer negativ stemning, og købsoptioner indikerer positiv stemning, kan vi få en fornemmelse af den overordnede institutionelle stemning ved at plotte forholdet mellem put og kald. Diagrammet til højre viser det historiske put/call-forhold for dette instrument.
Brug af Put/Call Ratio som en indikator for investorernes stemning overvinder en af de vigtigste mangler ved at bruge totalt institutionelt ejerskab, som er, at en betydelig mængde af aktiver under forvaltning investeres passivt for at spore indekser. Passivt forvaltede fonde køber typisk ikke optioner, så indikatoren for put/call-forholdet følger mere nøje følelsen af aktivt forvaltede fonde.
13D/G-arkivering
Vi præsenterer 13D/G ansøgninger separat fra 13F ansøgninger på grund af den forskellige behandling af SEC. 13D/G-ansøgninger kan indgives af grupper af investorer (med én ledende), hvorimod 13F-ansøgninger ikke kan. Dette resulterer i situationer, hvor en investor kan indsende en 13D/G, der rapporterer én værdi for de samlede aktier (der repræsenterer alle de aktier, der ejes af investorgruppen), men derefter indsender en 13F, der rapporterer en anden værdi for de samlede aktier (der udelukkende repræsenterer deres egne) ejendomsret). Det betyder, at aktieejerskab af 13D/G-arkiver og 13F-arkiveringer ofte ikke er direkte sammenlignelige, så vi præsenterer dem separat.
Bemærk: Fra den 16. maj 2021 viser vi ikke længere ejere, der ikke har indsendt en 13D/G inden for det seneste år. Tidligere viste vi den fulde historie af 13D/G-arkiver. Generelt skal enheder, der er forpligtet til at indgive 13D/G-ansøgninger, indgive mindst årligt, før de indsender en afsluttende ansøgning. Dog forlader fonde nogle gange positioner uden at indsende en afsluttende ansøgning (dvs. de afvikler), så visning af den fulde historie resulterede nogle gange i forvirring om det nuværende ejerskab. For at undgå forvirring viser vi nu kun 'aktuelle' ejere - det vil sige - ejere, der har anmeldt inden for det seneste år.
Upgrade to unlock premium data.
| Fil dato | Form | Investor | Forrige Aktier |
Seneste Aktier |
Δ Aktier (Procent) |
Ejendomsret (Procent) |
Δ Ejerskab (Procent) |
|
|---|---|---|---|---|---|---|---|---|
| 2026-03-27 | VANGUARD GROUP INC | 3,984,974 | 0 | -100.00 | 0.00 | -100.00 | ||
| 2026-02-17 | ORBIS INVESTMENT MANAGEMENT LTD | 6,798,135 | 6,953,340 | 2.28 | 9.70 | 2.11 | ||
| 2025-11-14 | AMERIPRISE FINANCIAL INC | 3,413,669 | 1,971,016 | -42.26 | 2.70 | -49.06 | ||
| 2025-11-14 | ALLIANCEBERNSTEIN L.P. | 5,777,921 | 5,549,701 | -3.95 | 7.70 | -14.44 | ||
| 2025-10-22 | Engaged Capital Flagship Master Fund, LP | 5,069,301 | 1,534,990 | -69.72 | 2.10 | -70.00 | ||
| 2025-08-13 | Berkshire Partners Holdings LLC | 13,859,067 | 3,859,067 | -72.15 | 5.20 | -72.63 |
13F og NPORT arkivering
Detaljer om 13F-arkivering er gratis. Detaljer om NP-ansøgninger kræver et premium-medlemskab. Grønne rækker angiver nye positioner. Røde rækker angiver lukkede positioner. Klik på linket ikon for at se den fulde transaktionshistorik.
Opgrader
for at låse premium-data op og eksportere til Excel ![]() .
.
| Fil dato | Kilde | Investor | Type | Gennemsnitlig pris (Øst) |
Aktier | Δ Aktier (%) |
Rapporteret Værdi ($1000) |
Δ Værdi (%) |
Port Alloc (%) |
|
|---|---|---|---|---|---|---|---|---|---|---|
| 2026-02-12 | 13F | Marex Group plc | 45.000 | 204 | ||||||
| 2026-04-08 | 13F | Holos Integrated Wealth LLC | 66 | 0,00 | 0 | |||||
| 2026-01-27 | 13F | Zurcher Kantonalbank (Zurich Cantonalbank) | 0 | -100,00 | 0 | |||||
| 2026-02-17 | 13F | Balyasny Asset Management Llc | 263.053 | -37,26 | 1.194 | -55,84 | ||||
| 2026-02-11 | 13F | Fox Run Management, L.l.c. | 10.162 | -52,26 | 46 | -66,42 | ||||
| 2026-02-11 | 13F | Parallel Advisors, LLC | 899 | 1.897,78 | 4 | |||||
| 2026-01-28 | 13F | Chicago Partners Investment Group LLC | 260.894 | 0,08 | 1.568 | 7,55 | ||||
| 2026-01-21 | 13F | Newbridge Financial Services Group, Inc. | 9.800 | 2,08 | 44 | -27,87 | ||||
| 2026-02-05 | 13F | Cambridge Investment Research Advisors, Inc. | 10.348 | -23,48 | 0 | |||||
| 2026-02-17 | 13F | Northern Trust Corp | 560.131 | -7,61 | 2.543 | -34,99 | ||||
| 2026-02-13 | 13F | Zuckerman Investment Group, LLC | 0 | -100,00 | 0 | |||||
| 2026-02-17 | 13F | Graham Capital Management, L.P. | 23.683 | -51,49 | 108 | -65,92 | ||||
| 2026-01-28 | 13F | Klp Kapitalforvaltning As | 0 | -100,00 | 0 | |||||
| 2026-02-17 | 13F | Price T Rowe Associates Inc /md/ | 34.765 | 17,23 | 0 | |||||
| 2026-01-12 | 13F | Rialto Wealth Management, LLC | 0 | -100,00 | 0 | |||||
| 2026-02-17 | 13F | Alpine Global Management, LLC | 19.544 | 89 | ||||||
| 2026-04-20 | 13F | Inscription Capital, LLC | 31.230 | 53,47 | 165 | 79,35 | ||||
| 2026-02-12 | 13F | Fuller & Thaler Asset Management, Inc. | 0 | -100,00 | 0 | |||||
| 2026-02-11 | 13F | Ameritas Investment Partners, Inc. | 5.542 | 25 | ||||||
| 2025-10-30 | 13F | Universal- Beteiligungs- und Servicegesellschaft mbH | 0 | -100,00 | 0 | |||||
| 2026-02-17 | 13F | Cetera Investment Advisers | 26.459 | 50,69 | 120 | 6,19 | ||||
| 2026-02-17 | 13F | Susquehanna International Group, Llp | 355.057 | -56,64 | 1.612 | -69,49 | ||||
| 2025-11-14 | 13F | Man Group plc | 0 | -100,00 | 0 | |||||
| 2026-02-09 | 13F | Quest Partners LLC | 28.984 | 0,00 | 132 | -29,57 | ||||
| 2026-02-10 | 13F | Intech Investment Management Llc | 22.944 | 0,00 | 104 | -29,25 | ||||
| 2026-02-13 | 13F | Centiva Capital, LP | 12.060 | 55 | ||||||
| 2026-02-12 | 13F | State Board Of Administration Of Florida Retirement System | 12.940 | 0,00 | 59 | -30,12 | ||||
| 2026-02-09 | 13F | Huntington National Bank | 143 | 1 | ||||||
| 2026-02-13 | 13F | Rhumbline Advisers | 76.493 | -9,31 | 347 | -36,21 | ||||
| 2026-02-13 | 13F | BNP Paribas Asset Management Holding S.A. | 0 | -100,00 | 0 | |||||
| 2026-02-05 | 13F | Amalgamated Bank | 2.097 | 12,50 | 0 | |||||
| 2026-02-13 | 13F | Sei Investments Co | 30.422 | 138 | ||||||
| 2026-02-17 | 13F | Millennium Management Llc | 2.279.826 | 10.350 | ||||||
| 2025-11-14 | 13F | Lazard Asset Management Llc | 0 | -100,00 | 0 | |||||
| 2026-01-14 | 13F | Cooper Investors Pty Ltd | 0 | -100,00 | 0 | |||||
| 2026-02-06 | 13F | EverSource Wealth Advisors, LLC | 396 | 256,76 | 2 | |||||
| 2026-02-17 | 13F | Susquehanna International Group, Llp | Put | 432.700 | -39,25 | 1.964 | -57,25 | |||
| 2026-02-12 | 13F | DRW Securities, LLC | 0 | -100,00 | 0 | |||||
| 2026-02-17 | 13F | Susquehanna International Group, Llp | Call | 361.600 | 10,28 | 1.642 | -22,37 | |||
| 2026-01-28 | 13F | DekaBank Deutsche Girozentrale | 3.171 | 0,00 | 0 | |||||
| 2026-02-10 | 13F | Savant Capital, LLC | 0 | -100,00 | 0 | |||||
| 2026-04-17 | 13F | First National Bank Sioux Falls | 10.000 | 56 | ||||||
| 2026-02-17 | 13F | Boothbay Fund Management, Llc | 31.027 | 141 | ||||||
| 2025-11-14 | 13F | Susquehanna Fundamental Investments, Llc | 0 | -100,00 | 0 | |||||
| 2026-04-23 | 13F | Private Wealth Management Group, LLC | 0 | -100,00 | 0 | |||||
| 2025-11-14 | 13F | National Bank Of Canada /fi/ | 0 | -100,00 | 0 | |||||
| 2025-11-07 | 13F | Gsa Capital Partners Llp | 0 | -100,00 | 0 | |||||
| 2025-11-14 | 13F | Ancora Advisors, LLC | 0 | -100,00 | 0 | |||||
| 2026-01-21 | 13F | 4wealth Advisors, Inc. | 85.230 | 0,43 | 387 | -29,43 | ||||
| 2025-11-12 | 13F | Aster Capital Management (DIFC) Ltd | 0 | -100,00 | 0 | |||||
| 2026-02-13 | 13F | Walleye Capital LLC | 74.762 | 115,73 | 339 | 52,02 | ||||
| 2026-01-27 | 13F | CenterStar Asset Management, LLC | 180.000 | 9,09 | 818 | -23,19 | ||||
| 2026-02-12 | 13F | Sfam, Llc | 200 | 1 | ||||||
| 2026-02-13 | 13F | Walleye Capital LLC | Call | 147.200 | 274,55 | 668 | 164,03 | |||
| 2026-02-13 | 13F | Walleye Capital LLC | Put | 158.400 | 121,23 | 719 | 55,97 | |||
| 2026-02-23 | 13F | Virtu Financial LLC | 42.292 | 0 | ||||||
| 2026-02-17 | 13F | D. E. Shaw & Co., Inc. | Put | 96.700 | 439 | |||||
| 2026-02-12 | 13F | Voya Investment Management Llc | 10.266 | 0,00 | 47 | -30,30 | ||||
| 2026-02-12 | 13F | Hollencrest Capital Management | 2.000 | 0,00 | 9 | -25,00 | ||||
| 2025-11-14 | 13F | Twinbeech Capital Lp | 0 | -100,00 | 0 | |||||
| 2026-04-14 | 13F | Nbc Securities, Inc. | 3.300 | 0,00 | 17 | 21,43 | ||||
| 2026-04-22 | 13F | Spire Wealth Management | 2.000 | 0,00 | 11 | 11,11 | ||||
| 2026-02-17 | 13F | Brevan Howard Capital Management LP | 18.256 | -92,21 | 83 | -94,57 | ||||
| 2026-04-23 | 13F | Lakewood Asset Management LLC | 104.658 | -22,76 | 554 | -10,08 | ||||
| 2026-02-12 | 13F | Miller Financial Services LLC | 34.775 | -34,85 | 158 | -54,36 | ||||
| 2026-02-13 | 13F | GM Advisory Group, Inc. | 0 | -100,00 | 0 | |||||
| 2026-02-12 | 13F | Quadrant Capital Group Llc | 7.398 | 34 | ||||||
| 2026-02-06 | 13F | Larson Financial Group LLC | 835 | 116,88 | 4 | 50,00 | ||||
| 2026-02-03 | 13F | Insight 2811, Inc. | 24.903 | 113 | ||||||
| 2026-02-17 | 13F | California State Teachers Retirement System | 4.108 | -93,49 | 19 | -95,58 | ||||
| 2026-02-11 | 13F | Franklin Resources Inc | 1.118.216 | -16,39 | 5.077 | -41,15 | ||||
| 2026-02-13 | 13F | Manufacturers Life Insurance Company, The | 0 | -100,00 | 0 | |||||
| 2026-02-17 | 13F | Orbis Allan Gray Ltd | 6.994.844 | 2,27 | 31.757 | -28,02 | ||||
| 2026-03-12 | 13F/A | Peak6 Llc | Call | 179.500 | 0,00 | 815 | -29,65 | |||
| 2025-11-13 | 13F | Pier Capital, LLC | 0 | -100,00 | 0 | |||||
| 2026-01-27 | 13F | Evergreen Capital Management Llc | 12.884 | 58 | ||||||
| 2026-02-13 | 13F | Citigroup Inc | 388.139 | 3.391,09 | 1.762 | 2.381,69 | ||||
| 2026-02-17 | 13F | Point72 Asset Management, L.P. | 615.700 | 178,46 | 2.795 | 96,00 | ||||
| 2026-02-02 | 13F | Kornitzer Capital Management Inc /ks | 0 | -100,00 | 0 | |||||
| 2026-02-10 | 13F | Axq Capital, Lp | 43.827 | 199 | ||||||
| 2025-10-30 | 13F | Emerald Mutual Fund Advisers Trust | 0 | -100,00 | 0 | |||||
| 2026-02-11 | 13F | Los Angeles Capital Management Llc | 238 | 1 | ||||||
| 2026-01-21 | 13F | Flagship Harbor Advisors, Llc | 240 | 1 | ||||||
| 2026-01-28 | 13F | Arizona State Retirement System | 0 | -100,00 | 0 | |||||
| 2026-02-17 | 13F | Caption Management, LLC | 100.000 | 0,00 | 454 | -29,61 | ||||
| 2026-02-12 | 13F | Hrt Financial Lp | 156.834 | 25,44 | 1 | |||||
| 2026-02-17 | 13F | Caption Management, LLC | Put | 200.000 | 0,00 | 908 | -29,61 | |||
| 2026-02-11 | 13F | LPL Financial LLC | 98.460 | -4,37 | 447 | -32,68 | ||||
| 2026-02-17 | 13F | Aqr Capital Management Llc | 57.322 | 121,03 | 260 | 55,69 | ||||
| 2025-11-14 | 13F | Point72 Europe (London) LLP | 1.542 | 10 | ||||||
| 2026-04-21 | 13F | Mesirow Financial Investment Management, Inc. | 37.070 | 77,03 | 196 | 106,32 | ||||
| 2026-02-17 | 13F | Freestone Grove Partners LP | 0 | -100,00 | 0 | |||||
| 2026-02-13 | 13F | Southeast Asset Advisors Inc. | 0 | -100,00 | 0 | |||||
| 2026-02-12 | 13F | BlackRock, Inc. | 5.040.892 | 8,73 | 22.886 | -23,46 | ||||
| 2026-04-22 | 13F | Sterling Capital Management LLC | 2.227 | -42,11 | 12 | -35,29 | ||||
| 2026-02-20 | 13F | Sunbelt Securities, Inc. | 2.623 | 2,86 | 12 | -31,25 | ||||
| 2026-02-10 | 13F | Rothschild Investment Llc | 10.000 | -1,04 | 45 | -30,77 | ||||
| 2026-02-17 | 13F | Bank Of America Corp /de/ | 681.858 | 176,20 | 3.096 | 94,41 | ||||
| 2026-02-17 | 13F | Royal Bank Of Canada | 16.774 | -89,32 | 76 | -92,50 | ||||
| 2026-02-13 | 13F | Kilter Group LLC | 43 | 0 | ||||||
| 2026-04-24 | 13F | Horizon Wealth Management, LLC | 10.098 | 53 | ||||||
| 2026-02-26 | 13F/A | Aristides Capital LLC | 43.400 | 197 | ||||||
| 2026-02-13 | 13F | Colony Group, LLC | 13.089 | 62 | ||||||
| 2026-02-10 | 13F | Goldman Sachs Group Inc | 2.725.240 | 153,42 | 12.373 | 78,37 | ||||
| 2026-02-10 | 13F | Goldman Sachs Group Inc | Put | 790.000 | 3.587 | |||||
| 2026-02-17 | 13F | Atom Investors LP | 25.321 | 115 | ||||||
| 2026-01-21 | 13F | Sound Income Strategies, LLC | 500 | 0,00 | 3 | -33,33 | ||||
| 2026-02-12 | 13F | MetLife Investment Management, LLC | 36.171 | 28,89 | 164 | -9,39 | ||||
| 2026-02-13 | 13F | Divisadero Street Capital Management, LP | 0 | -100,00 | 0 | -100,00 | ||||
| 2026-04-07 | 13F | Farther Finance Advisors, LLC | 1.008 | 96,11 | 5 | 150,00 | ||||
| 2026-04-16 | 13F | SG Americas Securities, LLC | 0 | -100,00 | 0 | |||||
| 2025-11-12 | 13F | Victory Capital Management Inc | 0 | -100,00 | 0 | |||||
| 2026-04-13 | 13F | True Wealth Design, LLC | 272 | 1 | ||||||
| 2026-02-12 | 13F | CIBC Private Wealth Group, LLC | 3.057 | -24,63 | 14 | -50,00 | ||||
| 2025-11-12 | 13F | Transce3nd, LLC | 0 | -100,00 | 0 | |||||
| 2026-02-13 | 13F | Aigen Investment Management, Lp | 0 | -100,00 | 0 | |||||
| 2026-02-12 | 13F | Skopos Labs, Inc. | 60.148 | 280 | ||||||
| 2026-03-04 | 13F | SHP Wealth Management | 150 | 1 | ||||||
| 2026-01-15 | 13F | Nisa Investment Advisors, Llc | 0 | -100,00 | 0 | |||||
| 2026-02-17 | 13F | Blair William & Co/il | 985.020 | -22,07 | 4.472 | -45,15 | ||||
| 2026-04-13 | 13F | Wolff Wiese Magana Llc | 741 | -23,21 | 4 | -25,00 | ||||
| 2026-02-10 | 13F | State of Wyoming | 0 | -100,00 | 0 | |||||
| 2026-02-10 | 13F | Quantbot Technologies LP | 25.673 | -65,31 | 117 | -75,68 | ||||
| 2026-02-17 | 13F | SageView Advisory Group, LLC | 20 | 0 | ||||||
| 2026-02-11 | 13F | Deutsche Bank Ag\ | 42.470 | -1,69 | 193 | -30,94 | ||||
| 2026-04-06 | 13F | GAMMA Investing LLC | 9.609 | 8,48 | 51 | 25,00 | ||||
| 2026-02-12 | 13F | Steward Partners Investment Advisory, Llc | 365 | -43,93 | 2 | -75,00 | ||||
| 2026-01-30 | 13F | Jennison Associates Llc | 0 | -100,00 | 0 | |||||
| 2026-02-09 | 13F | Harbour Investments, Inc. | 1.127 | 4,26 | 5 | -16,67 | ||||
| 2026-02-06 | 13F | Pnc Financial Services Group, Inc. | 650 | -41,96 | 3 | -71,43 | ||||
| 2026-02-17 | 13F | Tower Research Capital LLC (TRC) | 3.847 | 85,58 | 17 | 30,77 | ||||
| 2026-02-13 | 13F | Verition Fund Management LLC | 32.500 | -3,21 | 148 | -31,94 | ||||
| 2026-02-12 | 13F | Swiss National Bank | 0 | -100,00 | 0 | |||||
| 2026-02-13 | 13F | Parkside Financial Bank & Trust | 0 | -100,00 | 0 | |||||
| 2025-11-14 | 13F | Woodline Partners LP | 0 | -100,00 | 0 | |||||
| 2026-02-05 | 13F | Allworth Financial LP | 9.243 | 235,26 | 42 | 141,18 | ||||
| 2026-02-10 | 13F | Bnp Paribas Arbitrage, Sa | 14.971 | 25,48 | 68 | -11,84 | ||||
| 2026-02-11 | 13F | Cerity Partners LLC | 15.204 | 69 | ||||||
| 2026-02-27 | 13F | Strategic Investment Solutions, Inc. /IL | 250 | 1 | ||||||
| 2026-01-26 | 13F | Cwm, Llc | 7.216 | 37,63 | 0 | |||||
| 2026-02-17 | 13F | Aquatic Capital Management LLC | 6.878 | 31 | ||||||
| 2026-02-03 | 13F | SBI Securities Co., Ltd. | 4 | 0,00 | 0 | |||||
| 2026-04-21 | 13F | Financial Consulate, Inc | 96 | 1 | ||||||
| 2026-02-11 | 13F | Janney Montgomery Scott LLC | 0 | -100,00 | 0 | |||||
| 2025-11-05 | 13F | First Dallas Securities Inc. | 0 | -100,00 | 0 | |||||
| 2025-11-14 | 13F | Manatuck Hill Partners, LLC | 0 | -100,00 | 0 | |||||
| 2026-02-02 | 13F | Total Clarity Wealth Management, Inc. | 0 | -100,00 | 0 | |||||
| 2026-02-17 | 13F | Advisor Group Holdings, Inc. | 103.579 | 2,80 | 470 | -33,80 | ||||
| 2026-02-11 | 13F | Group One Trading, L.p. | 0 | -100,00 | 0 | |||||
| 2026-01-29 | 13F | UBS Group AG | 597.464 | -38,69 | 2.712 | -56,85 | ||||
| 2026-01-23 | 13F | Nbt Bank N A /ny | 5 | -16,67 | 5 | -33,33 | ||||
| 2025-11-14 | 13F | Wolverine Trading, Llc | 246.938 | 48,96 | 1.575 | -17,58 | ||||
| 2025-11-14 | 13F | Wolverine Trading, Llc | Call | 268.500 | 0,22 | 1.713 | -44,53 | |||
| 2025-11-14 | 13F | Wolverine Trading, Llc | Put | 282.200 | 24,04 | 1.800 | -31,38 | |||
| 2026-02-13 | 13F | Morgan Stanley | 1.092.878 | 40,74 | 4.962 | -0,94 | ||||
| 2025-11-14 | 13F | Bamco Inc /ny/ | 0 | -100,00 | 0 | |||||
| 2026-02-17 | 13F | Quadrature Capital Ltd | 146.708 | 666 | ||||||
| 2026-04-07 | 13F | Signaturefd, Llc | 3.003 | 19,12 | 16 | 36,36 | ||||
| 2026-02-05 | 13F | Center for Financial Planning, Inc. | 382 | 0,00 | 2 | -50,00 | ||||
| 2026-02-12 | 13F | Renaissance Technologies Llc | 1.204.897 | 133,46 | 5.470 | 64,36 | ||||
| 2026-02-11 | 13F | Empowered Funds, LLC | 227.494 | 11,23 | 1.033 | -21,76 | ||||
| 2026-02-13 | 13F | SRS Capital Advisors, Inc. | 1.299 | 113,30 | 6 | 66,67 | ||||
| 2026-02-17 | 13F | Engaged Capital LLC | 1.534.990 | -69,72 | 6.969 | -78,69 | ||||
| 2026-02-17 | 13F | Russell Investments Group, Ltd. | 5.648 | -2,33 | 26 | -32,43 | ||||
| 2026-02-17 | 13F | Sherbrooke Park Advisers Llc | 0 | -100,00 | 0 | |||||
| 2026-02-02 | 13F | Benjamin Edwards Inc | 13.523 | -27,93 | 61 | -49,59 | ||||
| 2026-02-13 | 13F | Kestra Advisory Services, LLC | 8.738 | 40 | ||||||
| 2026-04-15 | 13F | Fortitude Family Office, LLC | 104 | 0,00 | 1 | |||||
| 2026-02-12 | 13F | Wealthspire Advisors, LLC | 0 | -100,00 | 0 | |||||
| 2026-02-13 | 13F | Police & Firemen's Retirement System of New Jersey | 16.012 | 0,00 | 73 | -30,10 | ||||
| 2026-02-13 | 13F | Truvestments Capital Llc | 1.300 | 0,00 | 6 | -37,50 | ||||
| 2025-11-07 | 13F | Hodges Capital Management Inc. | 0 | -100,00 | 0 | |||||
| 2025-11-06 | 13F | Versor Investments LP | 0 | -100,00 | 0 | |||||
| 2026-04-13 | 13F | IFP Advisors, Inc | 1.347 | -5,67 | 7 | 16,67 | ||||
| 2026-02-17 | 13F | Raymond James Financial Inc | 153.515 | -8,69 | 697 | -35,79 | ||||
| 2026-02-17 | 13F | Wiley Bros.-aintree Capital, Llc | 22.390 | 123,23 | 98 | 53,13 | ||||
| 2026-04-06 | 13F | Versant Capital Management, Inc | 6.038 | -49,64 | 32 | -42,59 | ||||
| 2026-01-29 | 13F | Comerica Bank | 250 | -90,13 | 1 | -93,75 | ||||
| 2026-01-29 | 13F | Dunhill Financial, LLC | 1 | 0 | ||||||
| 2026-02-17 | 13F | Creative Planning | 101.485 | 455,90 | 461 | 293,16 | ||||
| 2025-11-13 | 13F | Jefferies Financial Group Inc. | 0 | -100,00 | 0 | |||||
| 2026-02-13 | 13F | Charles Schwab Investment Management Inc | 643.293 | 29,98 | 2.921 | -8,52 | ||||
| 2026-02-09 | 13F | Geode Capital Management, Llc | 1.675.385 | 7,99 | 7.608 | -23,97 | ||||
| 2025-11-14 | 13F | Tudor Investment Corp Et Al | 0 | -100,00 | 0 | |||||
| 2026-02-13 | 13F | Pinnacle Wealth Planning Services, Inc. | 243 | 1 | ||||||
| 2026-01-30 | 13F | Citizens Financial Group Inc/ri | 0 | -100,00 | 0 | |||||
| 2025-11-14 | 13F | Trexquant Investment LP | 0 | -100,00 | 0 | -100,00 | ||||
| 2026-02-17 | 13F | Capstone Financial Advisors, Inc. | 58.745 | 0,00 | 267 | -29,63 | ||||
| 2026-02-13 | 13F | American Century Companies Inc | 93.332 | -16,74 | 424 | -41,49 | ||||
| 2026-02-12 | 13F | Dimensional Fund Advisors Lp | 1.387.793 | -34,90 | 6.301 | -54,18 | ||||
| 2026-02-04 | 13F | HighPoint Advisor Group LLC | 28.809 | -29,10 | 131 | -50,38 | ||||
| 2026-02-12 | 13F | Principal Securities, Inc. | 0 | -100,00 | 0 | -100,00 | ||||
| 2026-02-12 | 13F | Nuveen, LLC | 140.522 | 26,97 | 638 | -10,66 | ||||
| 2025-11-07 | 13F | Bastion Asset Management Inc. | 0 | -100,00 | 0 | -100,00 | ||||
| 2026-04-13 | 13F | Creative Financial Designs Inc /adv | 100 | 0,00 | 1 | |||||
| 2026-02-11 | 13F | Simplex Trading, Llc | 91.846 | -43,32 | 417 | 41.500,00 | ||||
| 2025-11-14 | 13F | Two Sigma Advisers, Lp | 0 | -100,00 | 0 | |||||
| 2026-01-20 | 13F | Harbor Capital Advisors, Inc. | 410 | -1,68 | 0 | |||||
| 2025-10-30 | 13F | Bailard, Inc. | 0 | -100,00 | 0 | |||||
| 2026-02-09 | 13F | Emerald Advisers, Llc | 0 | -100,00 | 0 | |||||
| 2025-11-05 | 13F | Envestnet Asset Management Inc | 0 | -100,00 | 0 | |||||
| 2026-02-10 | 13F | Bank of New York Mellon Corp | 191.013 | -7,24 | 867 | -34,71 | ||||
| 2026-02-06 | 13F | Covestor Ltd | 9 | 0,00 | 0 | |||||
| 2025-11-04 | 13F | Bellevue Asset Management, Llc | 0 | -100,00 | 0 | |||||
| 2026-04-08 | 13F | Wealth Enhancement Advisory Services, Llc | 23.388 | 130 | ||||||
| 2026-03-26 | 13F/A | Peak6 Llc | Put | 0 | -100,00 | 0 | -100,00 | |||
| 2025-11-14 | 13F | Fred Alger Management, Llc | 0 | -100,00 | 0 | |||||
| 2026-02-17 | 13F | Farringdon Capital, Ltd. | 0 | -100,00 | 0 | |||||
| 2026-02-12 | 13F | Bank Of Montreal /can/ | 13.670 | 62 | ||||||
| 2026-02-17 | 13F | Alliancebernstein L.p. | 5.279.147 | -4,88 | 23.967 | -33,04 | ||||
| 2026-02-19 | 13F | CI Private Wealth, LLC | 34.123 | 2,08 | 155 | -28,37 | ||||
| 2026-02-17 | 13F | Dark Forest Capital Management Lp | 0 | -100,00 | 0 | -100,00 | ||||
| 2026-02-17 | 13F | Citadel Advisors Llc | Call | 305.900 | 64,99 | 1.389 | 16,15 | |||
| 2026-02-17 | 13F | Citadel Advisors Llc | 1.701.127 | -0,88 | 7.723 | -30,23 | ||||
| 2025-11-14 | 13F | Soros Capital Management Llc | 0 | -100,00 | 0 | -100,00 | ||||
| 2026-02-17 | 13F | Select Equity Group, L.P. | 1.139.916 | 16,84 | 5.175 | -17,75 | ||||
| 2026-02-17 | 13F | Citadel Advisors Llc | Put | 524.600 | -31,38 | 2.382 | -51,71 | |||
| 2026-02-17 | 13F | Quantinno Capital Management LP | 186.830 | 785,70 | 848 | 523,53 | ||||
| 2026-04-14 | 13F | Cornerstone National Bank & Trust Co | 46 | 0,00 | 0 | |||||
| 2026-02-12 | 13F | Jane Street Group, Llc | Call | 28.000 | 16,18 | 127 | -18,06 | |||
| 2026-02-12 | 13F | Jane Street Group, Llc | 1.131.641 | 594,29 | 5.138 | 388,77 | ||||
| 2026-02-12 | 13F | Jane Street Group, Llc | Put | 50.100 | 17,33 | 227 | -17,45 | |||
| 2026-02-13 | 13F | Bridgefront Capital, LLC | 0 | -100,00 | 0 | |||||
| 2026-02-12 | 13F | New York State Common Retirement Fund | 16.682 | 0,00 | 76 | -29,91 | ||||
| 2026-01-29 | 13F | IMC-Chicago, LLC | 230.182 | -2,71 | 1.045 | -31,52 | ||||
| 2026-02-03 | 13F | International Assets Investment Management, Llc | 100 | 0 | ||||||
| 2026-02-17 | 13F | Sig Brokerage, Lp | 49.437 | 224 | ||||||
| 2025-11-14 | 13F | Bayesian Capital Management, LP | 0 | -100,00 | 0 | |||||
| 2026-02-17 | 13F | Sig Brokerage, Lp | Put | 100.000 | 454 | |||||
| 2026-02-03 | 13F | Washington Trust Advisors, Inc. | 0 | -100,00 | 0 | |||||
| 2026-02-09 | 13F | Legal & General Group Plc | 9.933 | -86,59 | 45 | -90,57 | ||||
| 2025-11-13 | 13F | Magnetar Financial LLC | 0 | -100,00 | 0 | |||||
| 2026-02-13 | 13F | Barclays Plc | 104.651 | 24,81 | 475 | -12,04 | ||||
| 2026-02-06 | 13F | ProShare Advisors LLC | 12.188 | 20,14 | 55 | -15,38 | ||||
| 2026-02-13 | 13F | Caitong International Asset Management Co., Ltd | 2.956 | 2.979,17 | 13 | |||||
| 2026-01-22 | 13F | Bartlett & Co. Wealth Management Llc | 300 | 0,00 | 1 | 0,00 | ||||
| 2026-02-14 | 13F | Rockefeller Capital Management L.P. | 1.075 | 7,50 | 5 | -33,33 | ||||
| 2026-02-17 | 13F | Ameriprise Financial Inc | 0 | -100,00 | 0 | |||||
| 2025-11-14 | 13F | Cubist Systematic Strategies, LLC | 562.292 | 3.627 | ||||||
| 2025-11-14 | 13F | ExodusPoint Capital Management, LP | 19.246 | -73,94 | 124 | |||||
| 2026-02-13 | 13F | Berkshire Partners LLC | 1.045.630 | 0,00 | 4.747 | -29,61 | ||||
| 2026-02-17 | 13F | Fmr Llc | 3.543 | 28,79 | 16 | -5,88 | ||||
| 2026-02-18 | 13F | GWM Advisors LLC | 0 | -100,00 | 0 | |||||
| 2026-02-02 | 13F | Fifth Third Bancorp | 40.000 | -0,50 | 182 | -30,12 | ||||
| 2026-01-07 | 13F | Significant Wealth Partners LLC | 0 | -100,00 | 0 | |||||
| 2026-02-13 | 13F | State Street Corp | 1.197.514 | -4,16 | 5.437 | -32,54 | ||||
| 2026-02-06 | 13F | Global Retirement Partners, LLC | 2.733 | -64,57 | 12 | -75,51 | ||||
| 2026-04-16 | 13F | Capital Advisors, Ltd. LLC | 33 | 0,00 | 0 | |||||
| 2026-02-11 | 13F | Jpmorgan Chase & Co | 325.113 | 435,39 | 1.476 | 277,49 | ||||
| 2026-02-17 | 13F | MIRAE ASSET GLOBAL ETFS HOLDINGS Ltd. | 31.007 | 12,52 | 141 | -20,90 | ||||
| 2026-02-13 | 13F | Ubs Asset Management Americas Inc | 37 | -99,96 | 0 | -100,00 | ||||
| 2026-02-19 | 13F | Invesco Ltd. | 224.209 | 53,19 | 1.018 | 7,73 | ||||
| 2026-02-10 | 13F | Clear Harbor Asset Management, LLC | 31.500 | 143 | ||||||
| 2026-02-03 | 13F | Ballentine Partners, LLC | 19.671 | 89 | ||||||
| 2026-02-17 | 13F | Janus Henderson Group Plc | 0 | -100,00 | 0 | |||||
| 2026-02-13 | 13F | Blueshift Asset Management, LLC | 0 | -100,00 | 0 | |||||
| 2026-02-13 | 13F | First Trust Advisors Lp | 227.408 | 2,52 | 1.032 | -27,83 | ||||
| 2026-04-24 | 13F | Root Financial Partners, LLC | 393 | 2 | ||||||
| 2026-02-09 | 13F | Keating Financial Advisory Services, Inc. | 30 | 0 | ||||||
| 2026-02-17 | 13F | Jones Financial Companies Lllp | 80.205 | 771,51 | 364 | 527,59 | ||||
| 2026-02-10 | 13F/A | Northwestern Mutual Wealth Management Co | 208 | 5.100,00 | 1 | |||||
| 2026-02-17 | 13F | Mercer Global Advisors Inc /adv | 16.318 | 74 | ||||||
| 2026-02-04 | 13F | Tsfg, Llc | 1.493 | -10,33 | 0 | |||||
| 2026-02-17 | 13F | Advisory Services Network, LLC | 0 | -100,00 | 0 | |||||
| 2025-11-14 | 13F | Point72 Asia (Singapore) Pte. Ltd. | 16.732 | 108 | ||||||
| 2026-01-29 | 13F | Vanguard Group Inc | 3.984.974 | -23,33 | 18.092 | -46,03 | ||||
| 2025-11-10 | 13F | MAI Capital Management | 0 | -100,00 | 0 | |||||
| 2025-10-30 | 13F | Ridgewood Investments LLC | 0 | -100,00 | 0 | |||||
| 2026-04-21 | 13F | Aaron Wealth Advisors LLC | 10.000 | 53 | ||||||
| 2026-02-17 | 13F | Canada Pension Plan Investment Board | 75.300 | 67,71 | 342 | 17,99 | ||||
| 2026-02-13 | 13F | Wells Fargo & Company/mn | 83.297 | 47,19 | 378 | 3,56 | ||||
| 2026-02-13 | 13F | Mariner, LLC | 11.086 | 50 | ||||||
| 2025-11-12 | 13F | CIBC Bancorp USA Inc. | 10.379 | 67 | ||||||
| 2026-02-17 | 13F | Bridgeway Capital Management Inc | 400.694 | -0,95 | 1.819 | -30,28 | ||||
| 2026-01-28 | 13F | Geneos Wealth Management Inc. | 2.550 | -7,27 | 12 | -35,29 | ||||
| 2025-11-24 | 13F | Penn Capital Management Co Inc | 0 | -100,00 | 0 | |||||
| 2026-02-13 | 13F | Walleye Trading LLC | Put | 79.400 | 387,12 | 360 | 242,86 | |||
| 2026-02-13 | 13F | Walleye Trading LLC | Call | 57.900 | 467,65 | 263 | 303,08 | |||
| 2026-01-30 | 13F | Us Bancorp \de\ | 4.904 | 564,50 | 22 | 450,00 | ||||
| 2026-02-13 | 13F | Walleye Trading LLC | 17.676 | -12,78 | 80 | -38,46 | ||||
| 2026-02-17 | 13F | XTX Topco Ltd | 26.131 | -33,96 | 119 | -53,73 | ||||
| 2026-04-09 | 13F | DHJJ Financial Advisors, Ltd. | 215 | 0,00 | 1 | |||||
| 2026-02-17 | 13F | Optiver Holding B.V. | 447 | -38,77 | 2 | -50,00 | ||||
| 2026-04-22 | 13F | Horizon Bancorp Inc /in/ | 50 | 0,00 | 0 | |||||
| 2026-04-21 | 13F | Red Tortoise LLC | 654 | 0,00 | 3 | 50,00 | ||||
| 2026-02-13 | 13F | Squarepoint Ops LLC | 806.091 | 60,43 | 3.660 | 12,93 | ||||
| 2026-04-23 | 13F | North Star Investment Management Corp. | 490 | -93,65 | 3 | -94,29 | ||||
| 2025-10-30 | 13F | Teacher Retirement System Of Texas | 0 | -100,00 | 0 | -100,00 | ||||
| 2025-11-04 | 13F | Principal Financial Group Inc | 0 | -100,00 | 0 | |||||
| 2025-11-14 | 13F | Two Sigma Investments, Lp | 0 | -100,00 | 0 | -100,00 | ||||
| 2025-11-12 | 13F | First Eagle Investment Management, LLC | 0 | -100,00 | 0 | |||||
| 2026-02-06 | 13F | Entrust Financial Llc | 245 | 1 | ||||||
| 2026-02-05 | 13F | Plante Moran Financial Advisors, LLC | 50 | 0,00 | 0 | |||||
| 2026-02-17 | 13F | Engineers Gate Manager LP | 27.836 | 126 |