Grundlæggende statistik
| Institutionelle aktier (lange) | 91.579.062 - 115,80% (ex 13D/G) - change of -22,19MM shares -19,51% MRQ |
| Institutionel værdi (lang) | $ 8.108.318 USD ($1000) |
Institutionelt ejerskab og aktionærer
Planet Fitness, Inc. (US:PLNT) har 444 institutionelle ejere og aktionærer, der har indsendt 13D/G- eller 13F-formularer til Securities Exchange Commission (SEC). Disse institutioner har i alt 91,579,062 aktier. Største aktionærer omfatter BlackRock, Inc., T. Rowe Price Investment Management, Inc., Vanguard Group Inc, SRS Investment Management, LLC, Price T Rowe Associates Inc /md/, Ninety One UK Ltd, Jpmorgan Chase & Co, Dorsal Capital Management, LLC, State Street Corp, and Steadfast Capital Management Lp .
Planet Fitness, Inc. (NYSE:PLNT) institutionel ejerskabsstruktur viser aktuelle positioner i virksomheden efter institutioner og fonde, samt seneste ændringer i positionsstørrelse. Større aktionærer kan omfatte individuelle investorer, investeringsforeninger, hedgefonde eller institutioner. Skema 13D angiver, at investoren besidder (eller besidder) mere end 5 % af virksomheden og har til hensigt (eller har til hensigt at) aktivt at forfølge en ændring i forretningsstrategi. Skema 13G indikerer en passiv investering på over 5%.
The share price as of April 10, 2026 is 70,40 / share. Previously, on April 14, 2025, the share price was 97,59 / share. This represents a decline of 27,86% over that period.

Fondens stemningsscore
Fund Sentiment Score (fka Ownership Accumulation Score) finder de aktier, der bliver mest købt af fonde. Det er resultatet af en sofistikeret, multi-faktor kvantitativ model, der identificerer virksomheder med de højeste niveauer af institutionel akkumulering. Scoringsmodellen bruger en kombination af den samlede stigning i oplyste ejere, ændringerne i porteføljeallokeringer i disse ejere og andre målinger. Tallet går fra 0 til 100, hvor højere tal indikerer et højere niveau af akkumulering for sine jævnaldrende, og 50 er gennemsnittet.
Opdateringsfrekvens: Dagligt
Se Ownership Explorer, som giver en liste over højest rangerende virksomheder.
AI+ Ask Fintel’s AI assistant about Planet Fitness, Inc..
Select a question to share a public post with an AI-crafted answer.
Thinking of good questions…
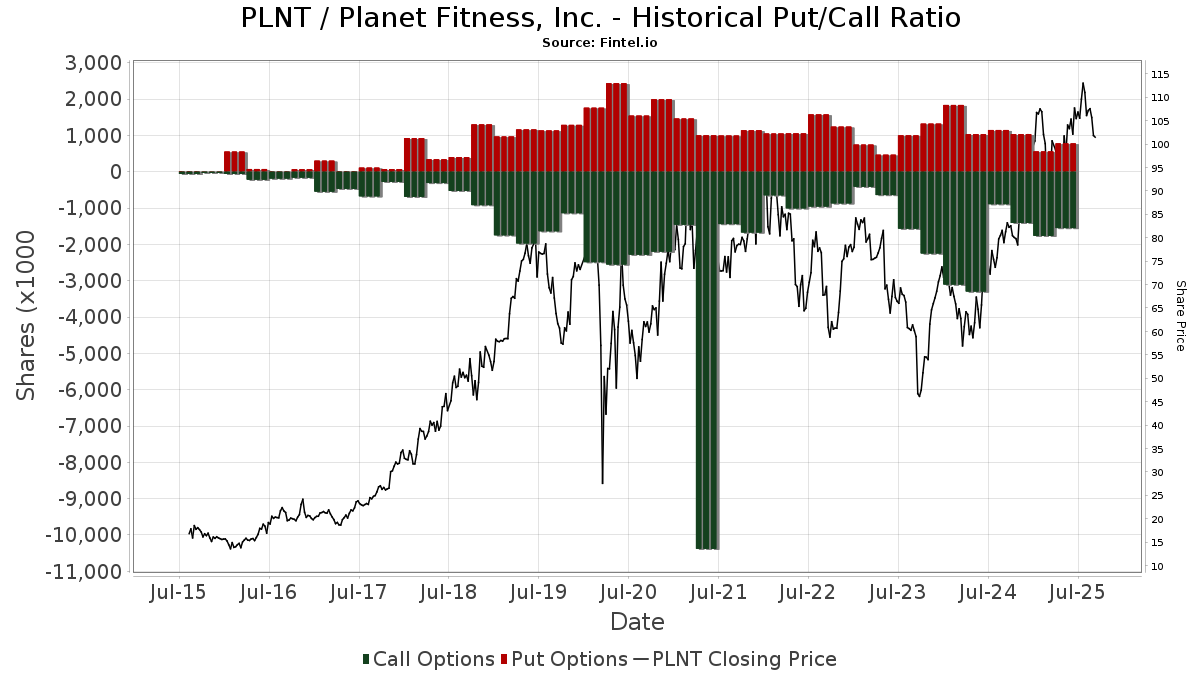
Institutionel Put/Call-forhold
Ud over at indberette standardaktie- og gældsudstedelser skal institutter med mere end 100 mill. aktiver under forvaltning også oplyse deres put- og call-optionsbeholdninger. Da salgsoptioner generelt indikerer negativ stemning, og købsoptioner indikerer positiv stemning, kan vi få en fornemmelse af den overordnede institutionelle stemning ved at plotte forholdet mellem put og kald. Diagrammet til højre viser det historiske put/call-forhold for dette instrument.
Brug af Put/Call Ratio som en indikator for investorernes stemning overvinder en af de vigtigste mangler ved at bruge totalt institutionelt ejerskab, som er, at en betydelig mængde af aktiver under forvaltning investeres passivt for at spore indekser. Passivt forvaltede fonde køber typisk ikke optioner, så indikatoren for put/call-forholdet følger mere nøje følelsen af aktivt forvaltede fonde.
13D/G-arkivering
Vi præsenterer 13D/G ansøgninger separat fra 13F ansøgninger på grund af den forskellige behandling af SEC. 13D/G-ansøgninger kan indgives af grupper af investorer (med én ledende), hvorimod 13F-ansøgninger ikke kan. Dette resulterer i situationer, hvor en investor kan indsende en 13D/G, der rapporterer én værdi for de samlede aktier (der repræsenterer alle de aktier, der ejes af investorgruppen), men derefter indsender en 13F, der rapporterer en anden værdi for de samlede aktier (der udelukkende repræsenterer deres egne) ejendomsret). Det betyder, at aktieejerskab af 13D/G-arkiver og 13F-arkiveringer ofte ikke er direkte sammenlignelige, så vi præsenterer dem separat.
Bemærk: Fra den 16. maj 2021 viser vi ikke længere ejere, der ikke har indsendt en 13D/G inden for det seneste år. Tidligere viste vi den fulde historie af 13D/G-arkiver. Generelt skal enheder, der er forpligtet til at indgive 13D/G-ansøgninger, indgive mindst årligt, før de indsender en afsluttende ansøgning. Dog forlader fonde nogle gange positioner uden at indsende en afsluttende ansøgning (dvs. de afvikler), så visning af den fulde historie resulterede nogle gange i forvirring om det nuværende ejerskab. For at undgå forvirring viser vi nu kun 'aktuelle' ejere - det vil sige - ejere, der har anmeldt inden for det seneste år.
Upgrade to unlock premium data.
| Fil dato | Form | Investor | Forrige Aktier |
Seneste Aktier |
Δ Aktier (Procent) |
Ejendomsret (Procent) |
Δ Ejerskab (Procent) |
|
|---|---|---|---|---|---|---|---|---|
| 2026-02-17 | T. Rowe Price Investment Management, Inc. | 8,407,128 | 9,236,173 | 9.86 | 11.10 | 11.00 | ||
| 2026-01-15 | STEADFAST CAPITAL MANAGEMENT LP | 5,288,992 | 6.40 | |||||
| 2025-11-14 | PRICE T ROWE ASSOCIATES INC /MD/ | 2,386,248 | 5,133,976 | 115.15 | 6.10 | 117.86 | ||
| 2025-04-24 | BlackRock, Inc. | 10,249,695 | 7,653,346 | -25.33 | 9.10 | -24.79 |
13F og NPORT arkivering
Detaljer om 13F-arkivering er gratis. Detaljer om NP-ansøgninger kræver et premium-medlemskab. Grønne rækker angiver nye positioner. Røde rækker angiver lukkede positioner. Klik på linket ikon for at se den fulde transaktionshistorik.
Opgrader
for at låse premium-data op og eksportere til Excel ![]() .
.
| Fil dato | Kilde | Investor | Type | Gennemsnitlig pris (Øst) |
Aktier | Δ Aktier (%) |
Rapporteret Værdi ($1000) |
Δ Værdi (%) |
Port Alloc (%) |
|
|---|---|---|---|---|---|---|---|---|---|---|
| 2026-02-05 | 13F | Elyxium Wealth, LLC | 47 | 5 | ||||||
| 2026-02-17 | 13F | Aster Capital Management (DIFC) Ltd | 0 | -100,00 | 0 | |||||
| 2026-02-10 | 13F | Commonwealth Of Pennsylvania Public School Empls Retrmt Sys | 20.766 | -3,58 | 2.252 | 0,76 | ||||
| 2026-02-10 | 13F | Future Fund LLC | 23.870 | 43,05 | 2.589 | 49,48 | ||||
| 2026-02-17 | 13F | Lighthouse Investment Partners, LLC | 10.335 | 1.121 | ||||||
| 2026-02-05 | 13F | North Dakota State Investment Board | 2.971 | 322 | ||||||
| 2026-02-13 | 13F | Walleye Trading LLC | Put | 28.700 | 21,10 | 3.113 | 26,54 | |||
| 2026-02-13 | 13F | Victory Capital Management Inc | 308.575 | -1,56 | 33.471 | 2,87 | ||||
| 2026-01-09 | 13F | Diversified Trust Co | 5.656 | 6,90 | 614 | 11,66 | ||||
| 2026-02-13 | 13F | Walleye Trading LLC | Call | 5.500 | -64,05 | 597 | -62,47 | |||
| 2026-02-17 | 13F | Greenvale Capital LLP | 0 | -100,00 | 0 | |||||
| 2026-01-21 | 13F | Newbridge Financial Services Group, Inc. | 20 | 0,00 | 2 | 0,00 | ||||
| 2026-01-14 | 13F | Jfs Wealth Advisors, Llc | 112 | 115,38 | 12 | 140,00 | ||||
| 2026-02-11 | 13F | SOUTH STATE Corp | 16 | 0,00 | 2 | 0,00 | ||||
| 2026-02-17 | 13F | California State Teachers Retirement System | 79.131 | -0,12 | 8.583 | 4,38 | ||||
| 2026-02-05 | 13F | Qsemble Capital Management, LP | 0 | -100,00 | 0 | |||||
| 2026-01-22 | 13F | V-Square Quantitative Management LLC | 251 | 27 | ||||||
| 2026-02-11 | 13F | Group One Trading, L.p. | Call | 300 | -40,00 | 33 | -37,25 | |||
| 2026-01-28 | 13F | Peregrine Capital Management Llc | 369.105 | -0,22 | 40.037 | 4,27 | ||||
| 2026-02-11 | 13F | Group One Trading, L.p. | Put | 2.600 | -75,70 | 282 | -74,59 | |||
| 2026-02-13 | 13F | Sei Investments Co | 83.134 | -11,77 | 9.018 | -7,80 | ||||
| 2026-02-17 | 13F | Shelton Capital Management | 2.799 | -7,41 | 304 | -3,19 | ||||
| 2026-02-06 | 13F | GPS Wealth Strategies Group, LLC | 0 | -100,00 | 0 | |||||
| 2026-02-13 | 13F | Macquarie Group Ltd | 0 | -100,00 | 0 | |||||
| 2026-02-09 | 13F | New Age Alpha Advisors, LLC | 11.701 | -30,81 | 1.269 | -27,69 | ||||
| 2026-02-12 | 13F | Principal Securities, Inc. | 0 | -100,00 | 0 | -100,00 | ||||
| 2026-02-17 | 13F | Cetera Investment Advisers | 28.161 | -3,85 | 3.055 | 0,46 | ||||
| 2026-02-09 | 13F | Quest Partners LLC | 12.725 | 80,55 | 1.380 | 88,78 | ||||
| 2026-02-02 | 13F | Sachetta, LLC | 21 | 0,00 | 2 | 0,00 | ||||
| 2025-11-14 | 13F | Samlyn Capital, Llc | Call | 0 | -100,00 | 0 | -100,00 | |||
| 2026-02-17 | 13F | Alphadyne Asset Management, LLC | 177 | 19 | ||||||
| 2026-02-09 | 13F | Huntington National Bank | 182 | -4,21 | 20 | 0,00 | ||||
| 2026-02-11 | 13F | Twin Tree Management, LP | Put | 7.900 | 857 | |||||
| 2026-02-17 | 13F | Alphadyne Asset Management, LLC | Call | 6.400 | 694 | |||||
| 2026-02-17 | 13F | Alphadyne Asset Management, LLC | Put | 9.500 | 1.030 | |||||
| 2026-02-02 | 13F | Qrg Capital Management, Inc. | 2.387 | 12,54 | 259 | 17,27 | ||||
| 2026-02-04 | 13F | Securian Asset Management, Inc | 6.047 | -3,77 | 656 | 0,46 | ||||
| 2026-02-13 | 13F | FORA Capital, LLC | 3.515 | 381 | ||||||
| 2026-02-13 | 13F | Resources Investment Advisors, LLC. | 1.952 | 212 | ||||||
| 2026-02-17 | 13F | Public Employees Retirement System Of Ohio | 25.634 | -3,73 | 2.781 | 0,62 | ||||
| 2026-02-13 | 13F | Transamerica Financial Advisors, Inc. | 2 | 0 | ||||||
| 2026-01-26 | 13F | Cwm, Llc | 1.523 | -0,26 | 0 | |||||
| 2025-11-12 | 13F | CIBC Bancorp USA Inc. | 274.707 | 28.515 | ||||||
| 2026-02-11 | 13F | Hughes Financial Services, LLC | 1 | 0 | ||||||
| 2026-02-17 | 13F | Fairscale Capital, LLC | 42 | 0,00 | 5 | 0,00 | ||||
| 2026-02-17 | 13F | Davidson Kempner Capital Management Lp | 0 | -100,00 | 0 | -100,00 | ||||
| 2026-02-17 | 13F | Capstone Investment Advisors, Llc | 0 | -100,00 | 0 | -100,00 | ||||
| 2026-02-17 | 13F | Boothbay Fund Management, Llc | 4.721 | 512 | ||||||
| 2026-01-27 | 13F | Ninety One UK Ltd | 3.421.505 | -1,16 | 371.131 | 3,29 | ||||
| 2026-02-11 | 13F | Allianz Asset Management GmbH | 20.722 | 11,32 | 2.248 | 16,30 | ||||
| 2026-02-11 | 13F | Fox Run Management, L.l.c. | 0 | -100,00 | 0 | |||||
| 2026-02-13 | 13F | Rhumbline Advisers | 226.957 | -3,48 | 24.618 | 0,86 | ||||
| 2026-01-23 | 13F | Optima Capital Llc | 4 | 0 | ||||||
| 2026-02-05 | 13F | New York Life Investment Management Llc | 7.387 | -13,21 | 801 | -9,29 | ||||
| 2026-02-18 | 13F/A | Empowered Funds, LLC | 21.465 | 2.328 | ||||||
| 2026-02-13 | 13F | Edgestream Partners, L.P. | 0 | -100,00 | 0 | |||||
| 2026-02-17 | 13F | Dv Equities, Llc | 100 | 11 | ||||||
| 2026-02-02 | 13F | Danica Pension, Livsforsikringsaktieselskab | 142.764 | 24,37 | 15.486 | 29,96 | ||||
| 2026-01-21 | 13F | SJS Investment Consulting Inc. | 8 | -98,11 | 1 | -100,00 | ||||
| 2026-02-11 | 13F | Meeder Asset Management Inc | 1.343 | 146 | ||||||
| 2026-02-11 | 13F | Ameritas Investment Partners, Inc. | 15.208 | 1.650 | ||||||
| 2026-01-21 | 13F | Greenleaf Trust | 1.970 | -0,45 | 214 | 3,90 | ||||
| 2026-02-12 | 13F | Voya Investment Management Llc | 21.983 | -29,31 | 2.384 | -26,12 | ||||
| 2026-02-11 | 13F | Parallel Advisors, LLC | 930 | 300,86 | 101 | 316,67 | ||||
| 2026-01-21 | 13F | Yousif Capital Management, Llc | 25.868 | -2,88 | 2.510 | -9,19 | ||||
| 2026-02-13 | 13F | Manufacturers Life Insurance Company, The | 0 | -100,00 | 0 | |||||
| 2026-02-13 | 13F | Walleye Capital LLC | 20 | -99,86 | 2 | -99,87 | ||||
| 2026-02-13 | 13F | Walleye Capital LLC | Put | 13.500 | 15,38 | 1.464 | 20,59 | |||
| 2026-01-16 | 13F | Standard Life Aberdeen plc | 98.533 | 10.688 | ||||||
| 2026-02-02 | 13F | Montag A & Associates Inc | 1.478 | 0,00 | 160 | 4,58 | ||||
| 2026-02-12 | 13F | Xponance, Inc. | 16.171 | -7,02 | 1.754 | -2,83 | ||||
| 2025-11-14 | 13F | Thematics Asset Management | 52.483 | -7,12 | 5.448 | -11,60 | ||||
| 2026-02-10 | 13F | One Capital Management, LLC | 23.872 | 43,04 | 2.589 | 49,48 | ||||
| 2026-02-10 | 13F | Goldman Sachs Group Inc | 1.163.964 | -30,38 | 126.255 | -27,24 | ||||
| 2025-11-14 | 13F | Harvest Fund Management Co., Ltd | 0 | -100,00 | 0 | |||||
| 2026-02-12 | 13F | Campbell & CO Investment Adviser LLC | 28.053 | 3.043 | ||||||
| 2025-11-07 | 13F | HighTower Advisors, LLC | Call | 0 | -100,00 | 0 | -100,00 | |||
| 2026-02-06 | 13F | HighTower Advisors, LLC | 5.763 | 1,91 | 625 | 6,66 | ||||
| 2026-02-11 | 13F | Rise Advisors, LLC | 0 | -100,00 | 0 | |||||
| 2026-01-23 | 13F | Burney Co/ | 20.478 | 2.221 | ||||||
| 2026-01-14 | 13F | Wolff Wiese Magana Llc | 24 | -70,73 | 3 | -75,00 | ||||
| 2026-02-11 | 13F | Strategic Advocates LLC | 723 | 0,00 | 79 | 4,00 | ||||
| 2026-02-13 | 13F | Truvestments Capital Llc | 2.469 | 0,28 | 268 | 4,71 | ||||
| 2025-11-14 | 13F | AXA Investment Managers S.A. | 446.178 | 46.313 | ||||||
| 2025-11-14 | 13F | Point72 Europe (London) LLP | 207 | 21 | ||||||
| 2025-11-13 | 13F | Clear Street Markets Llc | 0 | -100,00 | 0 | -100,00 | ||||
| 2026-02-17 | 13F | Bellevue Group AG | 3.173 | -26,23 | 344 | -22,87 | ||||
| 2026-03-12 | 13F/A | Peak6 Llc | Put | 14.900 | 684,21 | 1.616 | 720,30 | |||
| 2026-03-12 | 13F/A | Peak6 Llc | Call | 49.200 | 1.950,00 | 5.337 | 2.042,97 | |||
| 2026-02-13 | 13F | Citigroup Inc | 123.836 | 320,34 | 13.432 | 339,24 | ||||
| 2026-01-15 | 13F | Bernard Wealth Management Corp. | 100 | 0,00 | 11 | 0,00 | ||||
| 2025-11-14 | 13F | Symmetry Investments LP | 0 | -100,00 | 0 | -100,00 | ||||
| 2026-02-13 | 13F | Colony Group, LLC | 3.392 | 368 | ||||||
| 2026-02-17 | 13F | Jump Financial, LLC | 23.700 | 979,73 | 2.571 | 1.032,16 | ||||
| 2026-02-17 | 13F | SRS Investment Management, LLC | 4.877.578 | 4,55 | 529.071 | 9,25 | ||||
| 2026-02-17 | 13F | Synergy Financial Group, LTD | 2.640 | 0,00 | 286 | 4,38 | ||||
| 2026-02-03 | 13F | Patten & Patten Inc/tn | 13.250 | -2,65 | 1.437 | 1,77 | ||||
| 2026-02-12 | 13F | Federation des caisses Desjardins du Quebec | 6.558 | 17,04 | 711 | 22,38 | ||||
| 2026-02-12 | 13F | BlackRock, Inc. | 9.835.119 | 6,36 | 1.066.815 | 11,15 | ||||
| 2025-10-31 | 13F | Y-Intercept (Hong Kong) Ltd | 0 | -100,00 | 0 | -100,00 | ||||
| 2026-02-17 | 13F | Cape Investment Advisory, Inc. | 25 | 0,00 | 3 | 0,00 | ||||
| 2025-11-06 | 13F | CAPROCK Group, Inc. | 0 | -100,00 | 0 | -100,00 | ||||
| 2026-01-29 | 13F | Pictet Asset Management Holding SA | 215.248 | -63,73 | 23.348 | -62,10 | ||||
| 2026-02-12 | 13F | Cloud Capital Management, LLC | 0 | -100,00 | 0 | |||||
| 2025-11-14 | 13F | Caption Management, LLC | 0 | -100,00 | 0 | -100,00 | ||||
| 2026-02-13 | 13F | Treasurer of the State of North Carolina | 35.162 | -6,79 | 4 | 0,00 | ||||
| 2026-01-12 | 13F | Rialto Wealth Management, LLC | 4 | 33,33 | 0 | |||||
| 2026-02-04 | 13F | Twin Lakes Capital Management, LLC | 9.449 | -1,42 | 1.025 | 3,02 | ||||
| 2026-01-12 | 13F | Heartwood Wealth Advisors LLC | 0 | -100,00 | 0 | |||||
| 2026-03-04 | 13F | SHP Wealth Management | 653 | 71 | ||||||
| 2026-01-16 | 13F | Louisiana State Employees Retirement System | 23.000 | -1,71 | 2.495 | 2,72 | ||||
| 2026-02-17 | 13F | Bank Of America Corp /de/ | 726.962 | 15,91 | 78.854 | 21,13 | ||||
| 2026-04-06 | 13F | GAMMA Investing LLC | 2.579 | 2,42 | 192 | -30,04 | ||||
| 2026-02-12 | 13F | BRYN MAWR TRUST Co | 0 | -100,00 | 0 | -100,00 | ||||
| 2026-01-27 | 13F | Forum Financial Management, LP | 1.901 | -6,12 | 206 | -1,90 | ||||
| 2026-01-21 | 13F | Aaron Wealth Advisors LLC | 1.965 | -57,92 | 213 | -55,99 | ||||
| 2026-02-12 | 13F | CIBC Private Wealth Group, LLC | 323.740 | 18,18 | 35.116 | 23,50 | ||||
| 2026-02-13 | 13F | Baird Financial Group, Inc. | 0 | -100,00 | 0 | |||||
| 2026-02-17 | 13F | Algert Global Llc | 17.970 | 2 | ||||||
| 2026-02-13 | 13F | Natixis | 18.802 | 2.039 | ||||||
| 2026-01-29 | 13F | Concurrent Investment Advisors, LLC | 2.897 | 1,79 | 314 | 6,44 | ||||
| 2026-02-17 | 13F | SageView Advisory Group, LLC | 134 | 15 | ||||||
| 2026-02-04 | 13F | Atlantic Union Bankshares Corp | 494 | 15,96 | 54 | 20,45 | ||||
| 2026-02-13 | 13F | Hudson Bay Capital Management LP | 108.356 | 11.753 | ||||||
| 2026-02-17 | 13F | ISAM Funds (UK) Ltd | 0 | -100,00 | 0 | |||||
| 2026-01-26 | 13F | Whittier Trust Co | 108.669 | 0,10 | 11.468 | 4,97 | ||||
| 2026-02-13 | 13F | Vega Investment Solutions | 377 | 0,00 | 41 | -2,44 | ||||
| 2026-02-12 | 13F | Steward Partners Investment Advisory, Llc | 618 | 0,00 | 67 | 3,13 | ||||
| 2026-02-17 | 13F | Aquatic Capital Management LLC | 21.530 | 2.335 | ||||||
| 2026-01-09 | 13F | Zrc Wealth Management, Llc | 10 | -58,33 | 1 | -50,00 | ||||
| 2026-02-13 | 13F | Lord, Abbett & Co. Llc | 450.420 | 2,63 | 49 | 6,67 | ||||
| 2026-02-09 | 13F | Harbour Investments, Inc. | 102 | -51,43 | 11 | -47,62 | ||||
| 2026-02-11 | 13F | LPL Financial LLC | 31.941 | -0,18 | 3.465 | 4,31 | ||||
| 2026-02-13 | 13F | Neuberger Berman Group LLC | 7.649 | 2,12 | 830 | 6,69 | ||||
| 2026-02-13 | 13F | Vontobel Holding Ltd. | 29.218 | 17,07 | 3.169 | 22,36 | ||||
| 2026-04-07 | 13F | Farther Finance Advisors, LLC | 940 | 7,55 | 68 | -28,72 | ||||
| 2026-02-17 | 13F | Utah Retirement Systems | 4.435 | 0,00 | 481 | 4,57 | ||||
| 2026-02-13 | 13F | Motiv8 Investments LLC | 27 | 0 | ||||||
| 2026-02-11 | 13F | Cerity Partners LLC | 2.360 | 256 | ||||||
| 2026-04-07 | 13F | Retirement Wealth Solutions LLC | 13 | -7,14 | 1 | -100,00 | ||||
| 2026-02-06 | 13F | Pnc Financial Services Group, Inc. | 4.421 | 0,43 | 480 | 5,04 | ||||
| 2026-02-17 | 13F | Summit Trail Advisors, Llc | 6.870 | -53,20 | 745 | -51,08 | ||||
| 2026-02-10 | 13F | Bnp Paribas Arbitrage, Sa | 17.682 | 35,43 | 1.918 | 41,48 | ||||
| 2026-02-12 | 13F | JPL Wealth Management, LLC | 0 | -100,00 | 0 | |||||
| 2026-02-17 | 13F | Fred Alger Management, Llc | 476.382 | -5,31 | 51.673 | -1,05 | ||||
| 2026-02-17 | 13F | Tower Research Capital LLC (TRC) | 4.453 | 22,44 | 483 | 28,12 | ||||
| 2026-02-10 | 13F | Principia Wealth Advisory, LLC | 2 | 0 | ||||||
| 2026-02-17 | 13F | Shay Capital LLC | 7.575 | 822 | ||||||
| 2026-01-27 | 13F | Osborne Partners Capital Management, Llc | 72.282 | -0,33 | 7.840 | 4,16 | ||||
| 2026-02-06 | 13F | Envestnet Portfolio Solutions, Inc. | 2.033 | -11,72 | 221 | -7,95 | ||||
| 2026-02-24 | 13F | Bell Investment Advisors, Inc | 11 | 83,33 | 1 | |||||
| 2025-11-14 | 13F | Centiva Capital, LP | 0 | -100,00 | 0 | |||||
| 2026-02-17 | 13F | Advisor Group Holdings, Inc. | 7.165 | -57,35 | 777 | -55,63 | ||||
| 2026-02-17 | 13F | Signature Equity Partners, LLC | 7 | 1 | ||||||
| 2026-02-13 | 13F | Verition Fund Management LLC | 15.490 | 45,43 | 1.680 | 52,04 | ||||
| 2026-02-17 | 13F | Gotham Asset Management, LLC | 437.862 | 23,06 | 47.495 | 28,60 | ||||
| 2026-02-17 | 13F | Armistice Capital, Llc | 0 | -100,00 | 0 | |||||
| 2026-02-04 | 13F | Swiss Life Asset Management Ltd | 3.974 | 0,99 | 431 | 5,64 | ||||
| 2026-02-17 | 13F | Tudor Investment Corp Et Al | Call | 24.200 | 231,51 | 2.625 | 246,63 | |||
| 2026-02-09 | 13F | Employees Retirement System of Texas | 3.838 | 0 | ||||||
| 2026-02-17 | 13F | Tudor Investment Corp Et Al | Put | 7.300 | 792 | |||||
| 2026-02-05 | 13F | AustralianSuper Pty Ltd | 422.001 | 0,00 | 45.774 | 4,50 | ||||
| 2026-02-09 | 13F | Geode Capital Management, Llc | 1.658.435 | 1,63 | 179.924 | 6,20 | ||||
| 2026-02-13 | 13F | Verition Fund Management LLC | Call | 2.700 | -85,48 | 293 | -84,87 | |||
| 2026-02-05 | 13F | Td Private Client Wealth Llc | 1 | 0 | ||||||
| 2026-04-09 | 13F | Park Place Capital Corp | 12 | 0,00 | 1 | -100,00 | ||||
| 2026-04-10 | 13F/A | OP Asset Management Ltd | 11.457 | 852 | ||||||
| 2026-01-29 | 13F | Simon Quick Advisors, Llc | 3.861 | 0,31 | 419 | 4,76 | ||||
| 2026-02-04 | 13F | ABN AMRO Bank N.V. | 120.393 | -1,18 | 13.027 | 3,41 | ||||
| 2026-02-12 | 13F | Hilton Capital Management, LLC | 48.180 | 44,89 | 5.226 | 51,43 | ||||
| 2026-02-13 | 13F | Pinnacle Wealth Planning Services, Inc. | 14 | 2 | ||||||
| 2026-02-13 | 13F | Bridgefront Capital, LLC | 5.383 | 173,94 | 584 | 187,19 | ||||
| 2026-01-29 | 13F | Verdence Capital Advisors LLC | 2.486 | -40,85 | 270 | -33,42 | ||||
| 2026-01-12 | 13F | E. Ohman J:or Asset Management AB | 26.287 | 14,35 | 2.851 | 19,49 | ||||
| 2026-01-29 | 13F | Teachers Retirement System Of The State Of Kentucky | 25.659 | 0,00 | 3 | 0,00 | ||||
| 2026-02-11 | 13F | Fiera Capital Corp | 427.517 | 32,91 | 46.373 | 38,89 | ||||
| 2025-11-14 | 13F | Yiheng Capital Management, L.P. | Put | 0 | -100,00 | 0 | ||||
| 2026-04-06 | 13F | Versant Capital Management, Inc | 128 | -90,57 | 10 | -93,88 | ||||
| 2026-02-10 | 13F | Connor, Clark & Lunn Investment Management Ltd. | 11.069 | 1.201 | ||||||
| 2026-02-10 | 13F | Triodos Investment Management BV | 276.000 | -7,07 | 30.139 | -2,23 | ||||
| 2026-01-21 | 13F | Heritage Oak Wealth Advisors Llc | 27.350 | 0,00 | 2.967 | 4,51 | ||||
| 2026-02-13 | 13F | Prudential Financial Inc | 3.715 | -47,42 | 406 | -44,75 | ||||
| 2025-11-14 | 13F | Schonfeld Strategic Advisors LLC | 0 | -100,00 | 0 | |||||
| 2026-02-12 | 13F | Swiss National Bank | 165.585 | 1,85 | 17.961 | 6,43 | ||||
| 2026-02-10 | 13F | Pelham Capital Ltd. | 143.044 | 15,63 | 15.516 | 20,83 | ||||
| 2026-01-29 | 13F | UBS Group AG | 782.314 | -5,10 | 84.858 | -0,84 | ||||
| 2026-02-17 | 13F | Hollow Brook Wealth Management LLC | 22.459 | 0,00 | 2.436 | 4,50 | ||||
| 2026-02-12 | 13F | Wealthspire Advisors, LLC | 0 | -100,00 | 0 | |||||
| 2026-02-17 | 13F | Wiley Bros.-aintree Capital, Llc | 4.150 | -6,19 | 450 | 3,69 | ||||
| 2026-02-10 | 13F | Natixis Advisors, L.p. | 31.673 | -5,23 | 3 | 0,00 | ||||
| 2026-02-13 | 13F | Police & Firemen's Retirement System of New Jersey | 36.225 | -2,47 | 3.929 | 1,92 | ||||
| 2025-11-12 | 13F | Cambridge Investment Research Advisors, Inc. | 0 | -100,00 | 0 | |||||
| 2026-02-03 | 13F | Farmers & Merchants Investments Inc | 70 | 2,94 | 8 | 0,00 | ||||
| 2026-01-29 | 13F | Vanguard Group Inc | 7.892.744 | -2,70 | 856.126 | 1,68 | ||||
| 2026-02-17 | 13F | Mane Global Capital Management Lp | 315.351 | 57,68 | 34.206 | 64,77 | ||||
| 2026-02-13 | 13F/A | Alberta Investment Management Corp | 0 | -100,00 | 0 | |||||
| 2026-02-11 | 13F | Group One Trading, L.p. | 0 | -100,00 | 0 | -100,00 | ||||
| 2026-02-17 | 13F | Ameriprise Financial Inc | 113.781 | -1,35 | 12.342 | 3,08 | ||||
| 2026-02-11 | 13F | Nemes Rush Group LLC | 30 | 3 | ||||||
| 2026-02-04 | 13F | Versor Investments LP | 0 | -100,00 | 0 | |||||
| 2026-03-26 | 13F/A | Peak6 Llc | 0 | -100,00 | 0 | -100,00 | ||||
| 2026-01-29 | 13F | State Of Michigan Retirement System | 19.600 | -2,00 | 2.126 | 2,41 | ||||
| 2026-02-06 | 13F | Covestor Ltd | 1.163 | 49,87 | 0 | |||||
| 2026-02-10 | 13F | Bank of New York Mellon Corp | 719.322 | -8,91 | 78.025 | -4,81 | ||||
| 2026-02-02 | 13F | Van Berkom & Associates Inc. | 818.233 | 10,18 | 89 | 14,29 | ||||
| 2026-01-26 | 13F | Whittier Trust Co Of Nevada Inc | 58.945 | 1,29 | 6.220 | 6,23 | ||||
| 2026-01-07 | 13F | Massmutual Trust Co Fsb/adv | 195 | 1,04 | 21 | 5,00 | ||||
| 2026-02-13 | 13F | Bank Of Nova Scotia | 3.780 | 410 | ||||||
| 2026-02-03 | 13F | International Assets Investment Management, Llc | 3 | -99,95 | 0 | |||||
| 2026-02-10 | 13F | Axq Capital, Lp | 0 | -100,00 | 0 | |||||
| 2026-02-12 | 13F | Triumph Capital Management | 10 | 0,00 | 1 | 0,00 | ||||
| 2026-01-22 | 13F | Advantage Alpha Capital Partners LP | 0 | -100,00 | 0 | |||||
| 2026-02-02 | 13F | Bay Harbor Wealth Management, LLC | 7 | 75,00 | 1 | |||||
| 2026-02-11 | 13F | Argonautica Private Wealth Management, Inc | 5.427 | 589 | ||||||
| 2026-02-17 | 13F | Delaware Management Holdings, Inc. | 480.191 | 52.086 | ||||||
| 2026-01-26 | 13F | Chicago Capital, LLC | 10.050 | 0,00 | 1.090 | 4,51 | ||||
| 2026-02-12 | 13F | New York State Common Retirement Fund | 127.345 | 0,00 | 13.813 | 4,50 | ||||
| 2025-11-21 | 13F | Nebula Research & Development LLC | 0 | -100,00 | 0 | |||||
| 2026-02-11 | 13F | CLARET ASSET MANAGEMENT Corp | 2.106 | -0,24 | 0 | |||||
| 2026-02-17 | 13F | Frontier Capital Management Co Llc | 303.871 | 4,77 | 32.961 | 9,48 | ||||
| 2026-02-12 | 13F | Loomis Sayles & Co L P | 226.957 | -6,34 | 24.618 | -2,12 | ||||
| 2026-02-13 | 13F | Kayne Anderson Rudnick Investment Management Llc | 3 | 0,00 | 0 | |||||
| 2026-02-17 | 13F | Engineers Gate Manager LP | 0 | -100,00 | 0 | |||||
| 2026-02-06 | 13F | Legato Capital Management LLC | 10.155 | 1.102 | ||||||
| 2026-02-12 | 13F | Elo Mutual Pension Insurance Co | 11.700 | 1.269 | ||||||
| 2026-02-19 | 13F | Invesco Ltd. | 1.812.211 | -28,12 | 196.571 | -24,88 | ||||
| 2026-02-17 | 13F | Metavasi Capital LP | 0 | -100,00 | 0 | |||||
| 2026-02-09 | 13F | William Blair Investment Management, Llc | 1.459.295 | -8,45 | 158.290 | -4,33 | ||||
| 2026-01-28 | 13F | Salomon & Ludwin, LLC | 0 | -100,00 | 0 | |||||
| 2026-02-13 | 13F | Sterling Capital Management LLC | 601 | 373,23 | 65 | 400,00 | ||||
| 2026-01-27 | 13F | Zurcher Kantonalbank (Zurich Cantonalbank) | 25.055 | 4,02 | 2.718 | 8,68 | ||||
| 2026-02-17 | 13F | Citadel Advisors Llc | Put | 59.200 | -46,03 | 6.421 | -43,61 | |||
| 2026-02-17 | 13F | Optiver Holding B.V. | 0 | -100,00 | 0 | |||||
| 2026-02-13 | 13F | Caitong International Asset Management Co., Ltd | 461 | -23,42 | 50 | -19,35 | ||||
| 2026-02-17 | 13F | Citadel Advisors Llc | Call | 39.900 | -24,00 | 4.328 | -20,59 | |||
| 2026-02-13 | 13F | MAI Capital Management | 195 | 387,50 | 21 | 425,00 | ||||
| 2026-02-17 | 13F | Sea Cliff Partners Management, LP | 205.000 | -2,38 | 22.236 | 2,01 | ||||
| 2026-02-02 | 13F | Fifth Third Bancorp | 948 | 5,45 | 103 | 9,68 | ||||
| 2026-02-17 | 13F | Citadel Advisors Llc | 1.708.083 | 13,98 | 185.276 | 19,10 | ||||
| 2026-01-15 | 13F | Retirement Systems of Alabama | 99.593 | -1,84 | 10.803 | 2,57 | ||||
| 2025-10-16 | 13F | Harwood Advisory Group, LLC | 0 | -100,00 | 0 | |||||
| 2026-02-12 | 13F | Raiffeisen Bank International AG | 8.000 | 0,00 | 874 | 3,80 | ||||
| 2026-02-17 | 13F | Advisory Services Network, LLC | 0 | -100,00 | 0 | |||||
| 2026-02-24 | 13F/A | Pacer Advisors, Inc. | 13.073 | 18,20 | 1.418 | 23,52 | ||||
| 2026-02-09 | 13F | Keating Financial Advisory Services, Inc. | 24 | 3 | ||||||
| 2026-02-12 | 13F | Castleark Management Llc | 80.305 | -2,68 | 8.711 | 1,69 | ||||
| 2025-11-13 | 13F | Wells Fargo & Company/mn | Put | 0 | -100,00 | 0 | -100,00 | |||
| 2026-01-29 | 13F | Nippon Life Global Investors Americas, Inc. | 32.400 | 510,17 | 3.514 | 537,75 | ||||
| 2026-01-15 | 13F | Allspring Global Investments Holdings, LLC | 125.357 | -14,86 | 13.755 | -9,35 | ||||
| 2026-02-17 | 13F | Susquehanna International Group, Llp | 0 | -100,00 | 0 | |||||
| 2026-02-17 | 13F | Agf Management Ltd | 28.656 | 3.108 | ||||||
| 2026-01-21 | 13F | Oak Thistle LLC | 9.238 | 67,48 | 1.002 | 75,17 | ||||
| 2026-02-12 | 13F | California Public Employees Retirement System | 143.211 | -6,23 | 15.534 | -2,01 | ||||
| 2026-02-10 | 13F/A | Northwestern Mutual Wealth Management Co | 68 | 0,00 | 7 | 0,00 | ||||
| 2026-02-13 | 13F | Mariner, LLC | 38.026 | -23,22 | 4.124 | -19,79 | ||||
| 2026-01-28 | 13F | WPG Advisers, LLC | 11 | 0,00 | 1 | 0,00 | ||||
| 2026-01-29 | 13F | Dunhill Financial, LLC | 2 | 0 | ||||||
| 2026-02-06 | 13F | ProShare Advisors LLC | 3.328 | -6,73 | 361 | -2,70 | ||||
| 2026-02-18 | 13F | Owlhouse Capital LP | 76.700 | 8.320 | ||||||
| 2025-11-14 | 13F | Aigen Investment Management, Lp | 0 | -100,00 | 0 | -100,00 | ||||
| 2026-02-03 | 13F | Mitsubishi UFJ Kokusai Asset Management Co., Ltd. | 13.672 | -17,29 | 1.500 | -12,54 | ||||
| 2026-02-10 | 13F | Eurizon Capital SGR S.p.A. | 1.835 | 200 | ||||||
| 2026-02-13 | 13F | Champlain Investment Partners, LLC | 0 | -100,00 | 0 | |||||
| 2026-02-02 | 13F | Oppenheimer & Co Inc | 7.108 | -7,78 | 771 | -3,62 | ||||
| 2026-02-19 | 13F/A | T. Rowe Price Investment Management, Inc. | 9.236.173 | 1,65 | 1.002 | 6,15 | ||||
| 2026-02-17 | 13F | Interval Partners, LP | 111.565 | 12.101 | ||||||
| 2026-01-29 | 13F | Rakuten Securities, Inc. | 0 | -100,00 | 0 | |||||
| 2026-02-06 | 13F | Csenge Advisory Group | 0 | -100,00 | 0 | |||||
| 2026-02-12 | 13F | Brown Brothers Harriman & Co | 0 | -100,00 | 0 | |||||
| 2026-02-13 | 13F | Kennedy Capital Management, Inc. | 55.853 | 0,53 | 6.058 | 5,06 | ||||
| 2026-02-10 | 13F | Td Asset Management Inc | 598.750 | 1,63 | 64.946 | 6,21 | ||||
| 2025-11-12 | 13F | Polen Capital Management Llc | 0 | -100,00 | 0 | |||||
| 2026-02-13 | 13F | Cetera Trust Company, N.A | 2.975 | 0,85 | 323 | 5,23 | ||||
| 2026-02-17 | 13F | Edmond De Rothschild Holding S.a. | 0 | -100,00 | 0 | |||||
| 2026-02-17 | 13F | Price T Rowe Associates Inc /md/ | 4.503.409 | -12,27 | 488 | -8,27 | ||||
| 2026-01-14 | 13F | Game Plan Financial Advisors, LLC | 0 | -100,00 | 0 | |||||
| 2026-02-05 | 13F | John G Ullman & Associates Inc | 12.400 | 1.345 | ||||||
| 2026-02-17 | 13F | Northern Trust Corp | 675.334 | -3,06 | 73.253 | 1,31 | ||||
| 2025-11-14 | 13F | Sherbrooke Park Advisers Llc | 0 | -100,00 | 0 | |||||
| 2026-02-02 | 13F | CENTRAL TRUST Co | 140 | 0,00 | 15 | 7,14 | ||||
| 2026-02-03 | 13F | Premier Fund Managers Ltd | 0 | -100,00 | 0 | |||||
| 2026-02-11 | 13F | Simplex Trading, Llc | Put | 61.700 | 140,08 | 6.693 | 334.500,00 | |||
| 2026-01-08 | 13F | Fulton Bank, N.a. | 7.411 | 42,74 | 804 | 49,26 | ||||
| 2026-01-27 | 13F | First Horizon Corp | 39 | 0,00 | 4 | 0,00 | ||||
| 2026-02-11 | 13F | Simplex Trading, Llc | Call | 10.800 | -49,77 | 1.171 | 58.450,00 | |||
| 2026-02-02 | 13F | Principal Financial Group Inc | 238.720 | 4,77 | 25.894 | 9,48 | ||||
| 2026-02-13 | 13F | Umb Bank N A/mo | 958 | 4,70 | 104 | 9,57 | ||||
| 2026-01-27 | 13F | Asset Management One Co., Ltd. | 0 | -100,00 | 0 | |||||
| 2026-01-15 | 13F | Nisa Investment Advisors, Llc | 179 | 0,00 | 19 | 5,56 | ||||
| 2026-02-13 | 13F | Entropy Technologies, LP | 25.297 | 2.744 | ||||||
| 2026-01-30 | 13F/A | M&t Bank Corp | 4.450 | 31,08 | 483 | 36,93 | ||||
| 2026-02-13 | 13F | 1248 Management, LLC | 5.958 | 0,00 | 646 | 4,53 | ||||
| 2026-02-13 | 13F | Squarepoint Ops LLC | Put | 2.200 | 239 | |||||
| 2026-02-13 | 13F | Squarepoint Ops LLC | 268.213 | -11,19 | 29.093 | -7,19 | ||||
| 2026-01-23 | 13F | TFC Financial Management | 7 | 0,00 | 1 | |||||
| 2026-02-04 | 13F | Oregon Public Employees Retirement Fund | 16.594 | -1,78 | 1.800 | 2,62 | ||||
| 2026-02-10 | 13F | Norges Bank | 1.003.001 | 108.796 | ||||||
| 2026-02-13 | 13F | Kestra Advisory Services, LLC | 0 | -100,00 | 0 | |||||
| 2026-02-17 | 13F | Blackstone Group Inc | 24.373 | 261,51 | 2.644 | 278,11 | ||||
| 2026-02-13 | 13F | JustInvest LLC | 9.274 | 10,66 | 1.006 | 15,65 | ||||
| 2026-02-13 | 13F | Public Sector Pension Investment Board | 0 | -100,00 | 0 | |||||
| 2026-02-18 | 13F | State of Tennessee, Treasury Department | 32.774 | -4,11 | 2.984 | -15,90 | ||||
| 2026-02-10 | 13F | State of Wyoming | 1.236 | -2,45 | 134 | 2,29 | ||||
| 2026-02-13 | 13F | Squarepoint Ops LLC | Call | 3.600 | 28,57 | 390 | 34,48 | |||
| 2026-01-20 | 13F | Cromwell Holdings LLC | 15 | 0,00 | 2 | 0,00 | ||||
| 2026-02-12 | 13F | State Board Of Administration Of Florida Retirement System | 75.651 | -4,96 | 8.206 | -0,69 | ||||
| 2025-11-14 | 13F | Cubist Systematic Strategies, LLC | 0 | -100,00 | 0 | |||||
| 2026-02-13 | 13F | Quarry LP | 449 | 13,96 | 49 | 20,00 | ||||
| 2026-02-13 | 13F | DeepCurrents Investment Group LLC | Call | 1.200 | 13.016 | |||||
| 2026-02-02 | 13F | Horizon Investments, LLC | 1.551 | 168 | ||||||
| 2026-02-04 | 13F | Argos Wealth Advisors, LLC | 2.760 | 299 | ||||||
| 2026-01-30 | 13F | New York State Teachers Retirement System | 33.500 | -0,30 | 4 | 0,00 | ||||
| 2026-02-17 | 13F | Balyasny Asset Management Llc | Call | 0 | -100,00 | 0 | ||||
| 2026-01-20 | 13F | AdvisorNet Financial, Inc | 1 | 0,00 | 0 | |||||
| 2026-01-28 | 13F | Geneos Wealth Management Inc. | 12 | 0,00 | 1 | 0,00 | ||||
| 2026-02-13 | 13F | Morgan Stanley | 643.375 | 1,58 | 69.787 | 6,15 | ||||
| 2026-02-13 | 13F | Great West Life Assurance Co /can/ | 46.919 | -24,36 | 5 | -16,67 | ||||
| 2026-02-17 | 13F | Polymer Capital Management (US) LLC | 11.316 | 69,83 | 1.227 | 77,57 | ||||
| 2025-11-14 | 13F | Brevan Howard Capital Management LP | 0 | -100,00 | 0 | |||||
| 2026-04-10 | 13F | Baker Tilly Financial, Llc | 2.719 | -15,66 | 202 | -42,12 | ||||
| 2026-02-17 | 13F | Balyasny Asset Management Llc | 608.116 | -43,77 | 65.962 | -41,24 | ||||
| 2026-02-10 | 13F | Intech Investment Management Llc | 12.411 | 1.346 | ||||||
| 2025-11-07 | 13F | Shell Asset Management Co | 887 | -59,70 | 0 | |||||
| 2026-01-28 | 13F | Teacher Retirement System Of Texas | 14.158 | -43,03 | 1.536 | -40,48 | ||||
| 2026-02-09 | 13F | Smithfield Trust Co | 0 | -100,00 | 0 | |||||
| 2026-02-11 | 13F | Franklin Resources Inc | 926.108 | -35,87 | 100.455 | -32,99 | ||||
| 2025-11-14 | 13F | Voloridge Investment Management, Llc | 0 | -100,00 | 0 | -100,00 | ||||
| 2025-10-30 | 13F | Twin Peaks Wealth Advisors, LLC | 0 | -100,00 | 0 | |||||
| 2025-11-14 | 13F | Wellington Management Group Llp | 0 | -100,00 | 0 | |||||
| 2026-01-28 | 13F | Arizona State Retirement System | 23.351 | -5,89 | 2.533 | -1,67 | ||||
| 2026-02-17 | 13F | Wealth Watch Advisors, INC | 1 | 0,00 | 0 | |||||
| 2026-02-17 | 13F | Junto Capital Management LP | 361.723 | -48,99 | 39.236 | -46,69 | ||||
| 2025-11-13 | 13F | Bokf, Na | 0 | -100,00 | 0 | |||||
| 2026-02-05 | 13F | Thrivent Financial For Lutherans | 20.918 | -2,76 | 2 | 0,00 | ||||
| 2026-02-17 | 13F | Cinctive Capital Management LP | 0 | -100,00 | 0 | |||||
| 2026-02-17 | 13F | Millennium Management Llc | 14.015 | 1.520 | ||||||
| 2026-02-17 | 13F | Millennium Management Llc | Call | 2.100 | 228 | |||||
| 2026-02-17 | 13F | Millennium Management Llc | Put | 3.100 | -50,00 | 336 | -47,74 | |||
| 2026-02-23 | 13F | Virtu Financial LLC | 6.111 | 1 | ||||||
| 2026-02-17 | 13F | Maryland State Retirement & Pension System | 3.950 | 0,00 | 428 | 4,39 | ||||
| 2026-02-13 | 13F | Charles Schwab Investment Management Inc | 871.621 | -2,05 | 94.545 | 2,36 | ||||
| 2026-02-17 | 13F | Steadfast Capital Management Lp | 1.888.992 | 0,00 | 204.899 | 4,50 | ||||
| 2026-02-10 | 13F | BW Gestao de Investimentos Ltda. | 148.552 | 29,11 | 16.113 | 34,92 | ||||
| 2026-02-09 | 13F | Wcm Investment Management, Llc | 167.437 | 18.284 | ||||||
| 2025-11-10 | 13F | AMJ Financial Wealth Management | 0 | -100,00 | 0 | |||||
| 2026-02-10 | 13F | Root Financial Partners, LLC | 127 | 12,39 | 14 | 18,18 | ||||
| 2026-01-14 | 13F | Exchange Traded Concepts, Llc | 9.053 | 17,21 | 982 | 22,47 | ||||
| 2026-02-13 | 13F | Corient IA LLC | 4.000 | 0,00 | 434 | 4,34 | ||||
| 2026-02-17 | 13F | Susquehanna International Group, Llp | Call | 206.000 | 101,57 | 22.345 | 110,63 | |||
| 2026-02-06 | 13F | Tortoise Investment Management, LLC | 0 | -100,00 | 0 | |||||
| 2026-02-06 | 13F | Handelsbanken Fonder AB | 24.881 | -10,44 | 3 | 0,00 | ||||
| 2026-02-17 | 13F | Susquehanna International Group, Llp | Put | 89.800 | 31,67 | 9.741 | 37,59 | |||
| 2026-02-17 | 13F | Monimus Capital Management, Lp | 42.450 | 0,00 | 4.605 | 4,49 | ||||
| 2026-02-11 | 13F | Havemeyer Place LP | 10.392 | 1.127 | ||||||
| 2026-02-12 | 13F | Penserra Capital Management LLC | 456 | -0,87 | 0 | |||||
| 2026-04-10 | 13F | Armstrong Advisory Group, Inc | 100 | 0,00 | 7 | -30,00 | ||||
| 2026-02-17 | 13F | Janus Henderson Group Plc | 36.575 | 0,00 | 3.967 | 4,45 | ||||
| 2026-01-16 | 13F | Marquette Asset Management, LLC | 31 | 3 | ||||||
| 2026-02-12 | 13F | Ci Investments Inc. | 0 | -100,00 | 0 | |||||
| 2026-02-17 | 13F | Caption Management, LLC | Put | 108.100 | 11.726 | |||||
| 2026-02-17 | 13F | Caption Management, LLC | Call | 250.200 | 27.139 | |||||
| 2026-02-17 | 13F | Css Llc/il | Put | 0 | -100,00 | 0 | ||||
| 2026-01-26 | 13F | KBC Group NV | 2.212 | 0,00 | 0 | |||||
| 2026-02-17 | 13F | Freestone Grove Partners LP | 587.343 | 11,32 | 63.709 | 16,33 | ||||
| 2026-02-12 | 13F | Commonwealth Equity Services, Llc | 5.305 | -83,47 | 575 | 19.066,67 | ||||
| 2026-01-27 | 13F | Evergreen Capital Management Llc | 2.358 | -38,77 | 256 | -36,09 | ||||
| 2026-02-17 | 13F | Aqr Capital Management Llc | 8.014 | 20,87 | 869 | 26,31 | ||||
| 2026-02-05 | 13F | Northwestern Mutual Investment Management Company, Llc | 18.567 | -0,74 | 2.014 | 3,71 | ||||
| 2026-02-12 | 13F | Hrt Financial Lp | 65.684 | 398,17 | 7 | 600,00 | ||||
| 2026-02-06 | 13F | Global Retirement Partners, LLC | 38 | 26,67 | 4 | 33,33 | ||||
| 2026-02-17 | 13F | D. E. Shaw & Co., Inc. | 1.097.317 | 43.084,45 | 119.026 | 45.156,65 | ||||
| 2025-11-14 | 13F | Scientech Research LLC | 0 | -100,00 | 0 | -100,00 | ||||
| 2026-01-23 | 13F | Robeco Institutional Asset Management B.V. | 101.764 | 11.038 | ||||||
| 2026-02-17 | 13F | Captrust Financial Advisors | 2.806 | -3,04 | 304 | 1,33 | ||||
| 2025-12-09 | 13F/A | Tudor Investment Corp Et Al | 0 | -100,00 | 0 | -100,00 | ||||
| 2026-01-26 | 13F | La Banque Postale Asset Management SA | 17.521 | -19,06 | 1.901 | -15,41 | ||||
| 2026-02-17 | 13F | Woodline Partners LP | 409.541 | 44.423 | ||||||
| 2026-02-02 | 13F | Truist Financial Corp | 8.836 | -5,90 | 958 | -1,64 | ||||
| 2026-01-23 | 13F | Assetmark, Inc | 11.695 | -5,50 | 1.269 | -1,25 | ||||
| 2026-02-13 | 13F | Atlas Capital Advisors Llc | 7 | 1 | ||||||
| 2026-02-10 | 13F | CIBC World Markets Inc. | 8.662 | 0,64 | 940 | 5,15 | ||||
| 2026-02-17 | 13F | Susquehanna Fundamental Investments, Llc | 0 | -100,00 | 0 | |||||
| 2025-10-23 | 13F | Lecap Asset Management Ltd | 0 | -100,00 | 0 | |||||
| 2026-02-17 | 13F | Susquehanna Portfolio Strategies, LLC | 65.840 | 203,41 | 7.142 | 217,10 | ||||
| 2025-11-14 | 13F | Barrier Capital Management, LLC | 0 | -100,00 | 0 | |||||
| 2026-02-09 | 13F | Annis Gardner Whiting Capital Advisors, LLC | 7 | 0,00 | 1 | |||||
| 2026-01-28 | 13F | N.E.W. Advisory Services LLC | 0 | -100,00 | 0 | |||||
| 2026-02-11 | 13F | Twin Tree Management, LP | Call | 0 | -100,00 | 0 | -100,00 | |||
| 2026-02-13 | 13F | SRS Capital Advisors, Inc. | 319 | -95,88 | 35 | -95,77 | ||||
| 2026-01-09 | 13F | Assenagon Asset Management S.A. | 110.017 | 11.934 | ||||||
| 2026-01-13 | 13F | Mather Group, Llc. | 0 | -100,00 | 0 | |||||
| 2026-01-15 | 13F | Fifth Third Wealth Advisors LLC | 2.955 | -15,98 | 321 | -12,33 | ||||
| 2026-02-17 | 13F | Point72 Asset Management, L.P. | Call | 100.000 | 10.847 | |||||
| 2026-02-17 | 13F | Point72 Asset Management, L.P. | 1.227.987 | 7,33 | 133.200 | 12,16 | ||||
| 2026-02-11 | 13F | Los Angeles Capital Management Llc | 374 | 34 | ||||||
| 2026-02-13 | 13F | Elwood Capital Partners Lp | 70.008 | 0,00 | 7.594 | 4,50 | ||||
| 2025-11-13 | 13F | Inceptionr Llc | 0 | -100,00 | 0 | |||||
| 2026-02-11 | 13F | Picton Mahoney Asset Management | 3.324 | 361 | ||||||
| 2026-02-04 | 13F | Virginia Retirement Systems Et Al | 0 | -100,00 | 0 | -100,00 | ||||
| 2026-02-02 | 13F | Artemis Investment Management LLP | 100.486 | -87,11 | 10.900 | -86,53 | ||||
| 2026-02-13 | 13F | Pathstone Holdings, LLC | 2.965 | -26,63 | 322 | -23,39 | ||||
| 2026-02-17 | 13F | State Of Wisconsin Investment Board | 129.619 | 4,09 | 14.060 | 8,77 | ||||
| 2026-02-05 | 13F | Bessemer Group Inc | 386.034 | 12,55 | 42 | 17,14 | ||||
| 2026-02-10 | 13F | Daiwa Securities Group Inc. | 1.879 | 22,81 | 0 | |||||
| 2026-02-06 | 13F | Profund Advisors Llc | 1.853 | -5,60 | 201 | -1,48 | ||||
| 2026-02-10 | 13F | CIBC Asset Management Inc | 2.634 | 0,00 | 286 | 4,40 | ||||
| 2025-11-14 | 13F | Texas Permanent School Fund | 0 | -100,00 | 0 | |||||
| 2026-02-12 | 13F | Federated Hermes, Inc. | 700.627 | -6,97 | 75.997 | -2,78 | ||||
| 2026-02-13 | 13F | BNP Paribas Asset Management Holding S.A. | 945.106 | 655,10 | 103 | 750,00 | ||||
| 2026-02-17 | 13F | Blair William & Co/il | 100.736 | -1,00 | 10.927 | 3,45 | ||||
| 2026-01-28 | 13F | Klp Kapitalforvaltning As | 18.600 | -4,62 | 2.018 | -0,35 | ||||
| 2026-02-18 | 13F | GWM Advisors LLC | 0 | -100,00 | 0 | |||||
| 2026-02-11 | 13F | Cookson Peirce & Co Inc | 0 | -100,00 | 0 | |||||
| 2026-02-12 | 13F | Johnson Financial Group, Inc. | 25 | 0,00 | 3 | 0,00 | ||||
| 2026-03-16 | 13F | Bank of New Hampshire | 61 | 0,00 | 7 | 0,00 | ||||
| 2026-01-30 | 13F | Moody Aldrich Partners Llc | 2.026 | -0,20 | 220 | 4,29 | ||||
| 2026-01-27 | 13F | Bayforest Capital Ltd | 1.090 | 118 | ||||||
| 2025-11-03 | 13F | LRI Investments, LLC | 0 | -100,00 | 0 | |||||
| 2026-01-08 | 13F | True Wealth Design, LLC | 29 | -43,14 | 3 | -40,00 | ||||
| 2026-02-06 | 13F | Leonteq Securities AG | 1 | 0,00 | 0 | |||||
| 2026-02-17 | 13F | Samlyn Capital, Llc | 0 | -100,00 | 0 | |||||
| 2025-11-14 | 13F | Lido Advisors, LLC | 0 | -100,00 | 0 | |||||
| 2026-02-13 | 13F | Stifel Financial Corp | 8.335 | -0,74 | 904 | 3,79 | ||||
| 2025-11-14 | 13F | Oxford Asset Management Llp | 0 | -100,00 | 0 | -100,00 | ||||
| 2026-02-03 | 13F | Crossmark Global Holdings, Inc. | 5.737 | -3,79 | 622 | 0,65 | ||||
| 2026-02-12 | 13F | MetLife Investment Management, LLC | 44.608 | -5,30 | 4.839 | -1,04 | ||||
| 2026-02-09 | 13F | Coldstream Capital Management Inc | 3.782 | 4,65 | 410 | 9,33 | ||||
| 2026-02-13 | 13F | Verition Fund Management LLC | Put | 0 | -100,00 | 0 | -100,00 | |||
| 2025-11-14 | 13F | Lazard Asset Management Llc | 0 | -100,00 | 0 | |||||
| 2026-02-05 | 13F | Allworth Financial LP | 462 | -3,14 | 50 | 2,04 | ||||
| 2026-01-28 | 13F | B. Metzler seel. Sohn & Co. AG | 24.073 | 2.611 | ||||||
| 2026-02-03 | 13F | Sequoia Financial Advisors, LLC | 2.202 | -99,61 | 239 | -99,59 | ||||
| 2026-02-13 | 13F | Toroso Investments, LLC | 42.493 | 50,79 | 4.609 | 57,57 | ||||
| 2026-01-27 | 13F | Ninety One SA (PTY) Ltd | 145.240 | 0,00 | 15.754 | 4,48 | ||||
| 2026-02-17 | 13F | Two Creeks Capital Management, LP | 461.206 | -15,84 | 50.027 | -12,06 | ||||
| 2026-02-17 | 13F | Credit Agricole S A | 16.433 | 0,00 | 1.782 | 4,52 | ||||
| 2026-02-17 | 13F | Royal Bank Of Canada | 179.287 | -3,65 | 19.447 | 0,68 | ||||
| 2026-02-17 | 13F | Russell Investments Group, Ltd. | 20.049 | 1,86 | 2.175 | 6,41 | ||||
| 2026-02-02 | 13F | Strs Ohio | 2.010 | 0,20 | 218 | 4,81 | ||||
| 2026-01-23 | 13F | State of Alaska, Department of Revenue | 13.416 | 46,14 | 1 | |||||
| 2026-02-10 | 13F | Mutual Of America Capital Management Llc | 34.535 | -10,89 | 3.746 | -6,86 | ||||
| 2026-02-12 | 13F | Quadrant Capital Group Llc | 7.843 | 3,28 | 851 | 7,87 | ||||
| 2025-11-14 | 13F | Mount Yale Investment Advisors, LLC | 0 | -100,00 | 0 | -100,00 | ||||
| 2026-01-09 | 13F | SG Americas Securities, LLC | 26.989 | 7,99 | 3 | 0,00 | ||||
| 2026-03-06 | 13F | Hsbc Holdings Plc | 61.800 | 1.886,50 | 6.726 | 1.988,82 | ||||
| 2026-02-09 | 13F | Hantz Financial Services, Inc. | 1.580 | 291,09 | 0 | |||||
| 2026-02-10 | 13F | Envestnet Asset Management Inc | 116.746 | -7,67 | 12.663 | -3,52 | ||||
| 2026-02-03 | 13F | McIlrath & Eck, LLC | 118 | 0,00 | 13 | 0,00 | ||||
| 2025-11-14 | 13F | Wolverine Trading, Llc | Call | 57.900 | 6.089 | |||||
| 2025-11-14 | 13F | Wolverine Trading, Llc | Put | 15.900 | 1.672 | |||||
| 2026-02-03 | 13F | Ethic Inc. | 12.182 | 15,04 | 1.321 | 20,20 | ||||
| 2026-02-17 | 13F | FIL Ltd | 283.264 | -52,92 | 30.726 | -50,81 | ||||
| 2026-01-29 | 13F | Concord Wealth Partners | 63 | 0,00 | 7 | 0,00 | ||||
| 2026-04-07 | 13F | CoreCap Advisors, LLC | 47 | 0,00 | 3 | -40,00 | ||||
| 2026-04-07 | 13F | Park Avenue Securities Llc | 4.364 | 5,95 | 0 | |||||
| 2026-02-06 | 13F | Vestmark Advisory Solutions, Inc. | 4.455 | 483 | ||||||
| 2025-11-14 | 13F | Qube Research & Technologies Ltd | 0 | -100,00 | 0 | -100,00 | ||||
| 2026-02-13 | 13F | Parkside Financial Bank & Trust | 33 | -84,79 | 4 | -86,36 | ||||
| 2026-01-14 | 13F | ORG Partners LLC | 33 | 4 | ||||||
| 2026-01-29 | 13F | Comerica Bank | 30.783 | -9,24 | 3.339 | -5,17 | ||||
| 2026-02-11 | 13F | Deutsche Bank Ag\ | 496.688 | -0,11 | 53.876 | 4,38 | ||||
| 2026-01-26 | 13F | Private Trust Co Na | 3 | 0,00 | 0 | |||||
| 2026-04-07 | 13F | Signaturefd, Llc | 580 | -3,65 | 43 | -33,85 | ||||
| 2026-02-05 | 13F | HFM Investment Advisors, LLC | 5 | 25,00 | 1 | |||||
| 2026-02-13 | 13F | Marshall Wace, Llp | 5.300 | 575 | ||||||
| 2026-02-13 | 13F | Smartleaf Asset Management LLC | 309 | -30,56 | 34 | -28,26 | ||||
| 2026-01-08 | 13F | Nordea Investment Management Ab | 167.443 | -12,09 | 18.178 | -8,10 | ||||
| 2026-01-30 | 13F | State of New Jersey Common Pension Fund D | 27.809 | -3,66 | 3.016 | 0,67 | ||||
| 2026-02-09 | 13F | Hartland & Co., LLC | 335 | 135,92 | 36 | 157,14 | ||||
| 2026-02-12 | 13F | Brinker Capital Investments, LLC | 11.800 | -4,60 | 1.280 | -0,31 | ||||
| 2026-02-10 | 13F | Bnp Paribas | 90 | -99,30 | 10 | -99,34 | ||||
| 2026-02-17 | 13F | Occudo Quantitative Strategies Lp | 14.540 | 1.577 | ||||||
| 2026-02-13 | 13F | American Century Companies Inc | 372.519 | 53,37 | 40.407 | 60,28 | ||||
| 2026-02-13 | 13F | Commerce Bank | 17.872 | -26,08 | 1.939 | -22,76 | ||||
| 2026-02-17 | 13F | Creative Planning | 11.000 | 17,00 | 1.193 | 22,36 | ||||
| 2026-02-13 | 13F | Arrowstreet Capital, Limited Partnership | 391.150 | 17,45 | 42.428 | 22,73 | ||||
| 2026-02-12 | 13F | Bank Of Montreal /can/ | 8.202 | -21,95 | 890 | -18,44 | ||||
| 2026-02-10 | 13F | New Mexico Educational Retirement Board | 17.000 | 0,00 | 2 | 0,00 | ||||
| 2026-01-27 | 13F | Ninety One North America, Inc. | 36.122 | 3.918 | ||||||
| 2026-02-11 | 13F | Zions Bancorporation, National Association /ut/ | 20.143 | -6,14 | 2.185 | -1,93 | ||||
| 2026-02-17 | 13F | Bamco Inc /ny/ | 1.150.028 | 0,00 | 124.744 | 4,50 | ||||
| 2026-02-17 | 13F | Raymond James Financial Inc | 22.145 | -10,96 | 2.402 | -6,94 | ||||
| 2026-01-29 | 13F | Impax Asset Management Group plc | 194.271 | 0,00 | 21.073 | 4,50 | ||||
| 2026-02-11 | 13F | Manchester Capital Management LLC | 2 | 0 | ||||||
| 2026-02-12 | 13F | Nuveen, LLC | 251.914 | 2,45 | 27.325 | 7,06 | ||||
| 2026-02-12 | 13F | Grey Fox Wealth Advisors, LLC | 0 | -100,00 | 0 | |||||
| 2026-02-17 | 13F | Alliancebernstein L.p. | 100.980 | 1,48 | 10.953 | 6,05 | ||||
| 2025-11-17 | 13F | American Trust | 0 | -100,00 | 0 | |||||
| 2026-02-17 | 13F | Quantinno Capital Management LP | 143.794 | 16,47 | 15.597 | 21,71 | ||||
| 2026-02-06 | 13F | IFP Advisors, Inc | 1.202 | 0,92 | 130 | 5,69 | ||||
| 2026-04-09 | 13F | Wedmont Private Capital | 0 | -100,00 | 0 | |||||
| 2026-01-15 | 13F | Fortitude Family Office, LLC | 26 | 0,00 | 3 | 0,00 | ||||
| 2026-02-17 | 13F | Stansberry Asset Management, Llc | 58.276 | 0,08 | 6.321 | 4,58 | ||||
| 2026-02-17 | 13F | Graham Capital Management, L.P. | 0 | -100,00 | 0 | |||||
| 2026-02-17 | 13F | Driehaus Capital Management Llc | 130.423 | -66,06 | 14.147 | -64,53 | ||||
| 2026-02-05 | 13F | Amalgamated Bank | 39.684 | -3,94 | 4 | 0,00 | ||||
| 2026-04-08 | 13F | Wealth Enhancement Advisory Services, Llc | 8.246 | 81,43 | 604 | 26,10 | ||||
| 2026-02-09 | 13F | Atlantic Trust, LLC | 26 | 333,33 | 3 | |||||
| 2026-02-12 | 13F | Dimensional Fund Advisors Lp | 1.216.215 | 0,87 | 131.926 | 5,41 | ||||
| 2025-11-14 | 13F | Maverick Capital Ltd | 0 | -100,00 | 0 | |||||
| 2026-02-05 | 13F | High Note Wealth, LLC | 43 | 16,22 | 5 | 33,33 | ||||
| 2026-02-13 | 13F | Bridgewater Associates, LP | 6.876 | -81,84 | 746 | -81,04 | ||||
| 2026-02-19 | 13F | CI Private Wealth, LLC | 9.347 | 87,43 | 804 | 55,51 | ||||
| 2025-11-13 | 13F | Quantitative Investment Management, LLC | 0 | -100,00 | 0 | |||||
| 2026-02-09 | 13F | Emerald Advisers, Llc | 4.655 | -4,28 | 505 | 0,00 | ||||
| 2026-01-28 | 13F | Universal- Beteiligungs- und Servicegesellschaft mbH | 19.049 | -47,75 | 2.069 | -45,33 | ||||
| 2025-11-14 | 13F | Skopos Labs, Inc. | 0 | -100,00 | 0 | |||||
| 2026-02-13 | 13F | Barclays Plc | 63.060 | -26,60 | 6.840 | -23,29 | ||||
| 2026-02-09 | 13F | Lisanti Capital Growth, LLC | 37.485 | 4.066 | ||||||
| 2026-02-11 | 13F | Jpmorgan Chase & Co | Call | 85.200 | 10.550,00 | 9.242 | 11.033,73 | |||
| 2025-11-07 | 13F | Fortis Group Advisors, LLC | 0 | -100,00 | 0 | |||||
| 2026-01-14 | 13F | MeadowBrook Investment Advisors LLC | 2.730 | -0,55 | 296 | 4,23 | ||||
| 2026-02-11 | 13F | Jpmorgan Chase & Co | 2.765.398 | -5,13 | 299.963 | -0,87 | ||||
| 2026-02-17 | 13F | Capital Fund Management S.a. | Put | 0 | -100,00 | 0 | ||||
| 2026-02-17 | 13F | Capital Fund Management S.a. | Call | 0 | -100,00 | 0 | ||||
| 2026-01-16 | 13F | Beaumont Financial Advisors, LLC | 2.064 | 1,18 | 224 | 5,69 | ||||
| 2026-02-13 | 13F | Bwcp, Lp | 165.518 | -33,34 | 17.954 | -30,34 | ||||
| 2025-11-14 | 13F | Point72 Hong Kong Ltd | 22.501 | 2.336 | ||||||
| 2026-01-29 | 13F | Inscription Capital, LLC | 4.065 | -4,85 | 441 | -0,68 | ||||
| 2026-04-08 | 13F | DiNuzzo Private Wealth, Inc. | 12 | 0,00 | 1 | -100,00 | ||||
| 2026-02-06 | 13F | Larson Financial Group LLC | 1.145 | 34,07 | 124 | 40,91 | ||||
| 2026-02-09 | 13F | Jackson Creek Investment Advisors LLC | 12.680 | 1 | ||||||
| 2026-02-13 | 13F | Ubs Asset Management Americas Inc | 302.479 | 7,16 | 32.810 | 11,98 | ||||
| 2026-02-17 | 13F | Guggenheim Capital Llc | 4.169 | -35,26 | 452 | -32,34 | ||||
| 2026-02-17 | 13F | Amundi | 119.317 | 42,36 | 12.942 | 57,64 | ||||
| 2026-02-12 | 13F | Rossby Financial, LCC | 23 | 64,29 | 2 | 100,00 | ||||
| 2026-02-03 | 13F | SBI Securities Co., Ltd. | 101 | -2,88 | 11 | 0,00 | ||||
| 2025-11-13 | 13F | Riggs Asset Managment Co. Inc. | 0 | -100,00 | 0 | |||||
| 2026-02-13 | 13F | First Trust Advisors Lp | 33.483 | -55,48 | 3.632 | -53,48 | ||||
| 2026-02-02 | 13F | Danske Bank A/s | 900 | 80,00 | 98 | 90,20 | ||||
| 2026-02-13 | 13F | Public Employees Retirement Association Of Colorado | 8.747 | 0,00 | 1 | |||||
| 2026-02-24 | 13F | Coastline Complete Wealth LLC | 27.046 | 2.815 | ||||||
| 2026-02-10 | 13F | Walter Public Investments Inc. | 93.991 | -50,39 | 10.195 | -48,16 | ||||
| 2026-01-29 | 13F | Aegon Asset Management Uk Plc | 135.589 | 6,55 | 14.706 | 11,28 | ||||
| 2026-02-06 | 13F | Meiji Yasuda Asset Management Co Ltd. | 1.904 | -2,36 | 207 | 1,98 | ||||
| 2026-02-06 | 13F | Bare Financial Services, Inc | 12 | 71,43 | 1 | |||||
| 2026-01-29 | 13F | Kestra Private Wealth Services, Llc | 4.879 | 529 | ||||||
| 2026-02-10 | 13F | Rothschild Investment Llc | 12 | 200,00 | 1 | |||||
| 2026-02-13 | 13F | BRITISH COLUMBIA INVESTMENT MANAGEMENT Corp | 72.353 | -16,60 | 7.848 | -12,84 | ||||
| 2026-02-13 | 13F | Walleye Trading LLC | 0 | -100,00 | 0 | -100,00 | ||||
| 2026-02-14 | 13F | Rockefeller Capital Management L.P. | 3.354 | 33,84 | 364 | 39,62 | ||||
| 2025-11-03 | 13F | Northstar Advisory Group, LLC | 0 | -100,00 | 0 | |||||
| 2026-02-13 | 13F | Mml Investors Services, Llc | 9.811 | 1,26 | 1.064 | 5,87 | ||||
| 2026-02-17 | 13F | Dorsal Capital Management, LLC | 2.750.000 | 18,28 | 298.292 | 23,60 | ||||
| 2026-02-13 | 13F | Glen Eagle Advisors, LLC | 100 | 0,00 | 11 | 0,00 | ||||
| 2026-02-13 | 13F | State Street Corp | 2.477.742 | -1,34 | 268.761 | 3,09 | ||||
| 2026-02-12 | 13F | Jane Street Group, Llc | 19.510 | 356,69 | 2.116 | 377,65 | ||||
| 2026-02-12 | 13F | Jane Street Group, Llc | Call | 67.500 | 44,54 | 7.322 | 51,04 | |||
| 2026-02-17 | 13F | Mirabella Financial Services Llp | 3.842 | 417 | ||||||
| 2026-02-17 | 13F | Fmr Llc | 19.177 | -98,43 | 2.080 | -98,36 | ||||
| 2026-02-12 | 13F | Jane Street Group, Llc | Put | 7.800 | 129,41 | 846 | 140,34 | |||
| 2026-02-06 | 13F | EverSource Wealth Advisors, LLC | 406 | 13,41 | 44 | 18,92 | ||||
| 2026-02-02 | 13F | Hussman Strategic Advisors, Inc. | 0 | -100,00 | 0 | |||||
| 2026-02-17 | 13F | MIRAE ASSET GLOBAL ETFS HOLDINGS Ltd. | 5.785 | -7,96 | 627 | -3,83 | ||||
| 2025-10-24 | 13F | Hemington Wealth Management | 103 | 0,98 | 0 | |||||
| 2026-02-03 | 13F | Everence Capital Management Inc | 2.430 | 0,00 | 0 | |||||
| 2026-02-12 | 13F | Ensign Peak Advisors, Inc | 6.390 | -75,27 | 693 | -74,15 | ||||
| 2026-02-18 | 13F | Mackenzie Financial Corp | 16.535 | -9,76 | 1.802 | -5,26 | ||||
| 2026-02-17 | 13F | XTX Topco Ltd | 8.283 | -56,04 | 898 | -54,09 | ||||
| 2026-02-02 | 13F | Oppenheimer Asset Management Inc. | 7.185 | -14,75 | 779 | -10,87 | ||||
| 2026-02-11 | 13F | O'shaughnessy Asset Management, Llc | 5.722 | -9,16 | 621 | -5,05 | ||||
| 2026-02-13 | 13F | Walleye Capital LLC | Call | 0 | -100,00 | 0 | -100,00 | |||
| 2026-02-13 | 13F | Axa S.a. | 10.590 | -14,67 | 1.149 | -10,87 | ||||
| 2026-02-17 | 13F | Snowden Capital Advisors LLC | 3.255 | -9,03 | 353 | -4,85 | ||||
| 2026-02-09 | 13F | Legal & General Group Plc | 128.228 | -5,54 | 13.909 | -1,29 | ||||
| 2026-01-23 | 13F | Avion Wealth | 9 | 0,00 | 0 | |||||
| 2026-01-14 | 13F | Spire Wealth Management | 5 | 1 | ||||||
| 2026-02-17 | 13F | Mercer Global Advisors Inc /adv | 3.994 | 62,49 | 433 | 69,80 | ||||
| 2026-02-17 | 13F | Jones Financial Companies Lllp | 582 | -5,06 | 63 | 0,00 | ||||
| 2026-01-30 | 13F | Bogart Wealth, LLC | 5 | 1 | ||||||
| 2026-02-13 | 13F | Fieldview Capital Management, LLC | 3.318 | 360 | ||||||
| 2026-02-11 | 13F | Simplex Trading, Llc | 0 | -100,00 | 0 | |||||
| 2026-01-29 | 13F | IMC-Chicago, LLC | Put | 33.100 | 23,97 | 3.590 | 29,56 | |||
| 2026-01-29 | 13F | IMC-Chicago, LLC | Call | 33.100 | 0,61 | 3.590 | 5,12 | |||
| 2026-01-30 | 13F | Us Bancorp \de\ | 7.680 | -2,51 | 833 | 1,96 | ||||
| 2026-02-13 | 13F | Wells Fargo & Company/mn | Call | 84.700 | 345,79 | 9.187 | 365,87 | |||
| 2026-02-17 | 13F | 2Xideas AG | 70.081 | -27,19 | 7.602 | -23,92 | ||||
| 2026-02-13 | 13F | Wells Fargo & Company/mn | 136.106 | 33,29 | 14.763 | 39,29 |