Grundlæggende statistik
| Institutionelle ejere | 133 total, 131 long only, 1 short only, 1 long/short - change of -6,34% MRQ |
| Gennemsnitlig porteføljeallokering | 0.1558 % - change of -18,66% MRQ |
| Institutionelle aktier (lange) | 24.428.876 (ex 13D/G) - change of -3,91MM shares -13,79% MRQ |
| Institutionel værdi (lang) | $ 222.997 USD ($1000) |
Institutionelt ejerskab og aktionærer
PennantPark Floating Rate Capital Ltd. (US:PFLT) har 133 institutionelle ejere og aktionærer, der har indsendt 13D/G- eller 13F-formularer til Securities Exchange Commission (SEC). Disse institutioner har i alt 24,428,876 aktier. Største aktionærer omfatter Sound Income Strategies, LLC, Van Eck Associates Corp, BIZD - VanEck Vectors BDC Income ETF, Altshuler Shaham Ltd, Marshall Wace, Llp, UBS Group AG, Invesco Ltd., KBWD - Invesco KBW High Dividend Yield Financial ETF, Two Sigma Investments, Lp, and Qube Research & Technologies Ltd .
PennantPark Floating Rate Capital Ltd. (NYSE:PFLT) institutionel ejerskabsstruktur viser aktuelle positioner i virksomheden efter institutioner og fonde, samt seneste ændringer i positionsstørrelse. Større aktionærer kan omfatte individuelle investorer, investeringsforeninger, hedgefonde eller institutioner. Skema 13D angiver, at investoren besidder (eller besidder) mere end 5 % af virksomheden og har til hensigt (eller har til hensigt at) aktivt at forfølge en ændring i forretningsstrategi. Skema 13G indikerer en passiv investering på over 5%.
The share price as of September 10, 2025 is 10,15 / share. Previously, on September 11, 2024, the share price was 11,46 / share. This represents a decline of 11,43% over that period.

Fondens stemningsscore
Fund Sentiment Score (fka Ownership Accumulation Score) finder de aktier, der bliver mest købt af fonde. Det er resultatet af en sofistikeret, multi-faktor kvantitativ model, der identificerer virksomheder med de højeste niveauer af institutionel akkumulering. Scoringsmodellen bruger en kombination af den samlede stigning i oplyste ejere, ændringerne i porteføljeallokeringer i disse ejere og andre målinger. Tallet går fra 0 til 100, hvor højere tal indikerer et højere niveau af akkumulering for sine jævnaldrende, og 50 er gennemsnittet.
Opdateringsfrekvens: Dagligt
Se Ownership Explorer, som giver en liste over højest rangerende virksomheder.
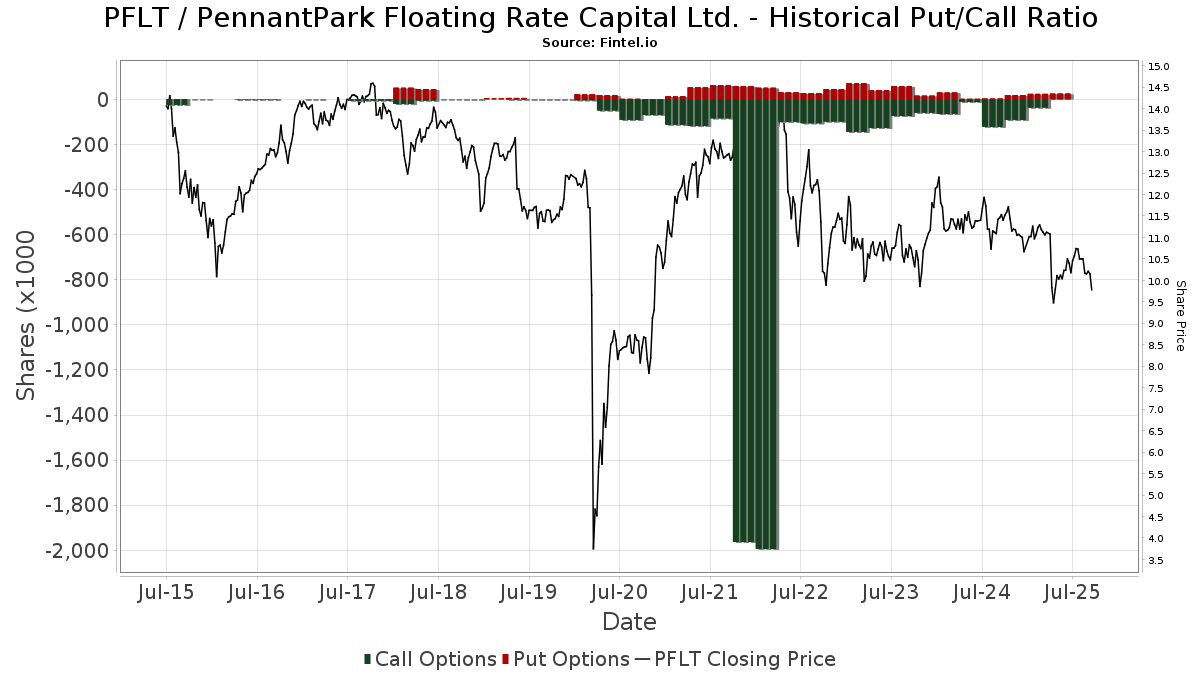
Institutionel Put/Call-forhold
Ud over at indberette standardaktie- og gældsudstedelser skal institutter med mere end 100 mill. aktiver under forvaltning også oplyse deres put- og call-optionsbeholdninger. Da salgsoptioner generelt indikerer negativ stemning, og købsoptioner indikerer positiv stemning, kan vi få en fornemmelse af den overordnede institutionelle stemning ved at plotte forholdet mellem put og kald. Diagrammet til højre viser det historiske put/call-forhold for dette instrument.
Brug af Put/Call Ratio som en indikator for investorernes stemning overvinder en af de vigtigste mangler ved at bruge totalt institutionelt ejerskab, som er, at en betydelig mængde af aktiver under forvaltning investeres passivt for at spore indekser. Passivt forvaltede fonde køber typisk ikke optioner, så indikatoren for put/call-forholdet følger mere nøje følelsen af aktivt forvaltede fonde.
13F og NPORT arkivering
Detaljer om 13F-arkivering er gratis. Detaljer om NP-ansøgninger kræver et premium-medlemskab. Grønne rækker angiver nye positioner. Røde rækker angiver lukkede positioner. Klik på linket ikon for at se den fulde transaktionshistorik.
Opgrader
for at låse premium-data op og eksportere til Excel ![]() .
.
| Fil dato | Kilde | Investor | Type | Gennemsnitlig pris (Øst) |
Aktier | Δ Aktier (%) |
Rapporteret Værdi ($1000) |
Δ Værdi (%) |
Port Alloc (%) |
|
|---|---|---|---|---|---|---|---|---|---|---|
| 2025-08-12 | 13F | Change Path, LLC | 12.006 | 124 | ||||||
| 2025-08-04 | 13F | Muzinich & Co., Inc. | 104.859 | 103,00 | 1.083 | 87,37 | ||||
| 2025-07-29 | 13F | Private Trust Co Na | 2.530 | 0,00 | 26 | -7,14 | ||||
| 2025-07-30 | 13F | FNY Investment Advisers, LLC | 1.200 | 0,00 | 0 | |||||
| 2025-05-15 | 13F | Gwn Securities Inc. | 0 | -100,00 | 0 | -100,00 | ||||
| 2025-08-14 | 13F | Two Sigma Securities, Llc | 0 | -100,00 | 0 | |||||
| 2025-05-14 | 13F | Group One Trading, L.p. | Call | 0 | -100,00 | 0 | -100,00 | |||
| 2025-08-14 | 13F | Van Eck Associates Corp | 2.358.575 | 20,52 | 24 | 14,29 | ||||
| 2025-07-23 | 13F | Fulton Breakefield Broenniman Llc | 11.798 | 0,00 | 122 | -8,33 | ||||
| 2025-08-12 | 13F | Cornerstone Wealth Management, LLC | 64.809 | -12,10 | 669 | -18,91 | ||||
| 2025-08-12 | 13F | LPL Financial LLC | 244.157 | -44,38 | 2.522 | -48,66 | ||||
| 2025-04-22 | 13F | Synergy Financial Management, LLC | 0 | -100,00 | 0 | -100,00 | ||||
| 2025-08-06 | 13F | Commonwealth Equity Services, Llc | 91.475 | 12,50 | 1 | |||||
| 2025-08-11 | 13F | Principal Securities, Inc. | 0 | -100,00 | 0 | |||||
| 2025-05-14 | 13F | Virtus ETF Advisers LLC | 0 | -100,00 | 0 | -100,00 | ||||
| 2025-08-12 | 13F | Trexquant Investment LP | 269.430 | -35,34 | 2.783 | -40,30 | ||||
| 2025-08-07 | 13F | PFG Advisors | 110.108 | 1,81 | 1.137 | -6,03 | ||||
| 2025-07-28 | 13F | BRYN MAWR TRUST Co | 3.363 | 0,00 | 35 | -8,11 | ||||
| 2025-08-05 | 13F | Strategic Financial Concepts, LLC | 63.200 | -1,50 | 648 | -9,76 | ||||
| 2025-08-14 | 13F | D. E. Shaw & Co., Inc. | 0 | -100,00 | 0 | |||||
| 2025-08-13 | 13F | Garner Asset Management Corp | 14.267 | -2,41 | 147 | -9,82 | ||||
| 2025-08-11 | 13F | Pin Oak Investment Advisors Inc | 0 | 0 | ||||||
| 2025-08-08 | 13F | Larson Financial Group LLC | 511 | 41,94 | 5 | 25,00 | ||||
| 2025-08-12 | 13F | Global Retirement Partners, LLC | 3.928 | -79,34 | 41 | -80,68 | ||||
| 2025-08-13 | 13F | Continuum Advisory, LLC | 0 | -100,00 | 0 | |||||
| 2025-04-24 | 13F | Allspring Global Investments Holdings, LLC | 0 | -100,00 | 0 | -100,00 | ||||
| 2025-07-08 | 13F | Parallel Advisors, LLC | 0 | -100,00 | 0 | |||||
| 2025-08-04 | 13F | Creekmur Asset Management LLC | 9 | 12,50 | 0 | |||||
| 2025-08-07 | 13F | Allworth Financial LP | 2.777 | 1.603,68 | 29 | 2.700,00 | ||||
| 2025-08-14 | 13F | Schonfeld Strategic Advisors LLC | 18.126 | 187 | ||||||
| 2025-08-11 | 13F | Empowered Funds, LLC | 10.193 | -8,33 | 105 | -15,32 | ||||
| 2025-07-28 | NP | FXED - Sound Enhanced Fixed Income ETF | 104.495 | 1,12 | 1.076 | -8,11 | ||||
| 2025-04-10 | 13F | Firethorn Wealth Partners, Llc | 0 | -100,00 | 0 | -100,00 | ||||
| 2025-04-23 | 13F | Walkner Condon Financial Advisors LLC | 0 | -100,00 | 0 | -100,00 | ||||
| 2025-07-17 | 13F | Vermillion Wealth Management, Inc. | 500 | 0,00 | 5 | 0,00 | ||||
| 2025-09-04 | 13F/A | Advisor Group Holdings, Inc. | 162.389 | 38,36 | 1.678 | 27,72 | ||||
| 2025-08-13 | 13F | Lido Advisors, LLC | 16.381 | 171 | ||||||
| 2025-08-07 | 13F | Resources Investment Advisors, LLC. | 12.543 | 0,00 | 130 | -7,86 | ||||
| 2025-08-14 | 13F | Aquatic Capital Management LLC | 0 | -100,00 | 0 | |||||
| 2025-08-13 | 13F | Virtus Investment Advisers, Inc. | 88.549 | -10,61 | 915 | -17,51 | ||||
| 2025-08-12 | 13F | BlackRock, Inc. | 500.758 | 30,73 | 5.173 | 20,67 | ||||
| 2025-08-21 | NP | BIZD - VanEck Vectors BDC Income ETF | 2.247.824 | 16,02 | 23.220 | 7,11 | ||||
| 2025-08-06 | 13F | Golden State Wealth Management, LLC | 9.756 | 101 | ||||||
| 2025-08-11 | 13F | Citigroup Inc | 34.398 | 218,56 | 355 | 195,83 | ||||
| 2025-07-10 | 13F | Sovran Advisors, LLC | 34.184 | 2,01 | 361 | 10,77 | ||||
| 2025-08-11 | 13F | Delta Asset Management Llc/tn | 943 | 0,00 | 10 | -10,00 | ||||
| 2025-08-14 | 13F | Mariner, LLC | 13.296 | 137 | ||||||
| 2025-08-13 | 13F | Marshall Wace, Llp | 1.439.742 | -16,75 | 14.873 | -23,15 | ||||
| 2025-08-14 | 13F | Mpwm Advisory Solutions, Llc | 5.000 | 0,00 | 52 | -7,27 | ||||
| 2025-08-14 | 13F | Sunbelt Securities, Inc. | 8.224 | -26,73 | 90 | -28,80 | ||||
| 2025-08-08 | 13F | Investment Partners, Ltd. | 10.000 | 0,00 | 103 | -7,21 | ||||
| 2025-08-14 | 13F | Royal Bank Of Canada | 19.604 | -32,18 | 202 | -37,46 | ||||
| 2025-07-18 | 13F | SOA Wealth Advisors, LLC. | 0 | -100,00 | 0 | |||||
| 2025-08-06 | 13F | AE Wealth Management LLC | 21.641 | 18,74 | 224 | 9,85 | ||||
| 2025-08-14 | 13F | Brevan Howard Capital Management LP | 141.985 | 118,14 | 1.467 | 101,37 | ||||
| 2025-05-08 | 13F | We Are One Seven, LLC | 0 | -100,00 | 0 | -100,00 | ||||
| 2025-08-13 | 13F | Guggenheim Capital Llc | 51.986 | 6,32 | 537 | -1,83 | ||||
| 2025-08-14 | 13F | Financial Network Wealth Advisors LLC | 1.426 | 0,00 | 15 | -6,67 | ||||
| 2025-08-14 | 13F | AllSquare Wealth Management LLC | 9.200 | 0,00 | 95 | -6,86 | ||||
| 2025-08-13 | 13F | Northern Trust Corp | 41.596 | 181,36 | 430 | 160,00 | ||||
| 2025-08-14 | 13F | Glenview Trust Co | 10.650 | 110 | ||||||
| 2025-05-12 | 13F | Simplex Trading, Llc | Call | 0 | -100,00 | 0 | ||||
| 2025-04-29 | 13F | Raleigh Capital Management Inc. | 0 | -100,00 | 0 | -100,00 | ||||
| 2025-08-13 | 13F | M&t Bank Corp | 21.899 | 0,00 | 226 | -7,76 | ||||
| 2025-05-12 | 13F | National Bank Of Canada /fi/ | 0 | -100,00 | 0 | |||||
| 2025-07-18 | 13F | PFG Investments, LLC | 118.908 | 5,61 | 1.228 | -2,46 | ||||
| 2025-05-29 | NP | JAFEX - Total Stock Market Index Trust NAV | 19 | -97,50 | 0 | -100,00 | ||||
| 2025-08-13 | 13F | Quadrature Capital Ltd | 0 | -100,00 | 0 | |||||
| 2025-08-12 | 13F | Entropy Technologies, LP | 12.594 | -80,06 | 130 | -81,59 | ||||
| 2025-06-27 | NP | LBO - WHITEWOLF Publicly Listed Private Equity ETF | 11.119 | 14,28 | 112 | 3,70 | ||||
| 2025-08-12 | 13F | Calton & Associates, Inc. | 10.938 | 113 | ||||||
| 2025-08-08 | 13F | Strategies Wealth Advisors, LLC | 12.921 | 2,96 | 133 | -5,00 | ||||
| 2025-05-08 | 13F | Arkadios Wealth Advisors | 0 | -100,00 | 0 | -100,00 | ||||
| 2025-08-12 | 13F | PSI Advisors, LLC | 0 | -100,00 | 0 | |||||
| 2025-08-13 | 13F | Quantbot Technologies LP | 21.234 | 219 | ||||||
| 2025-08-14 | 13F | Bnp Paribas Arbitrage, Sa | 5.284 | 55 | ||||||
| 2025-08-14 | 13F | Nebula Research & Development LLC | 56.045 | 31,09 | 579 | 20,92 | ||||
| 2025-08-06 | 13F | Yelin Lapidot Holdings Management Ltd. | 19.500 | 0,00 | 201 | -7,80 | ||||
| 2025-05-15 | 13F | Oxford Asset Management Llp | 12.186 | 136 | ||||||
| 2025-08-15 | 13F | Tower Research Capital LLC (TRC) | 358 | -92,84 | 4 | -94,55 | ||||
| 2025-08-14 | 13F | Altshuler Shaham Ltd | 1.730.086 | 9,98 | 17.872 | 1,52 | ||||
| 2025-07-30 | 13F | Mid-American Wealth Advisory Group, Inc. | 485 | 5 | ||||||
| 2025-07-28 | 13F | Harbour Investments, Inc. | 1.000 | 0,00 | 10 | -9,09 | ||||
| 2025-08-13 | 13F | EverSource Wealth Advisors, LLC | 1.452 | 1.257,01 | 15 | 1.300,00 | ||||
| 2025-05-12 | 13F | Fmr Llc | 0 | -100,00 | 0 | |||||
| 2025-08-12 | 13F | Magnetar Financial LLC | 0 | -100,00 | 0 | |||||
| 2025-08-12 | 13F | Advisors Asset Management, Inc. | 329.829 | -0,39 | 3.407 | -8,04 | ||||
| 2025-07-17 | 13F | Sound Income Strategies, LLC | 3.904.625 | 8,91 | 40.335 | 0,54 | ||||
| 2025-08-14 | 13F | Camden Capital, LLC | 26.658 | 0,00 | 275 | -7,72 | ||||
| 2025-07-29 | 13F | TrueMark Investments, LLC | 0 | -100,00 | 0 | -100,00 | ||||
| 2025-08-14 | 13F | Raymond James Financial Inc | 25.177 | -18,34 | 260 | -24,42 | ||||
| 2025-08-11 | 13F | HighTower Advisors, LLC | 95.188 | -1,24 | 983 | -8,81 | ||||
| 2025-08-14 | 13F | Murphy & Mullick Capital Management Corp | 1.038 | 2,67 | 11 | -9,09 | ||||
| 2025-08-14 | 13F | Ameriprise Financial Inc | 69.959 | 7,41 | 707 | -3,28 | ||||
| 2025-08-11 | 13F | NewEdge Wealth, LLC | 295.639 | 3,33 | 3.075 | -3,97 | ||||
| 2025-08-14 | 13F | Hrt Financial Lp | 0 | -100,00 | 0 | |||||
| 2025-08-26 | NP | MCTOX - Modern Capital Tactical Opportunities Fund Class A Shares | 0 | -100,00 | 0 | -100,00 | ||||
| 2025-08-13 | 13F | Russell Investments Group, Ltd. | 0 | -100,00 | 0 | |||||
| 2025-07-17 | 13F | Janney Montgomery Scott LLC | 41.874 | -4,21 | 0 | |||||
| 2025-08-14 | 13F | Balyasny Asset Management Llc | 243.615 | -58,07 | 2.517 | -61,30 | ||||
| 2025-08-14 | 13F | Citadel Advisors Llc | 0 | -100,00 | 0 | |||||
| 2025-04-21 | 13F | Ronald Blue Trust, Inc. | 0 | -100,00 | 0 | -100,00 | ||||
| 2025-08-14 | 13F | Bank Of America Corp /de/ | 14.429 | -3,74 | 149 | -10,78 | ||||
| 2025-08-11 | 13F | Private Advisor Group, LLC | 16.438 | 2,41 | 170 | -5,59 | ||||
| 2025-07-11 | 13F | Farther Finance Advisors, LLC | 1.594 | 5,15 | 16 | 0,00 | ||||
| 2025-08-13 | 13F | ExodusPoint Capital Management, LP | 32.900 | -54,18 | 0 | |||||
| 2025-08-14 | 13F | Group One Trading, L.p. | 95 | 0,00 | 1 | -100,00 | ||||
| 2025-07-18 | 13F | Truist Financial Corp | 15.795 | 5,12 | 163 | -2,98 | ||||
| 2025-08-12 | 13F | MAI Capital Management | 3.296 | -4,79 | 34 | -10,53 | ||||
| 2025-05-16 | 13F/A | Goldman Sachs Group Inc | 0 | -100,00 | 0 | -100,00 | ||||
| 2025-08-13 | 13F | Jump Financial, LLC | 20.995 | 217 | ||||||
| 2025-07-22 | 13F | Miracle Mile Advisors, LLC | 11.388 | 2,97 | 118 | -4,88 | ||||
| 2025-08-01 | 13F | Y-Intercept (Hong Kong) Ltd | 207.207 | 734,74 | 2.140 | 672,56 | ||||
| 2025-08-12 | 13F | Hillsdale Investment Management Inc. | 0 | -100,00 | 0 | |||||
| 2025-08-14 | 13F | Susquehanna International Group, Llp | 110.971 | 328,51 | 1.146 | 296,54 | ||||
| 2025-08-12 | 13F | Dynamic Technology Lab Private Ltd | 14.271 | 5,32 | 147 | -2,65 | ||||
| 2025-08-13 | 13F | PharVision Advisers, LLC | 0 | -100,00 | 0 | |||||
| 2025-08-14 | 13F | Scoggin Management Lp | 0 | -100,00 | 0 | |||||
| 2025-08-06 | 13F | First Horizon Advisors, Inc. | 566 | 6 | ||||||
| 2025-08-12 | 13F | Virtu Financial LLC | 0 | -100,00 | 0 | |||||
| 2025-08-14 | 13F | Wells Fargo & Company/mn | 94.376 | 245,17 | 975 | 219,34 | ||||
| 2025-08-14 | 13F | Stifel Financial Corp | 58.603 | -2,99 | 605 | -10,37 | ||||
| 2025-08-11 | 13F | Synergy Investment Management, LLC | 25.011 | 10,42 | 258 | 1,98 | ||||
| 2025-08-14 | 13F | GWM Advisors LLC | 4.714 | 0,00 | 49 | -7,69 | ||||
| 2025-08-12 | 13F | CIBC Private Wealth Group, LLC | 7.122 | 0,00 | 74 | 12,31 | ||||
| 2025-08-14 | 13F | Millennium Management Llc | 720.074 | -39,83 | 7.438 | -44,46 | ||||
| 2025-08-08 | 13F | Hartland & Co., LLC | 0 | -100,00 | 0 | |||||
| 2025-04-30 | 13F | POM Investment Strategies, LLC | 0 | -100,00 | 0 | -100,00 | ||||
| 2025-08-12 | 13F | Proequities, Inc. | Put | 0 | 0 | |||||
| 2025-08-14 | 13F | Citadel Advisors Llc | Put | 22.900 | 116,04 | 237 | 100,00 | |||
| 2025-08-12 | 13F | Proequities, Inc. | Call | 0 | 0 | |||||
| 2025-08-14 | 13F | Two Sigma Advisers, Lp | 653.075 | -48,63 | 6.746 | -52,58 | ||||
| 2025-08-12 | 13F | Proequities, Inc. | 0 | 0 | ||||||
| 2025-08-14 | 13F | First Foundation Advisors | 12.393 | 0,00 | 128 | -7,25 | ||||
| 2025-07-31 | 13F | Optimum Investment Advisors | 17.500 | 0,00 | 181 | -7,69 | ||||
| 2025-07-31 | 13F | Sumitomo Mitsui Trust Holdings, Inc. | 81.236 | 57,27 | 839 | 45,16 | ||||
| 2025-06-25 | NP | VPC - Virtus Private Credit Strategy ETF | 90.483 | 1,15 | 915 | -8,69 | ||||
| 2025-08-14 | 13F | Citadel Advisors Llc | Call | 0 | -100,00 | 0 | ||||
| 2025-08-05 | 13F | Huntington National Bank | 0 | -100,00 | 0 | |||||
| 2025-08-14 | 13F | UBS Group AG | 1.117.647 | 81,73 | 11.545 | 67,76 | ||||
| 2025-07-17 | 13F | GraniteShares Advisors LLC | 255.250 | 6,67 | 2.637 | -1,53 | ||||
| 2025-08-12 | 13F | XTX Topco Ltd | 0 | -100,00 | 0 | |||||
| 2025-08-26 | NP | FTKI - First Trust Small Cap BuyWrite Income ETF | 0 | -100,00 | 0 | -100,00 | ||||
| 2025-07-16 | 13F | ORG Partners LLC | 1.500 | 0,00 | 16 | -6,25 | ||||
| 2025-08-11 | 13F | Hexagon Capital Partners LLC | 0 | -100,00 | 0 | |||||
| 2025-07-28 | NP | KBWD - Invesco KBW High Dividend Yield Financial ETF This fund is a listed as child fund of Invesco Ltd. and if that institution has disclosed ownership in this security, then these positions will not be double counted when calculating total shares and total value | 1.032.944 | 5,54 | 10.639 | -4,14 | ||||
| 2025-08-14 | 13F | Beacon Investment Advisors Llc | 19.886 | 1,36 | 204 | -7,31 | ||||
| 2025-08-27 | 13F/A | Squarepoint Ops LLC | 0 | -100,00 | 0 | -100,00 | ||||
| 2025-07-15 | 13F | Graypoint LLC | 75.302 | 2,96 | 778 | -5,01 | ||||
| 2025-07-09 | 13F | Westbourne Investments, Inc. | 19.175 | -5,59 | 198 | -12,78 | ||||
| 2025-07-24 | 13F | Us Bancorp \de\ | 4.000 | -0,12 | 41 | -6,82 | ||||
| 2025-08-29 | NP | GraniteShares ETF Trust - GraniteShares HIPS US High Income ETF | 255.250 | 6,67 | 2.637 | -1,53 | ||||
| 2025-08-13 | 13F | Natixis | 44.576 | 0,00 | 460 | -7,63 | ||||
| 2025-08-14 | 13F | Qube Research & Technologies Ltd | 798.816 | -20,27 | 8.252 | -26,40 | ||||
| 2025-08-12 | 13F | Jpmorgan Chase & Co | 51.706 | -41,10 | 534 | -45,62 | ||||
| 2025-07-25 | 13F | Cwm, Llc | 4.771 | 0 | ||||||
| 2025-07-31 | 13F | Cambridge Investment Research Advisors, Inc. | 78.176 | 32,39 | 1 | |||||
| 2025-08-15 | 13F | Morgan Stanley | 388.070 | -30,43 | 4.009 | -35,78 | ||||
| 2025-04-22 | 13F | Jmac Enterprises Llc | 0 | -100,00 | 0 | -100,00 | ||||
| 2025-07-31 | 13F | Caitong International Asset Management Co., Ltd | 177 | 17.600,00 | 2 | |||||
| 2025-08-13 | 13F | Invesco Ltd. | 1.076.310 | 2,52 | 11.118 | -5,35 | ||||
| 2025-08-14 | 13F | Jane Street Group, Llc | 0 | -100,00 | 0 | |||||
| 2025-08-14 | 13F | State Street Corp | 84.170 | 257,74 | 878 | 231,32 | ||||
| 2025-07-30 | 13F | Denali Advisors Llc | 69.103 | -2,61 | 714 | -10,09 | ||||
| 2025-07-24 | 13F | IFP Advisors, Inc | 3.434 | 3,00 | 35 | -5,41 | ||||
| 2025-08-05 | 13F | Simplex Trading, Llc | 30.528 | 2.375,91 | 0 | |||||
| 2025-08-08 | 13F | Cetera Investment Advisers | 63.704 | 2,13 | 658 | -5,60 | ||||
| 2025-08-05 | 13F | Simplex Trading, Llc | Put | 2.400 | 200,00 | 0 | ||||
| 2025-05-30 | NP | ERNZ - TrueShares Active Yield ETF | 310.616 | 735,71 | 3.476 | 755,91 | ||||
| 2025-08-01 | 13F | Envestnet Asset Management Inc | 36.933 | -1,67 | 382 | -9,29 | ||||
| 2025-08-06 | 13F | Wedbush Securities Inc | 139.202 | 5,04 | 1 | 0,00 | ||||
| 2025-05-01 | 13F | MQS Management LLC | 0 | -100,00 | 0 | -100,00 | ||||
| 2025-07-29 | 13F | Harbor Asset Planning, Inc. | 526 | 5 | ||||||
| 2025-08-12 | 13F | Legal & General Group Plc | 578.019 | 4,20 | 5.974 | -3,55 | ||||
| 2025-08-15 | 13F | CI Private Wealth, LLC | 53.747 | 247,00 | 555 | 220,81 | ||||
| 2025-08-14 | 13F | Quarry LP | 0 | -100,00 | 0 | |||||
| 2025-05-16 | 13F | Coppell Advisory Solutions LLC | 0 | -100,00 | 0 | |||||
| 2025-08-08 | 13F | Foundations Investment Advisors, LLC | 16.652 | 172 | ||||||
| 2025-04-24 | 13F | Mirae Asset Global Investments Co., Ltd. | 0 | -100,00 | 0 | -100,00 | ||||
| 2025-08-13 | 13F | Northwestern Mutual Wealth Management Co | 4.000 | 41 | ||||||
| 2025-08-15 | 13F | Great West Life Assurance Co /can/ | 86.588 | 3,37 | 1 | |||||
| 2025-08-14 | 13F | Two Sigma Investments, Lp | 942.801 | -45,81 | 9.739 | -49,97 | ||||
| 2025-07-31 | 13F | Sage Mountain Advisors LLC | 10.000 | 0,00 | 103 | -7,21 | ||||
| 2025-08-14 | 13F | Susquehanna International Group, Llp | Call | 0 | -100,00 | 0 | ||||
| 2025-08-14 | 13F | DRW Securities, LLC | 33.593 | 347 | ||||||
| 2025-08-14 | 13F | Susquehanna International Group, Llp | Put | 0 | -100,00 | 0 | ||||
| 2025-08-14 | 13F | Toroso Investments, LLC | 105.656 | 2,25 | 1.091 | -5,62 | ||||
| 2025-08-05 | 13F | Sigma Planning Corp | 10.439 | 0,53 | 108 | -7,76 | ||||
| 2025-05-12 | 13F | Connor, Clark & Lunn Investment Management Ltd. | 0 | -100,00 | 0 | -100,00 |
Other Listings
| GB:0KH0 | 10,16 $ |