Grundlæggende statistik
| Institutionelle aktier (lange) | 99.130.840 - 58,64% (ex 13D/G) - change of -21,06MM shares -17,53% MRQ |
| Institutionel værdi (lang) | $ 5.643.382 USD ($1000) |
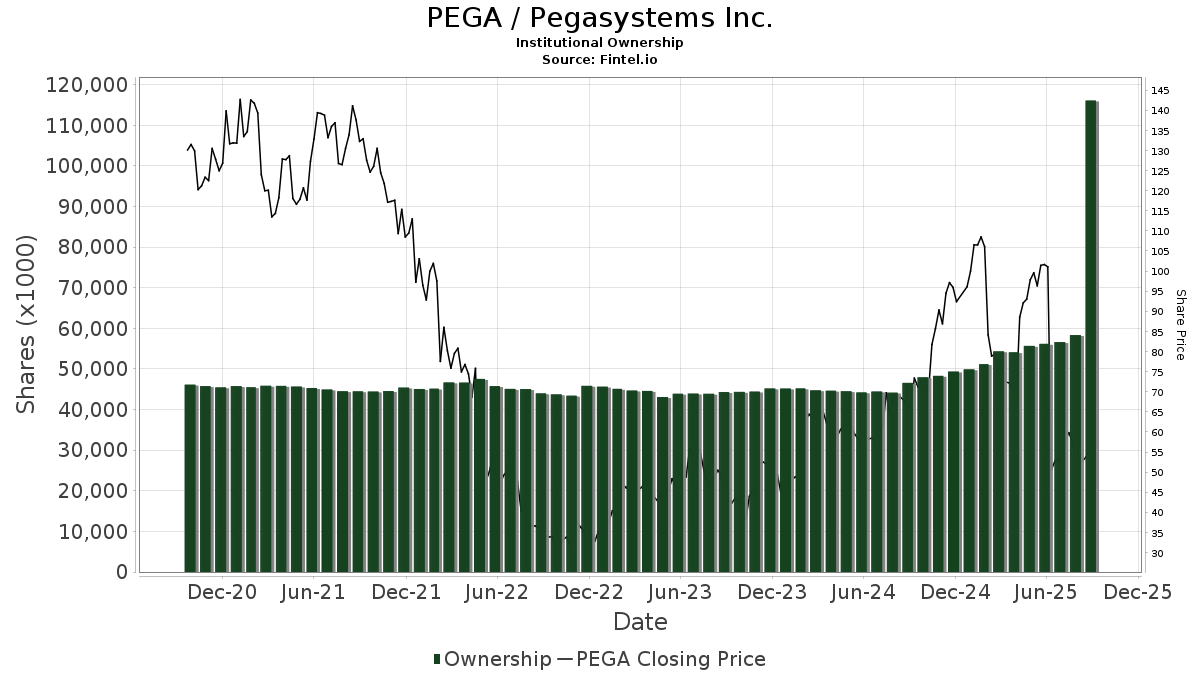
Institutionelt ejerskab og aktionærer
Pegasystems Inc. (US:PEGA) har 476 institutionelle ejere og aktionærer, der har indsendt 13D/G- eller 13F-formularer til Securities Exchange Commission (SEC). Disse institutioner har i alt 99,130,840 aktier. Største aktionærer omfatter Vanguard Group Inc, BlackRock, Inc., Massachusetts Financial Services Co /ma/, Bares Capital Management, Inc., Invesco Ltd., Aqr Capital Management Llc, State Street Corp, Wellington Management Group Llp, Dimensional Fund Advisors Lp, and North Peak Capital Management, LLC .
Pegasystems Inc. (NasdaqGS:PEGA) institutionel ejerskabsstruktur viser aktuelle positioner i virksomheden efter institutioner og fonde, samt seneste ændringer i positionsstørrelse. Større aktionærer kan omfatte individuelle investorer, investeringsforeninger, hedgefonde eller institutioner. Skema 13D angiver, at investoren besidder (eller besidder) mere end 5 % af virksomheden og har til hensigt (eller har til hensigt at) aktivt at forfølge en ændring i forretningsstrategi. Skema 13G indikerer en passiv investering på over 5%.
The share price as of April 17, 2026 is 43,61 / share. Previously, on April 21, 2025, the share price was 33,20 / share. This represents an increase of 31,38% over that period.
Fondens stemningsscore
Fund Sentiment Score (fka Ownership Accumulation Score) finder de aktier, der bliver mest købt af fonde. Det er resultatet af en sofistikeret, multi-faktor kvantitativ model, der identificerer virksomheder med de højeste niveauer af institutionel akkumulering. Scoringsmodellen bruger en kombination af den samlede stigning i oplyste ejere, ændringerne i porteføljeallokeringer i disse ejere og andre målinger. Tallet går fra 0 til 100, hvor højere tal indikerer et højere niveau af akkumulering for sine jævnaldrende, og 50 er gennemsnittet.
Opdateringsfrekvens: Dagligt
Se Ownership Explorer, som giver en liste over højest rangerende virksomheder.
AI+ Ask Fintel’s AI assistant about Pegasystems Inc..
Select a question to share a public post with an AI-crafted answer.
Thinking of good questions…
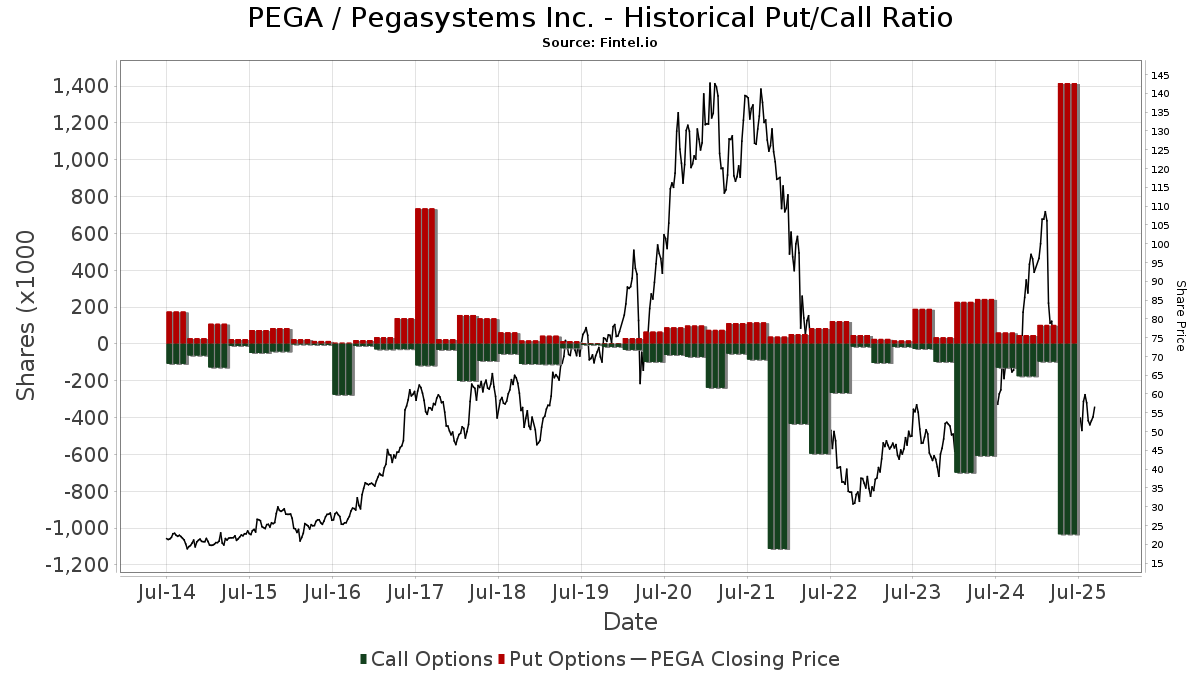
Institutionel Put/Call-forhold
Ud over at indberette standardaktie- og gældsudstedelser skal institutter med mere end 100 mill. aktiver under forvaltning også oplyse deres put- og call-optionsbeholdninger. Da salgsoptioner generelt indikerer negativ stemning, og købsoptioner indikerer positiv stemning, kan vi få en fornemmelse af den overordnede institutionelle stemning ved at plotte forholdet mellem put og kald. Diagrammet til højre viser det historiske put/call-forhold for dette instrument.
Brug af Put/Call Ratio som en indikator for investorernes stemning overvinder en af de vigtigste mangler ved at bruge totalt institutionelt ejerskab, som er, at en betydelig mængde af aktiver under forvaltning investeres passivt for at spore indekser. Passivt forvaltede fonde køber typisk ikke optioner, så indikatoren for put/call-forholdet følger mere nøje følelsen af aktivt forvaltede fonde.
13D/G-arkivering
Vi præsenterer 13D/G ansøgninger separat fra 13F ansøgninger på grund af den forskellige behandling af SEC. 13D/G-ansøgninger kan indgives af grupper af investorer (med én ledende), hvorimod 13F-ansøgninger ikke kan. Dette resulterer i situationer, hvor en investor kan indsende en 13D/G, der rapporterer én værdi for de samlede aktier (der repræsenterer alle de aktier, der ejes af investorgruppen), men derefter indsender en 13F, der rapporterer en anden værdi for de samlede aktier (der udelukkende repræsenterer deres egne) ejendomsret). Det betyder, at aktieejerskab af 13D/G-arkiver og 13F-arkiveringer ofte ikke er direkte sammenlignelige, så vi præsenterer dem separat.
Bemærk: Fra den 16. maj 2021 viser vi ikke længere ejere, der ikke har indsendt en 13D/G inden for det seneste år. Tidligere viste vi den fulde historie af 13D/G-arkiver. Generelt skal enheder, der er forpligtet til at indgive 13D/G-ansøgninger, indgive mindst årligt, før de indsender en afsluttende ansøgning. Dog forlader fonde nogle gange positioner uden at indsende en afsluttende ansøgning (dvs. de afvikler), så visning af den fulde historie resulterede nogle gange i forvirring om det nuværende ejerskab. For at undgå forvirring viser vi nu kun 'aktuelle' ejere - det vil sige - ejere, der har anmeldt inden for det seneste år.
Upgrade to unlock premium data.
| Fil dato | Form | Investor | Forrige Aktier |
Seneste Aktier |
Δ Aktier (Procent) |
Ejendomsret (Procent) |
Δ Ejerskab (Procent) |
|
|---|---|---|---|---|---|---|---|---|
| 2025-11-12 | TREFLER ALAN | 79,491,956 | 79,197,377 | -0.37 | 46.00 | 0.00 | ||
| 2025-07-17 | BlackRock, Inc. | 8,671,803 | 5.10 |
13F og NPORT arkivering
Detaljer om 13F-arkivering er gratis. Detaljer om NP-ansøgninger kræver et premium-medlemskab. Grønne rækker angiver nye positioner. Røde rækker angiver lukkede positioner. Klik på linket ikon for at se den fulde transaktionshistorik.
Opgrader
for at låse premium-data op og eksportere til Excel ![]() .
.
| Fil dato | Kilde | Investor | Type | Gennemsnitlig pris (Øst) |
Aktier | Δ Aktier (%) |
Rapporteret Værdi ($1000) |
Δ Værdi (%) |
Port Alloc (%) |
|
|---|---|---|---|---|---|---|---|---|---|---|
| 2025-11-05 | 13F | Beacon Harbor Wealth Advisors, Inc. | 0 | -100,00 | 0 | |||||
| 2026-02-11 | 13F | United Financial Planning Group LLC | 6 | 0 | ||||||
| 2026-02-11 | 13F | Twin Tree Management, LP | Call | 23.700 | -67,08 | 1.415 | -65,82 | |||
| 2026-01-28 | 13F | Chicago Partners Investment Group LLC | 4.487 | 2,05 | 226 | -21,25 | ||||
| 2026-02-06 | 13F | Global Retirement Partners, LLC | 1.046 | -21,41 | 62 | -18,42 | ||||
| 2025-11-12 | 13F | Intech Investment Management Llc | 0 | -100,00 | 0 | -100,00 | ||||
| 2026-02-17 | 13F | Balyasny Asset Management Llc | 0 | -100,00 | 0 | |||||
| 2026-02-17 | 13F | California State Teachers Retirement System | 87.869 | -0,10 | 5.248 | 3,76 | ||||
| 2026-02-04 | 13F | Securian Asset Management, Inc | 6.679 | -3,45 | 399 | 0,25 | ||||
| 2026-02-13 | 13F | Ieq Capital, Llc | 134.221 | -34,54 | 8.016 | -32,02 | ||||
| 2026-01-30 | 13F | CBOE Vest Financial, LLC | 57.527 | 118,34 | 3.436 | 126,73 | ||||
| 2026-01-28 | 13F | DekaBank Deutsche Girozentrale | 4.634 | 0,00 | 0 | |||||
| 2026-01-15 | 13F | Allspring Global Investments Holdings, LLC | 374.645 | 71,14 | 21.003 | 68,16 | ||||
| 2026-02-10 | 13F | KERR FINANCIAL PLANNING Corp | 200 | 8 | ||||||
| 2026-02-12 | 13F | Wealthspire Advisors, LLC | 0 | -100,00 | 0 | |||||
| 2026-02-17 | 13F | Modern Wealth Management, LLC | 3.526 | 211 | ||||||
| 2026-04-15 | 13F | Exchange Traded Concepts, Llc | 1.278 | -73,17 | 54 | -80,99 | ||||
| 2026-04-17 | 13F | Krilogy Financial LLC | 6.955 | -22,70 | 301 | -33,99 | ||||
| 2026-01-15 | 13F | Burns Matteson Capital Management, LLC | 0 | -100,00 | 0 | |||||
| 2026-02-09 | 13F | Quest Partners LLC | 3.599 | 87,55 | 215 | 94,55 | ||||
| 2026-02-17 | 13F | Advisory Services Network, LLC | 25.178 | 1,64 | 1.504 | 5,55 | ||||
| 2026-02-03 | 13F | Mitsubishi UFJ Kokusai Asset Management Co., Ltd. | 442 | 0,00 | 25 | -4,00 | ||||
| 2026-01-23 | 13F | Westside Investment Management, Inc. | 34 | 2 | ||||||
| 2026-04-15 | 13F | Merit Financial Group, LLC | 18.081 | 2,83 | 770 | -26,76 | ||||
| 2026-02-10 | 13F | WCG Wealth Advisors LLC | 16.343 | 976 | ||||||
| 2026-02-10 | 13F | Savant Capital, LLC | 0 | -100,00 | 0 | |||||
| 2026-02-23 | 13F | Kera Capital Partners, Inc. | 5.540 | 28,60 | 242 | -2,02 | ||||
| 2025-11-14 | 13F | Nomura Holdings Inc | 0 | -100,00 | 0 | -100,00 | ||||
| 2026-01-29 | 13F | Rakuten Securities, Inc. | 132 | -19,02 | 8 | -22,22 | ||||
| 2025-11-05 | 13F | Optimize Financial Inc | 0 | -100,00 | 0 | |||||
| 2026-02-09 | 13F | Keating Financial Advisory Services, Inc. | 34 | 2 | ||||||
| 2026-04-13 | 13F | St Germain D J Co Inc | 0 | -100,00 | 0 | |||||
| 2026-04-20 | 13F | Inscription Capital, LLC | 11.618 | 125,55 | 494 | 60,91 | ||||
| 2026-02-09 | 13F | Wiser Advisor Group LLC | 26 | 0,00 | 2 | 0,00 | ||||
| 2026-02-05 | 13F | Elyxium Wealth, LLC | 68 | 4 | ||||||
| 2026-01-29 | 13F | UBS Group AG | 1.847.713 | 0,80 | 110.345 | 4,69 | ||||
| 2025-11-07 | 13F | Gsa Capital Partners Llp | 0 | -100,00 | 0 | |||||
| 2026-01-14 | 13F | Spire Wealth Management | 165 | -70,48 | 10 | -71,87 | ||||
| 2026-02-13 | 13F | Next Century Growth Investors Llc | 116.666 | 6.967 | ||||||
| 2025-11-14 | 13F | Cubist Systematic Strategies, LLC | 0 | -100,00 | 0 | -100,00 | ||||
| 2026-02-12 | 13F | Wedbush Securities Inc | 15.605 | 5,59 | 1 | |||||
| 2025-11-19 | 13F | Caitong International Asset Management Co., Ltd | 0 | -100,00 | 0 | |||||
| 2026-01-21 | 13F | Yousif Capital Management, Llc | 28.249 | -2,14 | 1.442 | -13,14 | ||||
| 2026-04-10 | 13F | Quaker Wealth Management, LLC | 2 | 0 | ||||||
| 2026-02-09 | 13F | Huntington National Bank | 474 | 25,07 | 28 | 33,33 | ||||
| 2026-02-10 | 13F | Foundations Investment Advisors, LLC | 3.709 | 222 | ||||||
| 2026-02-13 | 13F | Resources Investment Advisors, LLC. | 3.669 | -2,50 | 219 | 1,39 | ||||
| 2026-02-12 | 13F | Castleark Management Llc | 133.167 | 3,14 | 7.953 | 7,11 | ||||
| 2026-02-13 | 13F | Walleye Trading LLC | 55.024 | 53,01 | 3.286 | 58,97 | ||||
| 2026-02-17 | 13F | Perbak Capital Partners LLP | 0 | -100,00 | 0 | |||||
| 2026-02-13 | 13F | Walleye Trading LLC | Put | 36.400 | 141,06 | 2.174 | 150,35 | |||
| 2025-11-14 | 13F | Caption Management, LLC | Call | 0 | -100,00 | 0 | -100,00 | |||
| 2026-02-13 | 13F | Walleye Trading LLC | Call | 26.700 | 352,54 | 1.595 | 370,21 | |||
| 2026-02-10 | 13F | Acadian Asset Management Llc | 333.521 | -5,18 | 20 | -5,00 | ||||
| 2026-02-12 | 13F | Voya Investment Management Llc | 7.111 | -10,44 | 425 | -7,02 | ||||
| 2026-02-12 | 13F | Elo Mutual Pension Insurance Co | 31.185 | 17,98 | 1.862 | 22,58 | ||||
| 2026-02-13 | 13F | Acumen Wealth Advisors, LLC | 104 | 6 | ||||||
| 2026-01-23 | 13F | Optima Capital Llc | 33 | 2 | ||||||
| 2026-04-15 | 13F | Curbstone Financial Management Corp | 35.904 | 0,00 | 1.528 | -28,73 | ||||
| 2026-04-15 | 13F | Bayforest Capital Ltd | 5.115 | 626,56 | 218 | 416,67 | ||||
| 2026-02-10 | 13F | Commonwealth Of Pennsylvania Public School Empls Retrmt Sys | 22.935 | -3,27 | 1.370 | 0,44 | ||||
| 2026-02-13 | 13F | Transamerica Financial Advisors, Inc. | 1.473 | 88 | ||||||
| 2026-02-17 | 13F | Public Employees Retirement System Of Ohio | 28.352 | -3,36 | 1.693 | 0,42 | ||||
| 2026-02-17 | 13F | Boothbay Fund Management, Llc | 29.742 | 1.776 | ||||||
| 2026-04-13 | 13F | Robinhood Asset Management, LLC | 0 | -100,00 | 0 | |||||
| 2026-01-22 | 13F | Massachusetts Financial Services Co /ma/ | 4.928.146 | -1,19 | 294.309 | 2,63 | ||||
| 2026-01-21 | 13F | Greenleaf Trust | 3.546 | 1,87 | 212 | 5,50 | ||||
| 2026-02-10 | 13F | Impact Partnership Wealth, LLC | 8.360 | 20,39 | 499 | 25,06 | ||||
| 2026-02-10 | 13F/A | Northwestern Mutual Wealth Management Co | 2.050 | -13,14 | 122 | -9,63 | ||||
| 2026-02-12 | 13F | BRYN MAWR TRUST Co | 0 | -100,00 | 0 | -100,00 | ||||
| 2026-02-17 | 13F | Citadel Advisors Llc | Put | 25.500 | -6,59 | 1.523 | -3,00 | |||
| 2026-02-17 | 13F | Citadel Advisors Llc | Call | 27.500 | 6,18 | 1.642 | 10,28 | |||
| 2026-02-13 | 13F | Panagora Asset Management Inc | 108.380 | 243,03 | 6.472 | 256,39 | ||||
| 2026-02-17 | 13F | Farringdon Capital, Ltd. | 3.390 | 202 | ||||||
| 2026-04-20 | 13F | Ronald Blue Trust, Inc. | 2.228 | 103,28 | 95 | 44,62 | ||||
| 2026-02-17 | 13F | Citadel Advisors Llc | 237.102 | 164,59 | 14.160 | 174,83 | ||||
| 2026-01-14 | 13F | Jfs Wealth Advisors, Llc | 75 | 70,45 | 4 | 100,00 | ||||
| 2025-11-14 | 13F | Polymer Capital Management (US) LLC | 0 | -100,00 | 0 | |||||
| 2026-02-17 | 13F | Oberweis Asset Management Inc/ | 424.840 | 9,10 | 25.371 | 13,31 | ||||
| 2026-02-03 | 13F | Bokf, Na | 9.212 | -14,82 | 550 | -11,43 | ||||
| 2026-02-13 | 13F | Victory Capital Management Inc | 103.833 | -38,95 | 6.201 | -36,61 | ||||
| 2026-01-30 | 13F | North Star Investment Management Corp. | 9 | 1 | ||||||
| 2025-11-14 | 13F | Wolverine Trading, Llc | Put | 9.100 | -39,74 | 533 | -33,79 | |||
| 2026-02-11 | 13F | Group One Trading, L.p. | Call | 3.700 | -63,37 | 221 | -62,07 | |||
| 2026-02-17 | 13F | Cetera Investment Advisers | 26.617 | -2,99 | 1.590 | 0,76 | ||||
| 2025-11-14 | 13F | Virtu Financial LLC | 0 | -100,00 | 0 | |||||
| 2026-02-11 | 13F | Group One Trading, L.p. | Put | 1.700 | -48,48 | 102 | -46,56 | |||
| 2026-04-16 | 13F | Robocap Asset Management Ltd | 0 | -100,00 | 0 | |||||
| 2026-01-30 | 13F | Turning Point Benefit Group, Inc. | 2 | 0,00 | 0 | |||||
| 2026-02-11 | 13F | Janney Montgomery Scott LLC | 34.609 | 19,76 | 2 | 100,00 | ||||
| 2026-02-13 | 13F | Rhumbline Advisers | 233.158 | -3,43 | 13.924 | 0,30 | ||||
| 2025-11-14 | 13F | Wolverine Trading, Llc | Call | 16.700 | -6,70 | 978 | 2,52 | |||
| 2026-02-10 | 13F | Marietta Investment Partners Llc | 85.799 | 5,66 | 5.124 | 9,72 | ||||
| 2026-02-12 | 13F | Xponance, Inc. | 12.234 | -7,88 | 731 | -4,33 | ||||
| 2025-10-24 | 13F | Meeder Asset Management Inc | 0 | -100,00 | 0 | |||||
| 2026-02-11 | 13F | Parallel Advisors, LLC | 3.688 | 5,04 | 220 | 9,45 | ||||
| 2026-02-09 | 13F | Smithfield Trust Co | 371 | -0,80 | 0 | |||||
| 2026-02-12 | 13F | Federation des caisses Desjardins du Quebec | 6.433 | 18,23 | 384 | 23,08 | ||||
| 2026-02-12 | 13F | Alps Advisors Inc | 7.918 | 0,87 | 473 | 4,66 | ||||
| 2026-02-13 | 13F | Integrated Wealth Concepts LLC | 12.702 | -34,44 | 759 | -31,96 | ||||
| 2025-11-14 | 13F | AXA Investment Managers S.A. | 1.630 | 94 | ||||||
| 2026-02-03 | 13F | Gallacher Capital Management LLC | 4.093 | -11,21 | 244 | -7,92 | ||||
| 2026-02-05 | 13F | New York Life Investment Management Llc | 8.027 | -3,81 | 479 | 0,00 | ||||
| 2026-02-17 | 13F | Clear Street Markets Llc | 0 | -100,00 | 0 | |||||
| 2026-01-21 | 13F | SJS Investment Consulting Inc. | 12 | 0,00 | 1 | |||||
| 2026-02-13 | 13F | Walleye Capital LLC | 29.820 | 905,39 | 1.781 | 947,06 | ||||
| 2026-02-13 | 13F | Walleye Capital LLC | Call | 7.000 | 75,00 | 418 | 81,74 | |||
| 2026-02-14 | 13F | Rockefeller Capital Management L.P. | 202.261 | 44.255,48 | 12.079 | 46.357,69 | ||||
| 2026-04-14 | 13F | Papp L Roy & Associates | 44.073 | -0,83 | 1.876 | -29,35 | ||||
| 2026-02-13 | 13F | Cornerstone Financial Management LLC | 10 | 1 | ||||||
| 2026-02-10 | 13F | Sivia Capital Partners, LLC | 5.167 | -2,66 | 309 | 0,98 | ||||
| 2026-02-13 | 13F | Walleye Capital LLC | Put | 15.300 | 17,69 | 914 | 22,22 | |||
| 2026-04-13 | 13F | Mather Group, Llc. | 590 | 25 | ||||||
| 2026-02-05 | 13F | Stephens Inc /ar/ | 3.744 | -15,43 | 224 | -12,20 | ||||
| 2026-01-29 | 13F | UMA Financial Services, Inc. | 38 | -5,00 | 2 | 0,00 | ||||
| 2026-01-27 | 13F | Forum Financial Management, LP | 3.968 | -8,02 | 237 | -4,84 | ||||
| 2026-02-10 | 13F | Smith Group Asset Management, LLC | 28.617 | 31,21 | 1.709 | 36,28 | ||||
| 2026-02-12 | 13F | BlackRock, Inc. | 8.977.984 | -0,56 | 536.165 | 3,27 | ||||
| 2026-02-17 | 13F | Two Sigma Investments, Lp | 45.840 | -3,58 | 2.738 | 0,15 | ||||
| 2026-02-10 | 13F | Mutual Of America Capital Management Llc | 38.143 | -10,60 | 2.278 | -7,17 | ||||
| 2026-02-06 | 13F | Summit Creek Advisors LLC | 291.042 | -3,97 | 17.381 | -0,26 | ||||
| 2026-02-17 | 13F | Cape Investment Advisory, Inc. | 57 | 0,00 | 3 | 0,00 | ||||
| 2025-11-14 | 13F | Maverick Capital Ltd | 0 | -100,00 | 0 | |||||
| 2026-02-17 | 13F | Creative Planning | 29.803 | 6,50 | 1.780 | 10,57 | ||||
| 2026-03-12 | 13F/A | Peak6 Llc | Call | 108.700 | 6.492 | |||||
| 2026-03-12 | 13F/A | Peak6 Llc | Put | 45.600 | 2.723 | |||||
| 2026-02-06 | 13F | HighTower Advisors, LLC | 7.263 | 15,01 | 434 | 19,28 | ||||
| 2026-02-17 | 13F | Capital Fund Management S.a. | Call | 15.400 | -40,08 | 920 | -37,78 | |||
| 2026-02-10 | 13F | Main Management ETF Advisors, LLC | 19.575 | 1,03 | 1 | 0,00 | ||||
| 2026-02-13 | 13F | Herald Investment Management Ltd | 703.600 | 0,00 | 41.998 | 3,85 | ||||
| 2026-02-17 | 13F | SageView Advisory Group, LLC | 35 | 2 | ||||||
| 2026-02-13 | 13F | Motiv8 Investments LLC | 63 | 0 | ||||||
| 2026-02-13 | 13F | Lord, Abbett & Co. Llc | 185.119 | 11 | ||||||
| 2026-02-06 | 13F | Princeton Capital Management Llc | 8.000 | 0,00 | 478 | 3,70 | ||||
| 2026-04-14 | 13F | USA Financial Portformulas Corp | 9 | 0,00 | 0 | |||||
| 2026-02-12 | 13F | Quadrant Capital Group Llc | 860 | 23,56 | 51 | 27,50 | ||||
| 2026-02-13 | 13F | Rafferty Asset Management, LLC | 0 | -100,00 | 0 | |||||
| 2026-02-11 | 13F | Strategic Advocates LLC | 293 | 18 | ||||||
| 2026-02-13 | 13F | Van Eck Associates Corp | 71.792 | 4 | ||||||
| 2025-11-13 | 13F | Shannon River Fund Management LLC | Put | 0 | -100,00 | 0 | -100,00 | |||
| 2026-02-13 | 13F | Treasurer of the State of North Carolina | 167.081 | 327,42 | 10 | 350,00 | ||||
| 2026-04-17 | 13F | Bell Investment Advisors, Inc | 245 | 45,83 | 10 | 0,00 | ||||
| 2026-02-13 | 13F | Colony Group, LLC | 13.861 | -12,48 | 828 | -9,12 | ||||
| 2026-02-05 | 13F | Convergence Investment Partners, LLC | 55.505 | 17,72 | 3.315 | 22,24 | ||||
| 2026-02-11 | 13F | Vestcor Inc | 31.877 | 12,94 | 2 | 0,00 | ||||
| 2026-04-10 | 13F | First Bank & Trust | 0 | -100,00 | 0 | |||||
| 2026-01-27 | 13F | Optas, LLC | 3.886 | -6,14 | 232 | -2,52 | ||||
| 2026-02-17 | 13F | Susquehanna International Group, Llp | Call | 76.300 | 86,55 | 4.557 | 93,79 | |||
| 2026-02-11 | 13F | Fiera Capital Corp | 1.113.171 | 32,69 | 66.479 | 37,81 | ||||
| 2026-02-17 | 13F | Susquehanna International Group, Llp | 36.370 | 66,89 | 2.172 | 73,34 | ||||
| 2026-02-17 | 13F | Susquehanna International Group, Llp | Put | 28.900 | -12,42 | 1.726 | -9,07 | |||
| 2026-04-09 | 13F | Park Place Capital Corp | 22 | 0,00 | 1 | -100,00 | ||||
| 2026-01-28 | 13F | HB Wealth Management, LLC | 0 | -100,00 | 0 | |||||
| 2026-04-06 | 13F | Highline Wealth Partners Llc | 163 | 7 | ||||||
| 2026-02-12 | 13F | MetLife Investment Management, LLC | 46.095 | -5,46 | 2.753 | -1,82 | ||||
| 2026-01-23 | 13F | Private Wealth Management Group, LLC | 72 | -2,70 | 4 | 0,00 | ||||
| 2026-02-10 | 13F | Principia Wealth Advisory, LLC | 1 | 0 | ||||||
| 2026-01-20 | 13F | JB Capital LLC | 61.852 | 9,74 | 3.694 | 13,98 | ||||
| 2026-02-17 | 13F | Altshuler Shaham Ltd | 75 | -3,85 | 4 | 0,00 | ||||
| 2026-02-05 | 13F | Allworth Financial LP | 1.607 | -5,97 | 96 | -3,06 | ||||
| 2026-02-13 | 13F | Icon Advisers Inc/co | 41.493 | 0,00 | 2.478 | 3,86 | ||||
| 2026-02-11 | 13F | Winton Capital Group Ltd | 15.450 | 923 | ||||||
| 2026-02-12 | 13F | Commonwealth Equity Services, Llc | 11.203 | 45,64 | 669 | |||||
| 2025-11-14 | 13F | Weiss Asset Management LP | 48.990 | 129,47 | 2.817 | 80,51 | ||||
| 2026-02-10 | 13F | CIBC Asset Management Inc | 5.286 | 0,00 | 316 | 3,96 | ||||
| 2026-04-09 | 13F | Veracity Capital LLC | 0 | -100,00 | 0 | |||||
| 2026-01-29 | 13F | Teachers Retirement System Of The State Of Kentucky | 27.800 | 0,00 | 2 | 0,00 | ||||
| 2026-02-10 | 13F | Daiwa Securities Group Inc. | 3.142 | -71,22 | 0 | |||||
| 2026-02-11 | 13F | Illinois Municipal Retirement Fund | 73.504 | -7,68 | 4.390 | -4,13 | ||||
| 2026-02-17 | 13F | Tudor Investment Corp Et Al | Call | 3.400 | -2,86 | 203 | 1,00 | |||
| 2026-04-06 | 13F | Versant Capital Management, Inc | 3.182 | 50,45 | 135 | 7,14 | ||||
| 2026-02-04 | 13F | Virginia Retirement Systems Et Al | 42.750 | -6,25 | 2.553 | -2,63 | ||||
| 2026-02-13 | 13F | Greenline Wealth Management LLC | 317 | 19 | ||||||
| 2026-02-13 | 13F | BNP Paribas Asset Management Holding S.A. | 1.388 | 36,35 | 0 | |||||
| 2026-02-12 | 13F | Callan Family Office, LLC | 6.413 | 15,32 | 383 | 19,75 | ||||
| 2026-02-12 | 13F | Brown Brothers Harriman & Co | 710 | 386,30 | 42 | 425,00 | ||||
| 2026-01-12 | 13F | Salem Investment Counselors Inc | 0 | -100,00 | 0 | |||||
| 2025-11-14 | 13F | Mount Yale Investment Advisors, LLC | 0 | -100,00 | 0 | -100,00 | ||||
| 2026-04-20 | 13F | CWA Asset Management Group, LLC | 0 | -100,00 | 0 | |||||
| 2026-02-11 | 13F | Empowered Funds, LLC | 34.716 | 4,51 | 2.072 | 8,60 | ||||
| 2026-01-21 | 13F | Raleigh Capital Management Inc. | 1.628 | 2,20 | 97 | 6,59 | ||||
| 2026-04-16 | 13F | SG Americas Securities, LLC | 16.763 | -21,53 | 1 | -100,00 | ||||
| 2026-02-18 | 13F | EP Wealth Advisors, Inc. | 0 | -100,00 | 0 | |||||
| 2025-11-14 | 13F | Binnacle Investments Inc | 12 | 0,00 | 1 | |||||
| 2026-04-10 | 13F/A | OP Asset Management Ltd | 111.305 | 187,37 | 4.737 | 112,71 | ||||
| 2026-02-05 | 13F | Bessemer Group Inc | 874 | 133,69 | 0 | |||||
| 2026-02-17 | 13F | Gotham Asset Management, LLC | 566.469 | 2,71 | 33.830 | 6,67 | ||||
| 2026-01-28 | 13F | Klp Kapitalforvaltning As | 27.900 | 2,57 | 1.666 | 6,52 | ||||
| 2026-02-06 | 13F | Cullen/frost Bankers, Inc. | 211 | 113,13 | 13 | 140,00 | ||||
| 2026-02-13 | 13F | Pinnacle Wealth Planning Services, Inc. | 16 | 1 | ||||||
| 2026-01-26 | 13F | Cwm, Llc | 164.150 | -3,87 | 10 | 0,00 | ||||
| 2026-02-11 | 13F | Cookson Peirce & Co Inc | 230.391 | 10,09 | 13.759 | 14,35 | ||||
| 2026-02-03 | 13F | Farmers & Merchants Investments Inc | 78 | 5,41 | 5 | 0,00 | ||||
| 2026-04-15 | 13F | Occidental Asset Management, LLC | 0 | -100,00 | 0 | |||||
| 2026-02-10 | 13F | Nomura Asset Management Co Ltd | 0 | 0 | ||||||
| 2026-02-12 | 13F | Aviva Plc | 18.892 | 22,39 | 1.128 | 27,17 | ||||
| 2025-11-10 | 13F | Optiver Holding B.V. | 0 | -100,00 | 0 | |||||
| 2026-02-17 | 13F | Tower Research Capital LLC (TRC) | 4.017 | -22,35 | 240 | -19,53 | ||||
| 2026-02-10 | 13F | Connor, Clark & Lunn Investment Management Ltd. | 237.037 | -28,92 | 14.156 | -26,18 | ||||
| 2026-02-11 | 13F | Los Angeles Capital Management Llc | 411.262 | 259,66 | 26.144 | 297,67 | ||||
| 2026-04-14 | 13F | Nbc Securities, Inc. | 2.917 | 44,12 | 124 | 3,33 | ||||
| 2026-02-05 | 13F | Amalgamated Bank | 41.718 | -2,37 | 2 | 0,00 | ||||
| 2026-02-13 | 13F | Verition Fund Management LLC | 58.783 | -9,49 | 3.511 | -6,00 | ||||
| 2026-02-17 | 13F | Advisor Group Holdings, Inc. | 19.254 | 35,80 | 1.150 | 47,31 | ||||
| 2026-02-09 | 13F | Geode Capital Management, Llc | 2.344.266 | 26,61 | 140.020 | 31,50 | ||||
| 2026-02-13 | 13F | Battery Global Advisors, LLC | 40 | 2 | ||||||
| 2025-11-14 | 13F | Fred Alger Management, Llc | 0 | -100,00 | 0 | |||||
| 2025-11-10 | 13F | Jupiter Asset Management Ltd | 0 | -100,00 | 0 | |||||
| 2026-01-29 | 13F | State Of Michigan Retirement System | 21.700 | -1,36 | 1.296 | 2,37 | ||||
| 2026-02-05 | 13F | Td Private Client Wealth Llc | 20 | 1 | ||||||
| 2025-11-13 | 13F | Renaissance Technologies Llc | 0 | -100,00 | 0 | -100,00 | ||||
| 2026-01-29 | 13F | Beirne Wealth Consulting Services, LLC | 0 | -100,00 | 0 | |||||
| 2026-02-04 | 13F | Swiss Life Asset Management Ltd | 7.902 | 84,89 | 472 | 92,24 | ||||
| 2026-02-04 | 13F | Plato Investment Management Ltd | 867 | 52 | ||||||
| 2026-02-17 | 13F | Vinva Investment Management Ltd | 4.048 | 8,41 | 370 | 11,45 | ||||
| 2026-01-26 | 13F | Whittier Trust Co Of Nevada Inc | 54 | 0,00 | 3 | 50,00 | ||||
| 2026-02-13 | 13F | Prudential Financial Inc | 5.069 | -32,12 | 303 | -29,60 | ||||
| 2026-02-13 | 13F | Police & Firemen's Retirement System of New Jersey | 36.404 | -5,93 | 2.174 | -2,29 | ||||
| 2026-04-15 | 13F | Monument Capital Management | 0 | -100,00 | 0 | |||||
| 2026-02-17 | 13F | Wiley Bros.-aintree Capital, Llc | 20.042 | -3,62 | 1.197 | 0,17 | ||||
| 2025-11-10 | 13F | Empirical Financial Services, LLC d.b.a. Empirical Wealth Management | 0 | -100,00 | 0 | |||||
| 2026-04-13 | 13F | IFP Advisors, Inc | 4.000 | -24,90 | 170 | -46,54 | ||||
| 2025-10-23 | 13F | Lecap Asset Management Ltd | 0 | -100,00 | 0 | |||||
| 2025-11-14 | 13F | Susquehanna Fundamental Investments, Llc | 0 | -100,00 | 0 | -100,00 | ||||
| 2026-02-12 | 13F | Principal Securities, Inc. | 0 | -100,00 | 0 | -100,00 | ||||
| 2026-02-17 | 13F | Wellington Management Group Llp | 2.721.958 | 28,26 | 162.555 | 33,22 | ||||
| 2026-01-27 | 13F | Brighton Jones Llc | 0 | -100,00 | 0 | |||||
| 2026-02-13 | 13F | Jacobs Levy Equity Management, Inc | 1.524.348 | -34,26 | 91.034 | -31,72 | ||||
| 2026-04-13 | 13F | Massmutual Trust Co Fsb/adv | 214 | 723,08 | 9 | 800,00 | ||||
| 2026-02-12 | 13F | Colonial Trust Co / SC | 108 | 0,00 | 6 | 0,00 | ||||
| 2025-11-06 | 13F | Abich Financial Wealth Management LLC | 807 | 2.023,68 | 46 | 2.200,00 | ||||
| 2026-02-05 | 13F | Atria Investments Llc | 16.557 | 95,92 | 989 | 103,71 | ||||
| 2026-02-02 | 13F | Fifth Third Bancorp | 617 | 96,50 | 37 | 100,00 | ||||
| 2026-02-12 | 13F | EAM Investors, LLC | 0 | -100,00 | 0 | |||||
| 2026-02-12 | 13F | Ci Investments Inc. | 0 | -100,00 | 0 | |||||
| 2026-02-09 | 13F | Fisher Asset Management, LLC | 1.170.377 | 2,96 | 69.895 | 6,93 | ||||
| 2026-02-12 | 13F | JPL Wealth Management, LLC | 0 | -100,00 | 0 | |||||
| 2026-04-14 | 13F | Zrc Wealth Management, Llc | 49 | 2 | ||||||
| 2026-04-16 | 13F | Diversified Trust Co | 11.364 | 3,18 | 484 | -26,48 | ||||
| 2025-11-14 | 13F | Prelude Capital Management, Llc | 0 | -100,00 | 0 | |||||
| 2026-02-03 | 13F | Wilson Asset Management (international) Pty Ltd | 65.000 | 225,00 | 3.882 | 237,48 | ||||
| 2026-01-27 | 13F | Zurcher Kantonalbank (Zurich Cantonalbank) | 32.824 | -1,14 | 1.960 | 2,67 | ||||
| 2026-02-13 | 13F | Kestra Advisory Services, LLC | 4.590 | 274 | ||||||
| 2026-02-17 | 13F | Delaware Management Holdings, Inc. | 121.197 | 7.238 | ||||||
| 2026-02-17 | 13F | Ameriprise Financial Inc | 480.824 | 134,79 | 28.713 | 143,85 | ||||
| 2026-02-13 | 13F | Baird Financial Group, Inc. | 4.555 | 5,51 | 272 | 9,68 | ||||
| 2025-11-12 | 13F | CIBC Bancorp USA Inc. | 4.186 | 241 | ||||||
| 2026-04-17 | 13F | AdvisorNet Financial, Inc | 8 | 0,00 | 0 | |||||
| 2025-11-13 | 13F | Twin Tree Management, LP | 0 | -100,00 | 0 | -100,00 | ||||
| 2026-02-12 | 13F | Groupe la Francaise | 0 | -100,00 | 0 | |||||
| 2026-02-06 | 13F | Covestor Ltd | 488 | -78,35 | 0 | |||||
| 2026-02-10 | 13F | Bank of New York Mellon Corp | 828.839 | -2,46 | 49.498 | 1,31 | ||||
| 2026-01-15 | 13F | Retirement Systems of Alabama | 109.996 | -1,52 | 6.569 | 2,27 | ||||
| 2026-04-08 | 13F | Wealth Enhancement Trust Services, Inc. | 0 | -100,00 | 0 | |||||
| 2026-02-17 | 13F | Voleon Capital Management Lp | 18.154 | 1.084 | ||||||
| 2026-02-17 | 13F | Armistice Capital, Llc | 131.994 | 52,02 | 7.883 | 57,89 | ||||
| 2026-02-02 | 13F | Kornitzer Capital Management Inc /ks | 95.185 | 0,00 | 5.684 | 3,86 | ||||
| 2026-01-23 | 13F | Rsm Us Wealth Management Llc | 4.097 | -10,13 | 251 | -4,20 | ||||
| 2025-11-14 | 13F | Point72 Asia (Singapore) Pte. Ltd. | 0 | -100,00 | 0 | -100,00 | ||||
| 2026-02-12 | 13F | Swiss National Bank | 185.500 | 1,64 | 11.078 | 5,58 | ||||
| 2025-11-14 | 13F | Scientech Research LLC | 0 | -100,00 | 0 | |||||
| 2026-02-06 | 13F | Legato Capital Management LLC | 31.185 | 144,59 | 1.862 | 154,02 | ||||
| 2025-11-06 | 13F | Versor Investments LP | 0 | -100,00 | 0 | |||||
| 2025-11-13 | 13F | Twin Tree Management, LP | Put | 0 | -100,00 | 0 | -100,00 | |||
| 2025-11-14 | 13F | ExodusPoint Capital Management, LP | 0 | -100,00 | 0 | |||||
| 2026-02-09 | 13F | Kestra Investment Management, LLC | 71.815 | 7,73 | 4.289 | 11,90 | ||||
| 2026-02-12 | 13F | New York State Common Retirement Fund | 273.321 | 6,13 | 16.323 | 10,22 | ||||
| 2026-02-12 | 13F | Penserra Capital Management LLC | 3.576 | 0 | ||||||
| 2026-02-17 | 13F | Price T Rowe Associates Inc /md/ | 882.800 | 88,64 | 53 | 100,00 | ||||
| 2026-01-29 | 13F | Calamos Wealth Management LLC | 3.706 | -30,26 | 221 | -27,54 | ||||
| 2026-01-27 | 13F | Asset Management One Co., Ltd. | 1.366 | -34,73 | 85 | -30,00 | ||||
| 2026-02-04 | 13F | Ameritas Advisory Services, LLC | 0 | -100,00 | 0 | |||||
| 2026-04-16 | 13F | Capital Advisors, Ltd. LLC | 145 | 8,21 | 0 | |||||
| 2026-02-17 | 13F | Millennium Management Llc | Put | 0 | -100,00 | 0 | ||||
| 2025-10-20 | 13F | Hennessy Advisors Inc | 0 | -100,00 | 0 | |||||
| 2026-02-10 | 13F | Advisor Resource Council | 5.785 | 252 | ||||||
| 2026-02-17 | 13F | EFG International AG | 530 | 32 | ||||||
| 2026-04-14 | 13F | Perpetual Ltd | 11.186 | -6,06 | 476 | -33,05 | ||||
| 2026-01-29 | 13F | Calamos Advisors LLC | 50.829 | 24,19 | 3.036 | 28,98 | ||||
| 2026-02-11 | 13F | Capital Research Global Investors | 1.796.189 | -28,65 | 107.268 | -25,90 | ||||
| 2026-02-13 | 13F | Mariner, LLC | 0 | -100,00 | 0 | |||||
| 2026-04-17 | 13F | Kaufman Rossin Wealth, LLC | 0 | -100,00 | 0 | |||||
| 2025-11-14 | 13F | Texas Permanent School Fund | 0 | -100,00 | 0 | |||||
| 2026-02-03 | 13F | Harel Insurance Investments & Financial Services Ltd. | 86.586 | -26,84 | 5 | -16,67 | ||||
| 2026-02-18 | 13F | GWM Advisors LLC | 19.392 | 42,05 | 1.158 | 47,52 | ||||
| 2026-01-28 | 13F | waypoint wealth counsel | 3.385 | -3,23 | 202 | 0,50 | ||||
| 2026-02-06 | 13F | ProShare Advisors LLC | 3.675 | -6,49 | 219 | -2,67 | ||||
| 2026-02-09 | 13F | Investors Portfolio Services LLC | 49 | 3 | ||||||
| 2026-02-13 | 13F | Truvestments Capital Llc | 3.654 | 159,89 | 218 | 172,50 | ||||
| 2026-04-13 | 13F | Creative Financial Designs Inc /adv | 60 | 42,86 | 3 | 0,00 | ||||
| 2026-01-14 | 13F | ORG Partners LLC | 70 | 0,00 | 4 | 0,00 | ||||
| 2026-02-03 | 13F | NewEdge Wealth, LLC | 25.672 | 15,02 | 1.533 | 15,26 | ||||
| 2026-02-17 | 13F | Buckland Partners Management Co LLC | 19.000 | 1.135 | ||||||
| 2026-02-03 | 13F | International Assets Investment Management, Llc | 462 | 28 | ||||||
| 2025-11-12 | 13F | Neo Ivy Capital Management | 0 | -100,00 | 0 | -100,00 | ||||
| 2026-04-09 | 13F | PFS Partners, LLC | 193 | -51,75 | 8 | -65,22 | ||||
| 2026-02-11 | 13F | MCF Advisors LLC | 120 | 7 | ||||||
| 2026-02-10 | 13F | Eurizon Capital SGR S.p.A. | 2.292 | 137 | ||||||
| 2026-02-11 | 13F | Group One Trading, L.p. | 0 | -100,00 | 0 | -100,00 | ||||
| 2026-02-13 | 13F | Kennedy Capital Management, Inc. | 67.988 | -0,39 | 4.060 | 3,47 | ||||
| 2026-02-13 | 13F | MAI Capital Management | 1.100 | 58,05 | 66 | 62,50 | ||||
| 2026-02-19 | 13F | Invesco Ltd. | 3.127.771 | 14,78 | 186.790 | 19,21 | ||||
| 2026-01-29 | 13F | Dunhill Financial, LLC | 2 | 0 | ||||||
| 2026-02-13 | 13F | Sterling Capital Management LLC | 3.644 | 0,19 | 218 | 3,83 | ||||
| 2026-02-13 | 13F | JustInvest LLC | 22.501 | -1,73 | 1.344 | 2,05 | ||||
| 2026-02-13 | 13F | Virtus ETF Advisers LLC | 9.406 | 0,00 | 562 | 3,89 | ||||
| 2026-02-17 | 13F | Jones Financial Companies Lllp | 3.986 | 50,13 | 238 | 53,55 | ||||
| 2026-02-06 | 13F | Tortoise Investment Management, LLC | 0 | -100,00 | 0 | |||||
| 2026-01-08 | 13F | Chesapeake Asset Management Llc | 266 | 16 | ||||||
| 2026-02-13 | 13F | Mml Investors Services, Llc | 11.632 | 7,10 | 695 | 11,22 | ||||
| 2026-02-17 | 13F | Lazard Asset Management Llc | 269.744 | 0,79 | 16.109 | 4,68 | ||||
| 2026-02-12 | 13F | Ensign Peak Advisors, Inc | 25.142 | -38,52 | 1.501 | -36,15 | ||||
| 2026-02-12 | 13F | Bank of Jackson Hole Trust | 104 | 6 | ||||||
| 2026-02-13 | 13F | State Street Corp | 2.753.627 | -0,59 | 164.447 | 3,24 | ||||
| 2026-02-10 | 13F | Root Financial Partners, LLC | 395 | 13,18 | 24 | 15,00 | ||||
| 2026-04-14 | 13F | Bay Harbor Wealth Management, LLC | 21 | 133,33 | 1 | |||||
| 2026-02-17 | 13F | Westwood Holdings Group Inc | 357.995 | -1,99 | 21.379 | 1,79 | ||||
| 2026-02-12 | 13F | Marex Group plc | 3.933 | 235 | ||||||
| 2026-02-17 | 13F | Mercer Global Advisors Inc /adv | 24.775 | -12,64 | 1.480 | -9,26 | ||||
| 2026-01-26 | 13F | Greenwood Capital Associates Llc | 12.619 | -7,49 | 754 | -3,95 | ||||
| 2026-02-17 | 13F | Fmr Llc | 143.608 | -81,71 | 8.576 | -81,00 | ||||
| 2026-02-17 | 13F | Snowden Capital Advisors LLC | 8.446 | -7,16 | 504 | -3,63 | ||||
| 2026-02-18 | 13F | Mackenzie Financial Corp | 197.542 | 13,28 | 12.089 | 20,56 | ||||
| 2026-01-29 | 13F | Sanctuary Advisors, LLC | 8.194 | 35,82 | 489 | 41,33 | ||||
| 2026-01-30 | 13F | Us Bancorp \de\ | 8.228 | -1,87 | 491 | 1,87 | ||||
| 2026-02-13 | 13F | Umb Bank N A/mo | 1.105 | 18,95 | 66 | 22,64 | ||||
| 2026-02-17 | 13F | Signature Equity Partners, LLC | 231 | 14 | ||||||
| 2025-11-13 | 13F | Meiji Yasuda Asset Management Co Ltd. | 0 | -100,00 | 0 | -100,00 | ||||
| 2026-01-29 | 13F | Vanguard Group Inc | 10.959.704 | -2,77 | 654.514 | 0,98 | ||||
| 2026-02-17 | 13F | Private Advisor Group, LLC | 10.863 | -20,49 | 649 | -17,45 | ||||
| 2026-02-13 | 13F | Macquarie Group Ltd | 0 | -100,00 | 0 | |||||
| 2026-04-17 | 13F | Vermillion Wealth Management, Inc. | 12 | 1 | ||||||
| 2026-02-11 | 13F | CSM Advisors, LLC | 80.028 | 5,26 | 5 | 0,00 | ||||
| 2026-02-12 | 13F | denkapparat Operations GmbH | 4.060 | 0,00 | 242 | 3,86 | ||||
| 2026-02-02 | 13F | Horizon Investments, LLC | 3.092 | 185 | ||||||
| 2026-01-30 | 13F | New York State Teachers Retirement System | 43.001 | -3,05 | 3 | 0,00 | ||||
| 2026-02-17 | 13F | Schonfeld Strategic Advisors LLC | 0 | -100,00 | 0 | |||||
| 2026-02-17 | 13F | G2 Investment Partners Management LLC | 125.594 | 7.500 | ||||||
| 2026-02-17 | 13F | Graham Capital Management, L.P. | 11.365 | 679 | ||||||
| 2025-11-13 | 13F | Diametric Capital, LP | 0 | -100,00 | 0 | |||||
| 2026-02-11 | 13F | Jpmorgan Chase & Co | 682.137 | 9,90 | 40.737 | 14,14 | ||||
| 2026-02-11 | 13F | Jpmorgan Chase & Co | Call | 100 | 6 | |||||
| 2026-02-18 | 13F | State of Tennessee, Treasury Department | 22.012 | -4,10 | 962 | -27,14 | ||||
| 2026-02-12 | 13F | Cloud Capital Management, LLC | 0 | -100,00 | 0 | |||||
| 2026-02-17 | 13F | Northern Trust Corp | 1.024.182 | -3,14 | 61.164 | 0,60 | ||||
| 2026-02-12 | 13F | State Board Of Administration Of Florida Retirement System | 78.852 | -3,24 | 4.709 | 0,51 | ||||
| 2026-02-06 | 13F | Handelsbanken Fonder AB | 25.088 | -37,88 | 1 | -50,00 | ||||
| 2026-02-05 | 13F | Requisite Capital Management, LLC | 0 | -100,00 | 0 | |||||
| 2026-02-10 | 13F | Globeflex Capital L P | 4.900 | 0,00 | 293 | 3,91 | ||||
| 2026-04-20 | 13F | Assenagon Asset Management S.A. | 82.655 | 53,93 | 3.518 | 9,70 | ||||
| 2026-02-13 | 13F | Wells Fargo & Company/mn | 192.916 | -10,24 | 11.521 | -6,78 | ||||
| 2026-02-17 | 13F | CWM Advisors, LLC | 0 | 0 | ||||||
| 2026-02-11 | 13F | Ameritas Investment Partners, Inc. | 16.797 | 1.003 | ||||||
| 2025-11-14 | 13F | Algert Global Llc | 0 | -100,00 | 0 | |||||
| 2026-02-05 | 13F | Cambridge Investment Research Advisors, Inc. | 4.924 | -9,10 | 0 | |||||
| 2026-02-13 | 13F | Great West Life Assurance Co /can/ | 309.219 | -7,46 | 18 | -5,26 | ||||
| 2026-01-13 | 13F | Dakota Wealth Management | 5.295 | 316 | ||||||
| 2026-02-13 | 13F | SRS Capital Advisors, Inc. | 4.384 | -96,52 | 262 | -96,40 | ||||
| 2025-10-22 | 13F | Geneos Wealth Management Inc. | 0 | -100,00 | 0 | -100,00 | ||||
| 2026-02-13 | 13F | Squarepoint Ops LLC | 55.705 | 3.327 | ||||||
| 2026-01-15 | 13F | Frank, Rimerman Advisors LLC | 5.043 | 0,38 | 301 | 4,51 | ||||
| 2026-01-29 | 13F | Quent Capital, LLC | 25.079 | 2.892,72 | 1.498 | 3.018,75 | ||||
| 2026-01-14 | 13F | Pallas Capital Advisors LLC | 26.746 | -2,19 | 1.597 | 1,59 | ||||
| 2026-01-23 | 13F | Retirement Guys Formula Llc | 3.692 | 0,11 | 220 | 3,77 | ||||
| 2026-02-12 | 13F | Jane Street Group, Llc | Call | 17.600 | -10,20 | 1.051 | -6,74 | |||
| 2026-01-21 | 13F | Newbridge Financial Services Group, Inc. | 18.845 | -2,55 | 1.125 | 1,26 | ||||
| 2026-02-02 | 13F | Principal Financial Group Inc | 196.948 | -3,89 | 11.762 | -0,19 | ||||
| 2026-02-12 | 13F | Jane Street Group, Llc | 4.417 | 26,20 | 264 | 30,85 | ||||
| 2026-02-10 | 13F | State of Wyoming | 12.286 | 33,34 | 734 | 38,56 | ||||
| 2026-02-12 | 13F | Jane Street Group, Llc | Put | 5.500 | -78,52 | 328 | -77,72 | |||
| 2026-01-15 | 13F | Nisa Investment Advisors, Llc | 80 | 25,00 | 5 | 33,33 | ||||
| 2026-02-11 | 13F | Harvest Fund Management Co., Ltd | 6.446 | 4.896,90 | 0 | |||||
| 2026-04-14 | 13F | Thurston, Springer, Miller, Herd & Titak, Inc. | 10 | 0,00 | 0 | |||||
| 2026-02-10 | 13F | Norges Bank | 534.244 | 31.905 | ||||||
| 2026-02-17 | 13F | Odyssean, LLC | 12.175 | 727 | ||||||
| 2026-01-30 | 13F/A | M&t Bank Corp | 9.031 | 56,60 | 540 | 62,84 | ||||
| 2026-04-10 | 13F | Lifestyle Asset Management, Inc. | 34.806 | 28,74 | 1.481 | -8,24 | ||||
| 2025-11-13 | 13F | Riggs Asset Managment Co. Inc. | 0 | -100,00 | 0 | |||||
| 2026-02-12 | 13F | Intrinsic Edge Capital Management LLC | 180.000 | -5,39 | 10.750 | -1,75 | ||||
| 2026-02-17 | 13F | Maryland State Retirement & Pension System | 4.226 | 0,00 | 252 | 4,13 | ||||
| 2025-11-04 | 13F | IMC-Chicago, LLC | Put | 0 | -100,00 | 0 | -100,00 | |||
| 2026-02-05 | 13F | Thrivent Financial For Lutherans | 1.713.825 | -11,09 | 102 | -7,27 | ||||
| 2026-01-28 | 13F | Salomon & Ludwin, LLC | 18 | 0,00 | 1 | |||||
| 2026-01-20 | 13F | Toth Financial Advisory Corp | 0 | -100,00 | 0 | |||||
| 2026-01-16 | 13F | Marquette Asset Management, LLC | 0 | -100,00 | 0 | |||||
| 2026-02-17 | 13F | Two Sigma Advisers, Lp | 20.500 | 7,89 | 1.224 | 12,09 | ||||
| 2026-02-10 | 13F | Hazlett, Burt & Watson, Inc. | 490 | 0,00 | 0 | |||||
| 2025-10-29 | 13F | AMH Equity Ltd | 0 | -100,00 | 0 | |||||
| 2026-04-15 | 13F | Fortitude Family Office, LLC | 30 | 36,36 | 1 | 0,00 | ||||
| 2026-02-17 | 13F | Brevan Howard Capital Management LP | 18.765 | -48,37 | 1.121 | -46,39 | ||||
| 2026-02-13 | 13F | Ranger Investment Management, L.P. | 910.976 | -6,61 | 54.403 | -3,01 | ||||
| 2026-02-13 | 13F | Stifel Financial Corp | 44.134 | -14,92 | 2.636 | -11,64 | ||||
| 2026-02-02 | 13F | Truist Financial Corp | 7.649 | -25,75 | 457 | -22,97 | ||||
| 2026-02-17 | 13F | Hancock Whitney Corp | 18.966 | 1,11 | 1.133 | 5,01 | ||||
| 2026-02-11 | 13F | SOUTH STATE Corp | 0 | -100,00 | 0 | |||||
| 2026-04-20 | 13F | Louisiana State Employees Retirement System | 26.500 | 4,33 | 1.128 | -25,66 | ||||
| 2026-02-05 | 13F | Northwestern Mutual Investment Management Company, Llc | 20.506 | -0,41 | 1.225 | 3,47 | ||||
| 2026-02-10 | 13F | Cherry Tree Wealth Management, LLC | 0 | -100,00 | 0 | |||||
| 2026-02-17 | 13F | Crawford Investment Counsel Inc | 0 | -100,00 | 0 | |||||
| 2026-01-28 | 13F | Teacher Retirement System Of Texas | 1.400.086 | -7,89 | 83.613 | -4,33 | ||||
| 2026-02-17 | 13F | Captrust Financial Advisors | 22.698 | -5,07 | 1.356 | -1,38 | ||||
| 2025-12-16 | 13F | Lindenwold Advisors | 5.359 | 1,00 | 308 | 7,32 | ||||
| 2026-02-17 | 13F | Royal Bank Of Canada | 311.541 | 41,34 | 18.606 | 46,80 | ||||
| 2026-02-11 | 13F | Simplex Trading, Llc | 0 | -100,00 | 0 | |||||
| 2026-02-11 | 13F | Franklin Resources Inc | 1.326.926 | 21,23 | 79.244 | 25,91 | ||||
| 2025-11-14 | 13F | Centiva Capital, LP | 0 | -100,00 | 0 | |||||
| 2026-01-28 | 13F | Arizona State Retirement System | 26.084 | -6,32 | 1.558 | -2,75 | ||||
| 2026-03-26 | 13F/A | Peak6 Llc | 0 | -100,00 | 0 | -100,00 | ||||
| 2026-02-17 | 13F | Susquehanna Portfolio Strategies, LLC | 159.482 | 0,00 | 9.524 | 3,86 | ||||
| 2026-02-17 | 13F | Millennium Management Llc | 248.250 | -11,18 | 14.825 | -7,75 | ||||
| 2026-01-26 | 13F | Asset Dedication, LLC | 10 | 0,00 | 1 | |||||
| 2026-02-17 | 13F | Dark Forest Capital Management Lp | 21.568 | -54,32 | 1.288 | -49,59 | ||||
| 2026-02-17 | 13F | Hood River Capital Management LLC | 1.588.403 | 0,63 | 94.859 | 4,52 | ||||
| 2026-02-12 | 13F | Ironwood Investment Management Llc | 79.387 | -0,16 | 4.741 | 3,67 | ||||
| 2026-02-11 | 13F | Simplex Trading, Llc | Put | 2.500 | -59,68 | 149 | ||||
| 2026-02-11 | 13F | Simplex Trading, Llc | Call | 6.400 | -28,89 | 382 | ||||
| 2026-02-17 | 13F | Aster Capital Management (DIFC) Ltd | 1.682 | 100 | ||||||
| 2025-11-13 | 13F | Fuller & Thaler Asset Management, Inc. | 0 | -100,00 | 0 | |||||
| 2025-11-12 | 13F | NewSquare Capital LLC | 0 | -100,00 | 0 | |||||
| 2026-02-13 | 13F | Morgan Stanley | 1.200.213 | -18,75 | 71.677 | -15,61 | ||||
| 2025-11-13 | 13F | Landscape Capital Management, L.l.c. | 0 | -100,00 | 0 | |||||
| 2026-02-06 | 13F | Leonteq Securities AG | 967 | -51,65 | 58 | -50,43 | ||||
| 2026-02-17 | 13F | Aqr Capital Management Llc | 2.800.493 | -17,43 | 167.245 | -14,25 | ||||
| 2026-02-03 | 13F | Crossmark Global Holdings, Inc. | 73.713 | 12,41 | 4.402 | 16,76 | ||||
| 2026-02-09 | 13F | Optimist Retirement Group LLC | 6.189 | 0,00 | 370 | 3,94 | ||||
| 2026-02-12 | 13F | Paralel Advisors LLC | 76.960 | 0,00 | 4.596 | 3,86 | ||||
| 2025-11-14 | 13F | LMR Partners LLP | 0 | -100,00 | 0 | |||||
| 2026-02-11 | 13F | Picton Mahoney Asset Management | 6.270 | 18.341,18 | 374 | |||||
| 2026-02-13 | 13F | Atlas Capital Advisors Llc | 12.107 | 2,90 | 723 | 13,68 | ||||
| 2026-02-17 | 13F | Worldquant Millennium Advisors Llc | 58.028 | 1.183,81 | 3.465 | 1.237,84 | ||||
| 2026-02-17 | 13F | Luxor Capital Group, LP | 245.983 | -8,31 | 14.690 | -4,76 | ||||
| 2026-02-17 | 13F | Janus Henderson Group Plc | 114.567 | -46,81 | 6.841 | -44,75 | ||||
| 2026-02-13 | 13F | Essex Investment Management Co Llc | 79.424 | -1,53 | 4.743 | 2,29 | ||||
| 2026-02-17 | 13F | D. E. Shaw & Co., Inc. | 63.403 | 26,72 | 3.786 | 31,64 | ||||
| 2026-02-17 | 13F | Capital Impact Advisors, LLC | 765.317 | 45.705 | ||||||
| 2026-02-03 | 13F | Sequoia Financial Advisors, LLC | 8.218 | 68,64 | 491 | 75,00 | ||||
| 2026-02-17 | 13F | D. E. Shaw & Co., Inc. | Put | 9.100 | 543 | |||||
| 2026-01-26 | 13F | KBC Group NV | 2.990 | 24,43 | 0 | |||||
| 2026-01-27 | 13F | TD Waterhouse Canada Inc. | 1.541 | 261,74 | 92 | 279,17 | ||||
| 2026-02-17 | 13F | State Of Wisconsin Investment Board | 175.459 | 1,62 | 10.478 | 5,55 | ||||
| 2025-11-14 | 13F | Motley Fool Asset Management LLC | 0 | -100,00 | 0 | -100,00 | ||||
| 2026-02-10 | 13F | Natixis Advisors, L.p. | 0 | -100,00 | 0 | |||||
| 2026-02-13 | 13F | Pathstone Holdings, LLC | 7.941 | 0,32 | 474 | 4,18 | ||||
| 2026-02-13 | 13F | Harber Asset Management Llc | 161.402 | -15,16 | 9.639 | -11,89 | ||||
| 2025-11-12 | 13F | Catalyst Funds Management Pty Ltd | 0 | -100,00 | 0 | |||||
| 2026-02-17 | 13F | Toronto Dominion Bank | 1 | 0 | ||||||
| 2026-02-12 | 13F | Federated Hermes, Inc. | 310.818 | 2,42 | 18.562 | 6,37 | ||||
| 2026-04-13 | 13F | True Wealth Design, LLC | 1.057 | -5,03 | 45 | -33,33 | ||||
| 2026-01-23 | 13F | Robeco Institutional Asset Management B.V. | 58.505 | 3.494 | ||||||
| 2026-04-13 | 13F | Hm Payson & Co | 100 | 0,00 | 4 | -20,00 | ||||
| 2026-04-15 | 13F | Financial Management Professionals, Inc. | 416 | -0,95 | 18 | -32,00 | ||||
| 2026-01-21 | 13F | Flagship Harbor Advisors, Llc | 744 | 44 | ||||||
| 2026-01-23 | 13F | Assetmark, Inc | 30.875 | -3,74 | 1.844 | -0,05 | ||||
| 2025-11-13 | 13F | FIL Ltd | 0 | -100,00 | 0 | |||||
| 2026-02-04 | 13F | LRI Investments, LLC | 156 | 0,00 | 9 | 12,50 | ||||
| 2026-02-17 | 13F | Aquatic Capital Management LLC | 11.675 | 697 | ||||||
| 2026-04-08 | 13F | NorthCrest Asset Manangement, LLC | 5.102 | -55,24 | 217 | -67,56 | ||||
| 2026-04-06 | 13F | GAMMA Investing LLC | 4.272 | 85,02 | 182 | 32,12 | ||||
| 2026-02-02 | 13F | Strs Ohio | 2.083 | 0,19 | 124 | 4,20 | ||||
| 2026-02-10 | 13F | Bnp Paribas Arbitrage, Sa | 62.007 | 17,67 | 3.703 | 22,25 | ||||
| 2026-02-12 | 13F | CIBC Private Wealth Group, LLC | 2.151 | 1,18 | 128 | 4,92 | ||||
| 2025-11-06 | 13F | Ground Swell Capital, LLC | 0 | -100,00 | 0 | |||||
| 2026-02-13 | 13F | Neuberger Berman Group LLC | 3.941 | -50,71 | 235 | -16,67 | ||||
| 2026-02-11 | 13F | LPL Financial LLC | 31.714 | -7,09 | 1.894 | -3,52 | ||||
| 2025-11-14 | 13F | Bayesian Capital Management, LP | 0 | -100,00 | 0 | |||||
| 2026-02-17 | 13F | Utah Retirement Systems | 4.600 | 0,00 | 275 | 3,79 | ||||
| 2026-01-29 | 13F | TrimTabs Asset Management, LLC | 0 | -100,00 | 0 | |||||
| 2026-01-30 | 13F | State of New Jersey Common Pension Fund D | 39.765 | -4,43 | 2.375 | -0,75 | ||||
| 2026-02-17 | 13F | Summit Trail Advisors, Llc | 19.597 | -11,13 | 1.170 | -7,66 | ||||
| 2026-02-11 | 13F | Deutsche Bank Ag\ | 222.413 | 1.782,62 | 13.283 | 1.856,11 | ||||
| 2026-02-13 | 13F | Citigroup Inc | 271.543 | 12,08 | 16.217 | 16,41 | ||||
| 2026-02-09 | 13F | Hartland & Co., LLC | 344 | -75,27 | 21 | -74,68 | ||||
| 2026-02-13 | 13F | Vontobel Holding Ltd. | 56.243 | -1,51 | 3.359 | 2,28 | ||||
| 2026-02-12 | 13F | Steward Partners Investment Advisory, Llc | 5.130 | 72,03 | 306 | 78,95 | ||||
| 2026-02-13 | 13F | Toroso Investments, LLC | 242.915 | 1.201,66 | 14.500 | 1.252,52 | ||||
| 2026-02-11 | 13F | Cerity Partners LLC | 135.188 | -5,13 | 8.073 | -1,46 | ||||
| 2026-01-08 | 13F | Nordea Investment Management Ab | 173.892 | -13,34 | 10.418 | -9,56 | ||||
| 2026-01-29 | 13F | Pictet Asset Management Holding SA | 14.861 | 6,59 | 887 | 10,74 | ||||
| 2026-02-17 | 13F | Silvercrest Asset Management Group Llc | 13.876 | -28,05 | 829 | -25,27 | ||||
| 2025-11-14 | 13F | Bares Capital Management, Inc. | 3.380.345 | -4,58 | 194.370 | 1,36 | ||||
| 2026-02-09 | 13F | Harbour Investments, Inc. | 144 | 28,57 | 9 | 33,33 | ||||
| 2026-02-23 | 13F | Mv Capital Management, Inc. | 4 | 0,00 | 0 | |||||
| 2026-02-17 | 13F | Capital Fund Management S.a. | 161.729 | 64,39 | 9.658 | 70,73 | ||||
| 2026-02-04 | 13F | Blackhawk Capital Partners LLC. | 8.806 | -1,22 | 526 | 2,54 | ||||
| 2026-02-13 | 13F | Commerce Bank | 26.011 | -0,08 | 1.553 | 3,81 | ||||
| 2026-02-13 | 13F | Boston Partners | 186.024 | -10,94 | 11.109 | -7,49 | ||||
| 2026-02-04 | 13F | Wsfs Capital Management, Llc | 6.045 | 361 | ||||||
| 2026-03-06 | 13F | Hsbc Holdings Plc | 31.088 | -4,70 | 1.863 | -0,53 | ||||
| 2026-02-06 | 13F | Pnc Financial Services Group, Inc. | 8.378 | 3,36 | 500 | 7,30 | ||||
| 2026-02-10 | 13F | Goldman Sachs Group Inc | 750.369 | 70,66 | 44.812 | 77,26 | ||||
| 2026-01-12 | 13F | Rialto Wealth Management, LLC | 11 | 22,22 | 1 | |||||
| 2026-02-17 | 13F | Man Group plc | 115.501 | 65,55 | 6.898 | 71,95 | ||||
| 2026-02-17 | 13F | United Capital Financial Advisers, Llc | 3.801 | 227 | ||||||
| 2025-11-12 | 13F | 111 Capital | 0 | -100,00 | 0 | |||||
| 2026-02-05 | 13F | HFM Investment Advisors, LLC | 9 | 0,00 | 1 | |||||
| 2026-02-13 | 13F | Charles Schwab Investment Management Inc | 847.933 | -0,68 | 50.639 | 3,15 | ||||
| 2026-02-20 | 13F | Sunbelt Securities, Inc. | 58 | -75,63 | 3 | -76,92 | ||||
| 2026-01-29 | 13F | Concurrent Investment Advisors, LLC | 6.125 | 366 | ||||||
| 2026-01-26 | 13F | Mirae Asset Global Investments Co., Ltd. | 33.197 | 9,77 | 1.983 | 14,04 | ||||
| 2026-02-17 | 13F | Russell Investments Group, Ltd. | 826.016 | -14,12 | 49.330 | -10,80 | ||||
| 2026-02-09 | 13F | Jefferies Financial Group Inc. | 5.984 | 357 | ||||||
| 2026-04-07 | 13F | CoreCap Advisors, LLC | 429 | -68,03 | 18 | -77,50 | ||||
| 2026-02-06 | 13F | Larson Financial Group LLC | 184 | 11 | ||||||
| 2026-02-14 | 13F | Shannon River Fund Management LLC | 1.038.832 | -24,95 | 62.039 | -22,05 | ||||
| 2026-02-09 | 13F | Hantz Financial Services, Inc. | 2.170 | 284,07 | 0 | |||||
| 2026-02-13 | 13F | American Century Companies Inc | 1.782.082 | 12,31 | 106.426 | 16,64 | ||||
| 2026-04-07 | 13F | Farther Finance Advisors, LLC | 9.458 | 6,93 | 400 | -24,43 | ||||
| 2026-01-28 | 13F | M&t Bank Corp | Call | 121 | 0 | |||||
| 2026-02-12 | 13F | Skopos Labs, Inc. | 3.452 | 215 | ||||||
| 2026-02-10 | 13F | Rothschild Investment Llc | 1.286 | -22,86 | 77 | -20,00 | ||||
| 2026-02-12 | 13F | Brinker Capital Investments, LLC | 28.035 | 12,19 | 1.674 | 16,57 | ||||
| 2026-04-20 | 13F | Sowell Financial Services LLC | 9.242 | -2,39 | 393 | -30,44 | ||||
| 2026-04-07 | 13F | Signaturefd, Llc | 1.753 | 39,35 | 75 | -1,33 | ||||
| 2026-02-17 | 13F | Bank Of America Corp /de/ | 403.594 | -18,35 | 24.103 | -15,19 | ||||
| 2026-04-06 | 13F | Private Client Services, Llc | 14.410 | -53,22 | 613 | -66,67 | ||||
| 2026-02-13 | 13F | Arrowstreet Capital, Limited Partnership | 81.070 | 4.842 | ||||||
| 2025-10-31 | 13F | Symphony Financial, Ltd. Co. | 0 | -100,00 | 0 | -100,00 | ||||
| 2025-11-14 | 13F | Full Sail Capital, LLC | 5.320 | 37,40 | 306 | 45,93 | ||||
| 2026-02-10 | 13F | New Mexico Educational Retirement Board | 18.000 | 0,00 | 1 | 0,00 | ||||
| 2026-02-18 | 13F | Vident Advisory, LLC | 82.206 | 21,35 | 4.909 | 26,03 | ||||
| 2026-01-29 | 13F | Comerica Bank | 31.914 | -8,02 | 1.906 | -4,51 | ||||
| 2026-02-03 | 13F | Ethic Inc. | 4.644 | 14,50 | 277 | 18,88 | ||||
| 2026-02-13 | 13F | Bridgewater Associates, LP | 146.825 | -32,80 | 8.768 | -30,21 | ||||
| 2026-04-13 | 13F | Gateway Investment Advisers Llc | 0 | -100,00 | 0 | |||||
| 2026-02-17 | 13F | Css Llc/il | 10.440 | 114,37 | 623 | 122,50 | ||||
| 2026-02-06 | 13F | Vestmark Advisory Solutions, Inc. | 16.470 | 984 | ||||||
| 2026-02-17 | 13F | RiverPark Advisors, LLC | 1.430 | 85 | ||||||
| 2026-02-13 | 13F | Smartleaf Asset Management LLC | 773 | -72,38 | 47 | -71,17 | ||||
| 2026-02-13 | 13F | SG Capital Management LLC | 157.288 | 9.393 | ||||||
| 2026-02-13 | 13F | Parkside Financial Bank & Trust | 386 | 14,88 | 23 | 21,05 | ||||
| 2026-02-02 | 13F | Danske Bank A/s | 1.000 | -99,12 | 60 | -99,09 | ||||
| 2026-01-14 | 13F | Fluent Financial, LLC | 0 | -100,00 | 0 | |||||
| 2026-02-13 | 13F | North Peak Capital Management, LLC | 2.400.065 | 2,28 | 143.332 | 6,23 | ||||
| 2026-02-19 | 13F | CI Private Wealth, LLC | 28.323 | 22,70 | 1.691 | 27,43 | ||||
| 2026-01-30 | 13F | Torren Management, LLC | 932 | 56 | ||||||
| 2026-02-12 | 13F | Dimensional Fund Advisors Lp | 2.529.767 | 2,48 | 151.094 | 6,44 | ||||
| 2026-02-17 | 13F | Trexquant Investment LP | 150.626 | 188,08 | 8.995 | 199,23 | ||||
| 2026-04-17 | 13F | HHM Wealth Advisors, LLC | 100 | 0,00 | 4 | -20,00 | ||||
| 2026-02-04 | 13F | Pacer Advisors, Inc. | 0 | -100,00 | 0 | -100,00 | ||||
| 2026-02-09 | 13F | Lisanti Capital Growth, LLC | 93.526 | 36,40 | 5.585 | 41,68 | ||||
| 2026-02-13 | 13F | Quarry LP | 0 | -100,00 | 0 | |||||
| 2026-02-12 | 13F | Nuveen, LLC | 241.791 | -33,75 | 14.440 | -31,19 | ||||
| 2026-02-14 | 13F | POM Investment Strategies, LLC | 27 | 2 | ||||||
| 2026-02-17 | 13F | Alliancebernstein L.p. | 102.944 | -9,43 | 6.148 | -5,94 | ||||
| 2026-02-17 | 13F | Caisse De Depot Et Placement Du Quebec | 32.613 | 1.948 | ||||||
| 2025-11-14 | 13F | Engineers Gate Manager LP | 0 | -100,00 | 0 | |||||
| 2026-04-20 | 13F | State of Alaska, Department of Revenue | 8.726 | -3,11 | 0 | |||||
| 2025-11-10 | 13F | Counterpoint Mutual Funds LLC | 0 | -100,00 | 0 | |||||
| 2025-11-14 | 13F | PineBridge Investments, L.P. | 22.352 | -90,51 | 1.285 | -89,92 | ||||
| 2026-04-07 | 13F | Park Avenue Securities Llc | 6.338 | 60,90 | 0 | |||||
| 2026-02-12 | 13F/A | Pinebridge Investments Llc | 47.482 | 2.836 | ||||||
| 2025-10-29 | 13F | WPG Advisers, LLC | 0 | -100,00 | 0 | |||||
| 2026-02-10 | 13F | Envestnet Asset Management Inc | 203.970 | -0,37 | 12.181 | 3,48 | ||||
| 2025-11-21 | 13F/A | Royal Bank Of Canada | Call | 0 | -100,00 | 0 | -100,00 | |||
| 2026-02-11 | 13F | Renaissance Group Llc | 540.430 | 32.274 | ||||||
| 2025-11-14 | 13F | SWAN Capital LLC | 0 | -100,00 | 0 | |||||
| 2026-02-04 | 13F | Oregon Public Employees Retirement Fund | 18.300 | -1,61 | 1.093 | 2,15 | ||||
| 2025-11-14 | 13F | DZ BANK AG Deutsche Zentral Genossenschafts Bank, Frankfurt am Main | 0 | -100,00 | 0 | |||||
| 2026-02-11 | 13F | Allianz Asset Management GmbH | 0 | -100,00 | 0 | |||||
| 2026-02-09 | 13F | Jackson Creek Investment Advisors LLC | 30.878 | -0,75 | 2 | 0,00 | ||||
| 2026-01-12 | 13F | CVA Family Office, LLC | 23 | 0,00 | 1 | 0,00 | ||||
| 2026-02-11 | 13F | Manchester Capital Management LLC | 18 | 1 | ||||||
| 2026-02-17 | 13F | Quantinno Capital Management LP | 242.206 | 13,87 | 14.465 | 18,27 | ||||
| 2025-10-24 | 13F | Hemington Wealth Management | 178 | 4,71 | 0 | |||||
| 2026-04-08 | 13F | Wealth Enhancement Advisory Services, Llc | 74.668 | -85,03 | 2.965 | -90,11 | ||||
| 2026-02-12 | 13F | Bank Of Montreal /can/ | 13.841 | -1,59 | 827 | 2,23 | ||||
| 2026-02-17 | 13F | Point72 Asset Management, L.P. | 0 | -100,00 | 0 | |||||
| 2026-02-14 | 13F | American Trust | 6.520 | 0,00 | 389 | 4,01 | ||||
| 2026-02-17 | 13F | Raymond James Financial Inc | 686.081 | -25,10 | 41.590 | -21,04 | ||||
| 2026-02-12 | 13F | Integrated Quantitative Investments LLC | 15.660 | 15,59 | 935 | 20,03 | ||||
| 2026-02-17 | 13F | Mirabella Financial Services Llp | 3.867 | 231 | ||||||
| 2025-11-14 | 13F | DRW Securities, LLC | 0 | -100,00 | 0 | |||||
| 2026-01-21 | 13F | Sound Income Strategies, LLC | 0 | -100,00 | 0 | |||||
| 2026-02-03 | 13F | SBI Securities Co., Ltd. | 1.102 | -9,75 | 66 | -7,14 | ||||
| 2026-02-13 | 13F | Missouri Trust & Investment Co | 104 | 0,00 | 6 | 20,00 | ||||
| 2026-04-08 | 13F | DiNuzzo Private Wealth, Inc. | 16 | -27,27 | 1 | -100,00 | ||||
| 2026-02-13 | 13F | First Trust Advisors Lp | 1.418.576 | 27,60 | 84.717 | 32,53 | ||||
| 2026-02-17 | 13F | Amundi | 39.881 | 0,63 | 2.382 | 7,84 | ||||
| 2025-10-23 | 13F | CX Institutional | 0 | -100,00 | 0 | |||||
| 2026-02-11 | 13F | Vise Technologies, Inc. | 4.404 | 263 | ||||||
| 2026-02-13 | 13F | Public Employees Retirement Association Of Colorado | 10.716 | 0,00 | 1 | |||||
| 2026-01-29 | 13F | IMC-Chicago, LLC | Call | 28.400 | 77,50 | 1.696 | 84,35 | |||
| 2026-02-13 | 13F | Martingale Asset Management L P | 51.609 | -46,30 | 3.082 | -44,22 | ||||
| 2026-04-16 | 13F | Evolve Private Wealth, Llc | 7.251 | 1,61 | 309 | -27,70 | ||||
| 2026-02-13 | 13F | Sei Investments Co | 688.309 | 50,76 | 41.106 | 56,58 | ||||
| 2026-02-11 | 13F | O'shaughnessy Asset Management, Llc | 7.158 | 41,43 | 427 | 46,74 | ||||
| 2026-04-16 | 13F | Upper Left Wealth Management, LLC | 0 | -100,00 | 0 | |||||
| 2026-02-06 | 13F | Sierra Summit Advisors Llc | 0 | -100,00 | 0 | |||||
| 2026-01-30 | 13F | Bogart Wealth, LLC | 9 | 0,00 | 1 | |||||
| 2026-02-09 | 13F | Legal & General Group Plc | 135.790 | -8,47 | 8.109 | -4,94 | ||||
| 2026-02-06 | 13F | Prescott Group Capital Management, L.l.c. | 72.071 | 38,60 | 4.304 | 43,95 | ||||
| 2026-02-13 | 13F | Change Path, LLC | 4.361 | 2,37 | 260 | 6,56 | ||||
| 2026-02-11 | 13F | Buckingham Strategic Partners | 14.173 | -18,70 | 846 | -17,54 | ||||
| 2026-02-17 | 13F | MIRAE ASSET GLOBAL ETFS HOLDINGS Ltd. | 2.394.839 | 5,46 | 143.030 | 9,54 | ||||
| 2026-02-09 | 13F | Penn Capital Management Co Inc | 19.623 | -2,52 | 1.194 | 1,36 | ||||
| 2026-01-28 | 13F | Universal- Beteiligungs- und Servicegesellschaft mbH | 198.621 | 15,85 | 12.012 | 21,85 | ||||
| 2026-02-10 | 13F | Hillsdale Investment Management Inc. | 34.700 | -34,16 | 2.072 | -31,62 | ||||
| 2026-02-17 | 13F | Zacks Investment Management | 119.239 | 0,81 | 7.121 | 4,69 | ||||
| 2026-02-13 | 13F | Strategic Global Advisors, LLC | 38.362 | -1,54 | 2.291 | 2,23 | ||||
| 2026-02-13 | 13F | Fieldview Capital Management, LLC | 9.020 | -34,51 | 539 | -31,98 | ||||
| 2026-02-13 | 13F | Ubs Asset Management Americas Inc | 438.378 | 65,07 | 26.180 | 71,44 | ||||
| 2026-02-17 | 13F | Guggenheim Capital Llc | 4.786 | -19,86 | 286 | -16,91 | ||||
| 2026-02-10 | 13F | 1492 Capital Management LLC | 98.790 | 1,46 | 5.900 | 5,38 | ||||
| 2026-02-13 | 13F | Barclays Plc | Call | 100.000 | 0,00 | 5.972 | 3,86 | |||
| 2026-02-13 | 13F | Manufacturers Life Insurance Company, The | 0 | -100,00 | 0 | |||||
| 2026-02-13 | 13F | Barclays Plc | 108.838 | -29,90 | 6.500 | -27,20 | ||||
| 2026-01-13 | 13F | Trust Point Inc. | 0 | -100,00 | 0 | |||||
| 2026-02-02 | 13F | Oppenheimer Asset Management Inc. | 9.639 | -2,46 | 576 | 1,23 | ||||
| 2026-02-17 | 13F | Canada Pension Plan Investment Board | 437.400 | 21,64 | 26.122 | 26,33 | ||||
| 2026-02-06 | 13F | EverSource Wealth Advisors, LLC | 4.668 | -2,71 | 279 | 1,09 | ||||
| 2026-02-13 | 13F | Edgestream Partners, L.P. | 92.505 | 5.524 |