Grundlæggende statistik
| Institutionelle ejere | 173 total, 173 long only, 0 short only, 0 long/short - change of 0,00% MRQ |
| Gennemsnitlig porteføljeallokering | 0.2010 % - change of -11,91% MRQ |
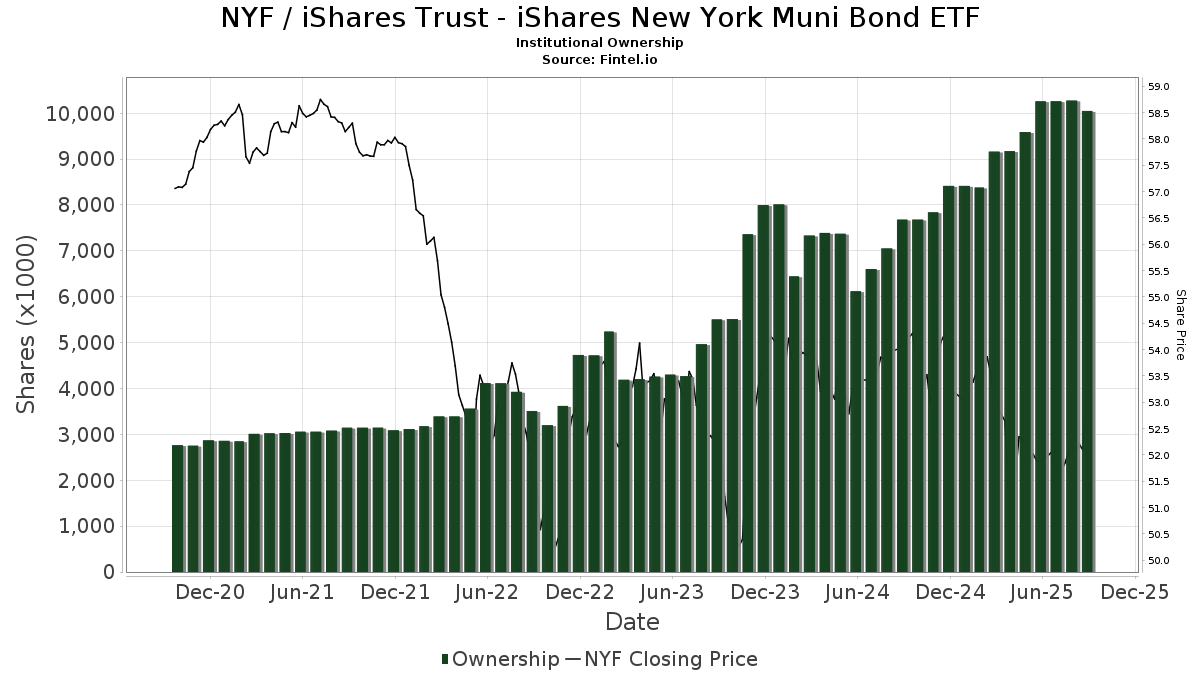
| Institutionelle aktier (lange) | 10.050.819 (ex 13D/G) - change of -0,21MM shares -2,05% MRQ |
| Institutionel værdi (lang) | $ 506.248 USD ($1000) |
Institutionelt ejerskab og aktionærer
iShares Trust - iShares New York Muni Bond ETF (US:NYF) har 173 institutionelle ejere og aktionærer, der har indsendt 13D/G- eller 13F-formularer til Securities Exchange Commission (SEC). Disse institutioner har i alt 10,050,819 aktier. Største aktionærer omfatter Tiaa Trust, National Association, High Probability Advisors, LLC, Bank Of America Corp /de/, Morgan Stanley, Fmr Llc, Facet Wealth, Inc., HighTower Advisors, LLC, Adviser Investments LLC, Jane Street Group, Llc, and Satovsky Asset Management Llc .
iShares Trust - iShares New York Muni Bond ETF (ARCA:NYF) institutionel ejerskabsstruktur viser aktuelle positioner i virksomheden efter institutioner og fonde, samt seneste ændringer i positionsstørrelse. Større aktionærer kan omfatte individuelle investorer, investeringsforeninger, hedgefonde eller institutioner. Skema 13D angiver, at investoren besidder (eller besidder) mere end 5 % af virksomheden og har til hensigt (eller har til hensigt at) aktivt at forfølge en ændring i forretningsstrategi. Skema 13G indikerer en passiv investering på over 5%.
The share price as of September 12, 2025 is 53,25 / share. Previously, on September 12, 2024, the share price was 54,14 / share. This represents a decline of 1,64% over that period.
Fondens stemningsscore
Fund Sentiment Score (fka Ownership Accumulation Score) finder de aktier, der bliver mest købt af fonde. Det er resultatet af en sofistikeret, multi-faktor kvantitativ model, der identificerer virksomheder med de højeste niveauer af institutionel akkumulering. Scoringsmodellen bruger en kombination af den samlede stigning i oplyste ejere, ændringerne i porteføljeallokeringer i disse ejere og andre målinger. Tallet går fra 0 til 100, hvor højere tal indikerer et højere niveau af akkumulering for sine jævnaldrende, og 50 er gennemsnittet.
Opdateringsfrekvens: Dagligt
Se Ownership Explorer, som giver en liste over højest rangerende virksomheder.
Institutionel Put/Call-forhold
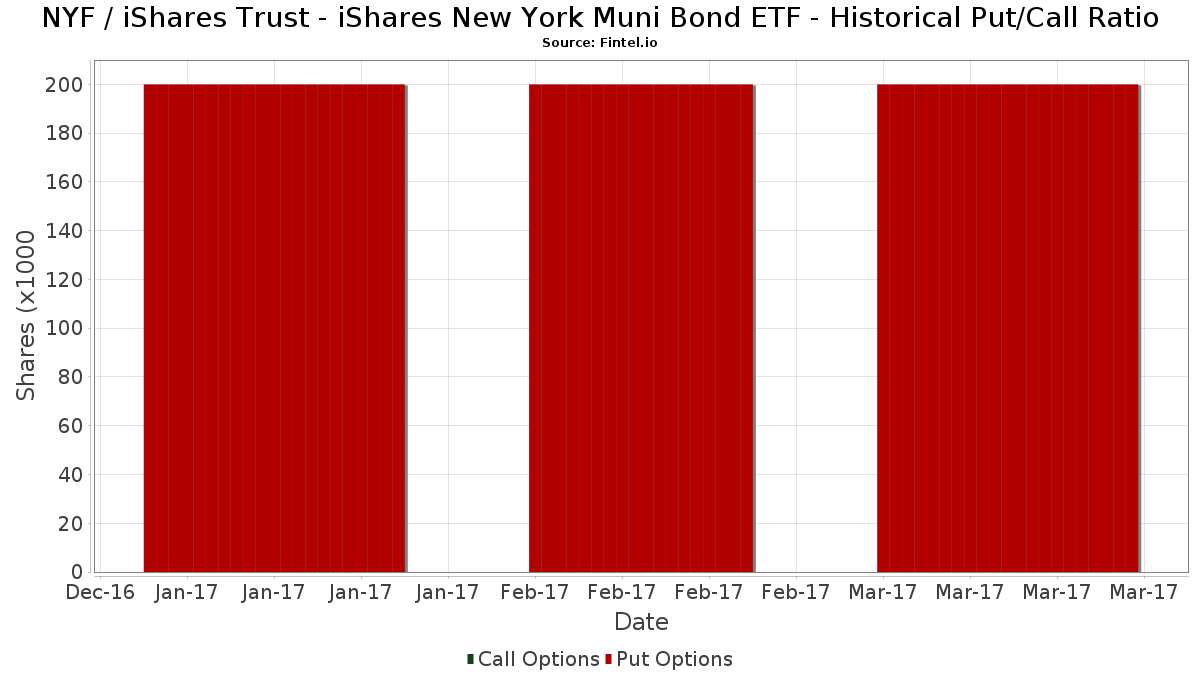
Ud over at indberette standardaktie- og gældsudstedelser skal institutter med mere end 100 mill. aktiver under forvaltning også oplyse deres put- og call-optionsbeholdninger. Da salgsoptioner generelt indikerer negativ stemning, og købsoptioner indikerer positiv stemning, kan vi få en fornemmelse af den overordnede institutionelle stemning ved at plotte forholdet mellem put og kald. Diagrammet til højre viser det historiske put/call-forhold for dette instrument.
Brug af Put/Call Ratio som en indikator for investorernes stemning overvinder en af de vigtigste mangler ved at bruge totalt institutionelt ejerskab, som er, at en betydelig mængde af aktiver under forvaltning investeres passivt for at spore indekser. Passivt forvaltede fonde køber typisk ikke optioner, så indikatoren for put/call-forholdet følger mere nøje følelsen af aktivt forvaltede fonde.
13F og NPORT arkivering
Detaljer om 13F-arkivering er gratis. Detaljer om NP-ansøgninger kræver et premium-medlemskab. Grønne rækker angiver nye positioner. Røde rækker angiver lukkede positioner. Klik på linket ikon for at se den fulde transaktionshistorik.
Opgrader
for at låse premium-data op og eksportere til Excel ![]() .
.
| Fil dato | Kilde | Investor | Type | Gennemsnitlig pris (Øst) |
Aktier | Δ Aktier (%) |
Rapporteret Værdi ($1000) |
Δ Værdi (%) |
Port Alloc (%) |
|
|---|---|---|---|---|---|---|---|---|---|---|
| 2025-08-12 | 13F | Deutsche Bank Ag\ | 3.329 | -10,39 | 174 | -11,28 | ||||
| 2025-08-08 | 13F | Creative Planning | 68.226 | 30,56 | 3.557 | 29,30 | ||||
| 2025-07-15 | 13F | North Star Investment Management Corp. | 7.050 | 0,00 | 368 | -1,08 | ||||
| 2025-07-15 | 13F | Level Financial Advisors, Inc. | 39.770 | 11,60 | 2.074 | 10,50 | ||||
| 2025-07-22 | 13F | Stanich Group LLC | 0 | -100,00 | 0 | |||||
| 2025-07-31 | 13F | CNB Bank | 5.482 | 0,00 | 286 | -1,04 | ||||
| 2025-08-07 | 13F | Cascade Financial Partners, LLC | 58.225 | 0,00 | 3.036 | -0,98 | ||||
| 2025-08-13 | 13F | Wealthedge Investment Advisors, Llc | 0 | -100,00 | 0 | |||||
| 2025-08-14 | 13F | Integrated Wealth Concepts LLC | 5.188 | 0,74 | 271 | -0,37 | ||||
| 2025-07-16 | 13F | Independent Wealth Network Inc. | 7.420 | 0,05 | 387 | -1,03 | ||||
| 2025-07-31 | 13F | Cambridge Investment Research Advisors, Inc. | 20.397 | 101,49 | 1 | |||||
| 2025-08-14 | 13F | Atomi Financial Group, Inc. | 17.069 | 27,06 | 890 | 25,74 | ||||
| 2025-07-08 | 13F | 21 West Wealth Management LLC | 4.761 | 248 | ||||||
| 2025-08-07 | 13F | Brio Consultants, LLC | 7.171 | 11,65 | 374 | 10,36 | ||||
| 2025-05-14 | 13F | Citizens Business Bank | 0 | -100,00 | 0 | |||||
| 2025-07-11 | 13F | Westfuller Advisors, LLC | 13.752 | 0,74 | 717 | -0,14 | ||||
| 2025-07-15 | 13F | Mather Group, Llc. | 0 | -100,00 | 0 | |||||
| 2025-08-14 | 13F | Stifel Financial Corp | 12.983 | 0,71 | 677 | -0,29 | ||||
| 2025-07-08 | 13F | Parallel Advisors, LLC | 28 | 0,00 | 1 | 0,00 | ||||
| 2025-08-14 | 13F | EP Wealth Advisors, Inc. | 9.910 | -20,94 | 517 | -21,70 | ||||
| 2025-07-17 | 13F | Dopkins Wealth Management, Llc | 4.477 | 233 | ||||||
| 2025-08-04 | 13F | Assetmark, Inc | 65.516 | -7,16 | 3.416 | -8,05 | ||||
| 2025-07-25 | 13F | McNamara Financial Services, Inc. | 10.214 | 0,00 | 533 | -0,93 | ||||
| 2025-07-30 | 13F | Durante & Waters, Llc | 44.050 | -0,27 | 2.297 | -1,25 | ||||
| 2025-08-05 | 13F | Tiaa Trust, National Association | 858.675 | -13,16 | 44.771 | -14,00 | ||||
| 2025-08-12 | 13F | Coldstream Capital Management Inc | 0 | -100,00 | 0 | |||||
| 2025-08-14 | 13F | Citadel Advisors Llc | 13.015 | 679 | ||||||
| 2025-07-21 | 13F | Hudson Valley Investment Advisors Inc /adv | 9.700 | -3,48 | 506 | -4,54 | ||||
| 2025-08-05 | 13F | J. W. Coons Advisors, LLC | 4.000 | 0,00 | 209 | -0,95 | ||||
| 2025-08-08 | 13F | Francis Financial, Inc. | 45.343 | -74,97 | 2.364 | -75,21 | ||||
| 2025-08-12 | 13F | Proequities, Inc. | 0 | 0 | ||||||
| 2025-05-06 | 13F | Goodwin Investment Advisory | 0 | -100,00 | 0 | |||||
| 2025-07-29 | 13F | Members Advisory Group LLC | 19.692 | 7,35 | 1.027 | 6,32 | ||||
| 2025-09-04 | 13F/A | Advisor Group Holdings, Inc. | 52.781 | -38,91 | 2.752 | -39,49 | ||||
| 2025-08-06 | 13F | Rialto Wealth Management, LLC | 402 | 28,85 | 21 | 25,00 | ||||
| 2025-08-11 | 13F | Conquis Financial Llc | 25.354 | 179,94 | 1.322 | 177,52 | ||||
| 2025-08-08 | 13F | Gts Securities Llc | 5.076 | 265 | ||||||
| 2025-07-14 | 13F | Opal Wealth Advisors, LLC | 15.033 | 8,62 | 784 | 7,55 | ||||
| 2025-07-14 | 13F | GAMMA Investing LLC | 8.286 | -2,54 | 432 | -3,36 | ||||
| 2025-04-11 | 13F | First Affirmative Financial Network | 4.450 | 234 | ||||||
| 2025-07-17 | 13F | Keystone Global Partners, LLC | 5.225 | 20,50 | 272 | 19,30 | ||||
| 2025-08-14 | 13F | Royal Bank Of Canada | 10.225 | 5,25 | 533 | 4,10 | ||||
| 2025-07-31 | 13F | Buckingham Strategic Partners | 4.477 | 233 | ||||||
| 2025-07-02 | 13F | Dentgroup LLC | 5.634 | 294 | ||||||
| 2025-07-10 | 13F | Wealth Enhancement Advisory Services, Llc | 13.617 | -6,94 | 709 | -8,05 | ||||
| 2025-04-01 | 13F | Massmutual Trust Co Fsb/adv | 0 | -100,00 | 0 | |||||
| 2025-07-29 | 13F | Stratos Wealth Partners, LTD. | 8.868 | 462 | ||||||
| 2025-08-15 | 13F | Kestra Advisory Services, LLC | 42.451 | 607,63 | 2.213 | 602,54 | ||||
| 2025-08-14 | 13F | Graney & King, LLC | 4.539 | -5,44 | 237 | -6,35 | ||||
| 2025-08-11 | 13F | Wealthspire Advisors, LLC | 19.686 | -57,41 | 1.026 | -57,83 | ||||
| 2025-08-04 | 13F | Creative Financial Designs Inc /adv | 2.223 | 0,05 | 116 | -1,71 | ||||
| 2025-08-14 | 13F | Two Sigma Securities, Llc | 3.864 | 201 | ||||||
| 2025-08-06 | 13F | Long Run Wealth Advisors, LLC | 10.520 | 0,15 | 549 | -0,90 | ||||
| 2025-08-07 | 13F | Fidelis Capital Partners, LLC | 7.290 | 0,00 | 380 | 0,26 | ||||
| 2025-05-14 | 13F | Susquehanna International Group, Llp | 0 | -100,00 | 0 | |||||
| 2025-08-14 | 13F | AllSquare Wealth Management LLC | 4.219 | -8,46 | 220 | -9,50 | ||||
| 2025-08-14 | 13F | Fairview Capital Investment Management, Llc | 0 | -100,00 | 0 | |||||
| 2025-07-23 | 13F | Sax Wealth Advisors, Llc | 0 | -100,00 | 0 | |||||
| 2025-08-14 | 13F | Marshall Investment Management, Llc | 0 | -100,00 | 0 | |||||
| 2025-07-16 | 13F | TCI Wealth Advisors, Inc. | 18.698 | 0,00 | 975 | -1,02 | ||||
| 2025-08-29 | 13F | Centaurus Financial, Inc. | 3.237 | 0 | ||||||
| 2025-04-10 | 13F | Lmcg Investments, Llc | 0 | -100,00 | 0 | -100,00 | ||||
| 2025-08-12 | 13F | O'shaughnessy Asset Management, Llc | 10.204 | 20,25 | 532 | 19,28 | ||||
| 2025-08-05 | 13F | Astra Wealth Partners LLC | 5.438 | -30,23 | 284 | -30,98 | ||||
| 2025-08-11 | 13F | Bell Investment Advisors, Inc | 8.926 | 0,73 | 465 | -0,21 | ||||
| 2025-08-07 | 13F | Allworth Financial LP | 19.474 | -1,35 | 1.015 | -0,78 | ||||
| 2025-04-23 | 13F | Spire Wealth Management | 0 | -100,00 | 0 | |||||
| 2025-07-21 | 13F | Empirical Financial Services, LLC d.b.a. Empirical Wealth Management | 9.581 | 500 | ||||||
| 2025-08-14 | 13F | Fmr Llc | 406.868 | 21,47 | 21.214 | 20,29 | ||||
| 2025-08-06 | 13F | Commonwealth Equity Services, Llc | 85.566 | 46,22 | 4 | 33,33 | ||||
| 2025-08-15 | 13F | CI Private Wealth, LLC | 22.007 | 26,59 | 1.147 | 25,36 | ||||
| 2025-08-01 | 13F | Equita Financial Network, Inc. | 23.069 | -24,79 | 1.203 | -25,53 | ||||
| 2025-08-14 | 13F | UBS Group AG | 125.921 | 4,00 | 6.566 | 3,00 | ||||
| 2025-07-15 | 13F | Farrell Financial LLC | 15.504 | -25,43 | 808 | -26,14 | ||||
| 2025-07-16 | 13F | St Germain D J Co Inc | 7.093 | -3,30 | 370 | -4,40 | ||||
| 2025-08-14 | 13F | Mercer Global Advisors Inc /adv | 14.761 | -49,46 | 770 | -49,97 | ||||
| 2025-08-14 | 13F | Ameriprise Financial Inc | 48.711 | -49,61 | 2.513 | -50,64 | ||||
| 2025-08-14 | 13F | Goldman Sachs Group Inc | 73.378 | 2,30 | 3.826 | 1,30 | ||||
| 2025-08-14 | 13F | Alliancebernstein L.p. | 88.879 | 2,94 | 4.634 | 1,94 | ||||
| 2025-07-14 | 13F | Conrad Siegel Investment Advisors, Inc. | 24.438 | 22,43 | 1.274 | 21,33 | ||||
| 2025-07-18 | 13F | SOA Wealth Advisors, LLC. | 49.768 | 82,18 | 2.595 | 80,39 | ||||
| 2025-05-15 | 13F | Lido Advisors, LLC | 0 | -100,00 | 0 | -100,00 | ||||
| 2025-08-14 | 13F | First Foundation Advisors | 27.065 | 1.411 | ||||||
| 2025-08-07 | 13F | Hennion & Walsh Asset Management, Inc. | 75.952 | 9,28 | 3.960 | 8,23 | ||||
| 2025-07-23 | 13F | Stephen J. Garry & Associates, Llc | 4.110 | 0,00 | 214 | -0,93 | ||||
| 2025-08-06 | 13F | Middleton & Co Inc/ma | 0 | -100,00 | 0 | |||||
| 2025-07-17 | 13F | LifeGoal Wealth Advisors | 17.510 | 8,37 | 913 | 7,29 | ||||
| 2025-08-14 | 13F | Sei Investments Co | 11.623 | -14,28 | 606 | -15,01 | ||||
| 2025-07-16 | 13F | Magnus Financial Group LLC | 33.128 | 35,99 | 1.727 | 34,71 | ||||
| 2025-08-01 | 13F | Envestnet Asset Management Inc | 205.163 | 4,83 | 10.697 | 3,82 | ||||
| 2025-07-02 | 13F | Boston Standard Wealth Management, LLC | 6.895 | 8,29 | 360 | 5,88 | ||||
| 2025-07-24 | 13F | IFP Advisors, Inc | 1.689 | 0,18 | 88 | 0,00 | ||||
| 2025-07-31 | 13F | Wealthfront Advisers Llc | 10.848 | -11,71 | 566 | -12,54 | ||||
| 2025-08-05 | 13F | Crestwood Advisors Group LLC | 7.333 | 0,00 | 382 | -1,04 | ||||
| 2025-08-06 | 13F | Wsfs Capital Management, Llc | 7.226 | -9,75 | 377 | -10,69 | ||||
| 2025-05-15 | 13F/A | Orion Portfolio Solutions, LLC | 10.111 | 0,00 | 532 | -1,12 | ||||
| 2025-07-09 | 13F | Alesco Advisors Llc | 292.550 | -10,54 | 15.254 | -11,41 | ||||
| 2025-07-25 | 13F | Atria Wealth Solutions, Inc. | 25.559 | 26,82 | 1.332 | 25,54 | ||||
| 2025-07-14 | 13F | Signature Securities Group Corporation | 16.085 | 2,69 | 839 | 1,70 | ||||
| 2025-07-17 | 13F | Paradigm Financial Partners, Llc | 6.371 | -6,53 | 332 | -7,26 | ||||
| 2025-08-05 | 13F | W.G. Shaheen & Associates DBA Whitney & Co | 11.544 | 1,99 | 602 | 1,01 | ||||
| 2025-08-08 | 13F | Altfest L J & Co Inc | 111.430 | 16,53 | 5.810 | 15,40 | ||||
| 2025-08-14 | 13F | Wells Fargo & Company/mn | 55.381 | 2,98 | 2.888 | 1,98 | ||||
| 2025-08-13 | 13F | Cerity Partners LLC | 9.518 | 0,00 | 496 | -1,00 | ||||
| 2025-08-14 | 13F | Mml Investors Services, Llc | 24.270 | 9,01 | 1 | 0,00 | ||||
| 2025-08-15 | 13F | Captrust Financial Advisors | 6.265 | 327 | ||||||
| 2025-08-11 | 13F | Brown Brothers Harriman & Co | 166 | 0,00 | 9 | 0,00 | ||||
| 2025-04-16 | 13F | New Century Financial Group, LLC | 0 | -100,00 | 0 | |||||
| 2025-07-18 | 13F | Northeast Financial Group, Inc. | 5.414 | -9,45 | 282 | -10,19 | ||||
| 2025-08-13 | 13F | Baird Financial Group, Inc. | 0 | -100,00 | 0 | |||||
| 2025-07-09 | 13F | High Probability Advisors, LLC | 668.495 | 5,09 | 34.855 | 4,07 | ||||
| 2025-08-06 | 13F | Adviser Investments LLC | 353.480 | 0,95 | 18.430 | -0,03 | ||||
| 2025-08-12 | 13F | Nemes Rush Group LLC | 3.930 | 0,74 | 205 | -0,49 | ||||
| 2025-08-01 | 13F | Facet Wealth, Inc. | 392.537 | 5,80 | 20.400 | 5,56 | ||||
| 2025-08-11 | 13F | Citigroup Inc | 15.430 | 165,12 | 805 | 162,75 | ||||
| 2025-07-22 | 13F | Sutton Place Investors Llc | 7.539 | -10,95 | 393 | -11,69 | ||||
| 2025-08-13 | 13F | Jones Financial Companies Lllp | 5.186 | 293,77 | 270 | 289,86 | ||||
| 2025-08-13 | 13F | American Investment Services, Inc. | 4.925 | 0,00 | 257 | -1,16 | ||||
| 2025-07-24 | 13F | Drucker Wealth 3.0, LLC | 26.700 | 42,63 | 1.391 | 41,12 | ||||
| 2025-07-29 | 13F | Private Trust Co Na | 2.018 | 0,00 | 105 | -0,94 | ||||
| 2025-08-11 | 13F | HighTower Advisors, LLC | 382.305 | -10,81 | 19.933 | -11,67 | ||||
| 2025-07-29 | 13F | Stratos Wealth Advisors, LLC | 16.808 | 0,00 | 876 | -0,90 | ||||
| 2025-08-08 | 13F | Pnc Financial Services Group, Inc. | 1.976 | 5.711,76 | 103 | 10.200,00 | ||||
| 2025-08-13 | 13F | Flow Traders U.s. Llc | 26.274 | 439,62 | 1 | |||||
| 2025-08-12 | 13F | Global Retirement Partners, LLC | 0 | -100,00 | 0 | |||||
| 2025-08-13 | 13F | Hsbc Holdings Plc | 282.000 | -0,48 | 14.703 | -1,45 | ||||
| 2025-07-22 | 13F | Relyea Zuckerberg Hanson LLC | 0 | -100,00 | 0 | |||||
| 2025-08-11 | 13F | Arrow Financial Corp | 86.275 | -2,74 | 4.498 | -3,68 | ||||
| 2025-08-15 | 13F | Morgan Stanley | 455.538 | -10,05 | 23.752 | -10,92 | ||||
| 2025-08-06 | 13F | Quadrant Private Wealth Management, LLC | 4.793 | 250 | ||||||
| 2025-08-13 | 13F | Satovsky Asset Management Llc | 328.830 | -0,88 | 17.145 | -1,84 | ||||
| 2025-07-23 | 13F | Eagle Rock Investment Company, Llc | 10.000 | 66,67 | 521 | 65,40 | ||||
| 2025-08-07 | 13F | King Luther Capital Management Corp | 723 | -0,96 | ||||||
| 2025-08-14 | 13F | Dimension Capital Management Llc | 16.379 | 0,00 | 854 | -0,93 | ||||
| 2025-08-13 | 13F | Townsquare Capital Llc | 0 | -100,00 | 0 | |||||
| 2025-08-27 | 13F/A | Brinker Capital Investments, LLC | 9.806 | -3,02 | 511 | -3,95 | ||||
| 2025-08-14 | 13F | Mpwm Advisory Solutions, Llc | 430 | 0,00 | 22 | 0,00 | ||||
| 2025-08-11 | 13F | Elequin Capital Lp | 4.916 | -72,71 | 256 | -73,00 | ||||
| 2025-08-14 | 13F | Mariner, LLC | 160.513 | -23,94 | 8.367 | -24,69 | ||||
| 2025-07-10 | 13F | Wedmont Private Capital | 46.725 | 0,09 | 2.433 | 1,63 | ||||
| 2025-07-31 | 13F | Carnegie Capital Asset Management, LLC | 50.936 | 3,35 | 2.656 | 2,35 | ||||
| 2025-07-15 | 13F | James J. Burns & Company, LLC | 58.734 | -9,38 | 3.062 | -10,26 | ||||
| 2025-07-25 | NP | FNYTX - Franklin New York Tax-free Income Fund Class A1 | 0 | -100,00 | 0 | -100,00 | ||||
| 2025-07-11 | 13F | Farther Finance Advisors, LLC | 1 | 0,00 | 0 | |||||
| 2025-07-22 | 13F | Grimes & Company, Inc. | 8.250 | 0,00 | 430 | -0,92 | ||||
| 2025-08-15 | 13F | Manhattan West Asset Management, LLC | 6.770 | -26,38 | 353 | -27,27 | ||||
| 2025-08-13 | 13F | Northwestern Mutual Wealth Management Co | 9.451 | 493 | ||||||
| 2025-08-14 | 13F | Smartleaf Asset Management LLC | 396 | 6,45 | 21 | 5,26 | ||||
| 2025-07-21 | 13F | Patriot Financial Group Insurance Agency, LLC | 30.803 | 25,77 | 1.606 | 24,59 | ||||
| 2025-08-08 | 13F | Bailard, Inc. | 39.901 | 0,84 | 2.080 | -0,14 | ||||
| 2025-08-15 | 13F | Equitable Holdings, Inc. | 15.216 | -6,12 | 793 | -7,03 | ||||
| 2025-08-12 | 13F | LPL Financial LLC | 129.081 | 8,57 | 6.730 | 7,53 | ||||
| 2025-08-12 | 13F | Jpmorgan Chase & Co | 87.760 | -14,97 | 4.576 | -15,81 | ||||
| 2025-08-08 | 13F | Tortoise Investment Management, LLC | 3.412 | -8,08 | 178 | -9,23 | ||||
| 2025-08-08 | 13F | Wealth Alliance | 6.215 | 0,94 | 324 | 0,00 | ||||
| 2025-07-28 | 13F | Davidson Investment Advisors | 4.941 | -5,04 | 258 | -5,86 | ||||
| 2025-08-08 | 13F | Cetera Investment Advisers | 134.102 | 4,99 | 6.992 | 3,99 | ||||
| 2025-07-28 | 13F | Revolve Wealth Partners, LLC | 28.716 | 15,78 | 1.497 | 14,71 | ||||
| 2025-08-14 | 13F | Colony Group, LLC | 46.482 | 0,57 | 2.424 | -0,41 | ||||
| 2025-05-15 | 13F | MAI Capital Management | 0 | -100,00 | 0 | |||||
| 2025-08-14 | 13F | Bank Of America Corp /de/ | 645.341 | 14,39 | 33.648 | 13,29 | ||||
| 2025-08-14 | 13F | Raymond James Financial Inc | 5.171 | 29,76 | 270 | 28,71 | ||||
| 2025-07-11 | 13F | Myecfo, Llc | 130.634 | -3,26 | 6.811 | -4,19 | ||||
| 2025-08-12 | 13F | AlphaCore Capital LLC | 9.618 | 0,00 | 501 | -0,99 | ||||
| 2025-07-30 | 13F | Atlantic Edge Private Wealth Management, LLC | 2.900 | 0,00 | 151 | -0,66 | ||||
| 2025-07-23 | 13F | Proffitt & Goodson Inc | 23.234 | -21,98 | 1.211 | -22,72 | ||||
| 2025-08-08 | 13F | Empower Advisory Group, LLC | 13.987 | 26,85 | 729 | 25,69 | ||||
| 2025-08-12 | 13F | Martin Worley Group | 4.211 | 0,00 | 220 | -0,90 | ||||
| 2025-08-13 | 13F | Guggenheim Capital Llc | 4.987 | 260 | ||||||
| 2025-05-12 | 13F | Financial Engines Advisors L.L.C. | 0 | -100,00 | 0 | |||||
| 2025-07-14 | 13F | Park Avenue Securities Llc | 0 | -100,00 | 0 | |||||
| 2025-08-14 | 13F | Jane Street Group, Llc | 347.152 | 296,77 | 18.101 | 292,97 | ||||
| 2025-08-08 | 13F | Avantax Advisory Services, Inc. | 9.940 | 26,37 | 518 | 25,12 | ||||
| 2025-08-06 | 13F | Thompson Siegel & Walmsley Llc | 5.031 | 23,58 | 0 | |||||
| 2025-08-04 | 13F | WNY Asset Management, LLC | 20.709 | 11,77 | 1.080 | 10,67 | ||||
| 2025-08-14 | 13F | BCS Private Wealth Management, Inc. | 7.000 | 0 | ||||||
| 2025-07-31 | 13F | Ndwm Llc | 12.583 | 0,00 | 656 | -0,91 | ||||
| 2025-08-14 | 13F | Old Mission Capital Llc | 23.441 | 1.222 | ||||||
| 2025-08-14 | 13F | Betterment LLC | 166.364 | -1,73 | 9 | 0,00 | ||||
| 2025-08-08 | 13F | Taylor, Cottrill, Erickson & Associates, Inc. | 87.330 | -20,08 | 4.553 | -20,86 | ||||
| 2025-08-11 | 13F | Rockbridge Investment Management, LCC | 15.572 | -0,18 | 812 | -1,22 | ||||
| 2025-07-23 | 13F | Nbt Bank N A /ny | 105.220 | -0,96 | 5.486 | -1,91 | ||||
| 2025-07-09 | 13F | Breakwater Capital Group | 0 | -100,00 | 0 | |||||
| 2025-08-05 | 13F | Bank of New York Mellon Corp | 11.890 | -0,92 | 620 | -1,90 | ||||
| 2025-08-14 | 13F | Seven Mile Advisory | 3.917 | 0,00 | 204 | -0,97 | ||||
| 2025-07-29 | 13F | Calamos Wealth Management LLC | 6.683 | -51,02 | 348 | -51,53 | ||||
| 2025-07-30 | 13F | Klingman & Associates, LLC | 222.354 | -2,43 | 11.594 | -3,38 | ||||
| 2025-08-07 | 13F | Resources Investment Advisors, LLC. | 4.782 | 0,00 | 249 | -0,80 | ||||
| 2025-07-14 | 13F | Armstrong Advisory Group, Inc | 4.354 | 1,21 | 227 | -0,44 | ||||
| 2025-08-12 | 13F | Steward Partners Investment Advisory, Llc | 13.744 | -3,65 | 717 | -4,66 | ||||
| 2025-08-11 | 13F | Private Advisor Group, LLC | 13.983 | -17,93 | 729 | -18,73 | ||||
| 2025-07-17 | 13F | Astoria Strategic Wealth, Inc. | 26.675 | 8,29 | 1.391 | 7,25 | ||||
| 2025-08-11 | 13F | NewEdge Wealth, LLC | 41.946 | -8,37 | 2.184 | -9,38 | ||||
| 2025-07-22 | 13F | Miracle Mile Advisors, LLC | 317.818 | 1,09 | 16.571 | 0,11 | ||||
| 2025-07-22 | 13F | MBL Wealth, LLC | 0 | -100,00 | 0 | |||||
| 2025-07-15 | 13F | Graypoint LLC | 27.500 | 0,00 | 1.434 | -0,97 | ||||
| 2025-08-14 | 13F | Note Advisors, LLC | 54.628 | 5,25 | 2.848 | 4,25 | ||||
| 2025-08-04 | 13F | Atria Investments Llc | 5.177 | 1,13 | 270 | 0,00 | ||||
| 2025-07-29 | 13F | Chicago Partners Investment Group LLC | 19.961 | 0,08 | 1.032 | -1,06 | ||||
| 2025-07-30 | 13F | Whittier Trust Co Of Nevada Inc | 1.476 | 0,00 | 77 | -1,30 | ||||
| 2025-08-01 | 13F | Brookwood Investment Group LLC | 4.141 | 0,00 | 216 | -1,38 |