Grundlæggende statistik
| Institutionelle aktier (lange) | 117.984.950 - 102,62% (ex 13D/G) - change of -3,13MM shares -2,58% MRQ |
| Institutionel værdi (lang) | $ 3.992.594 USD ($1000) |
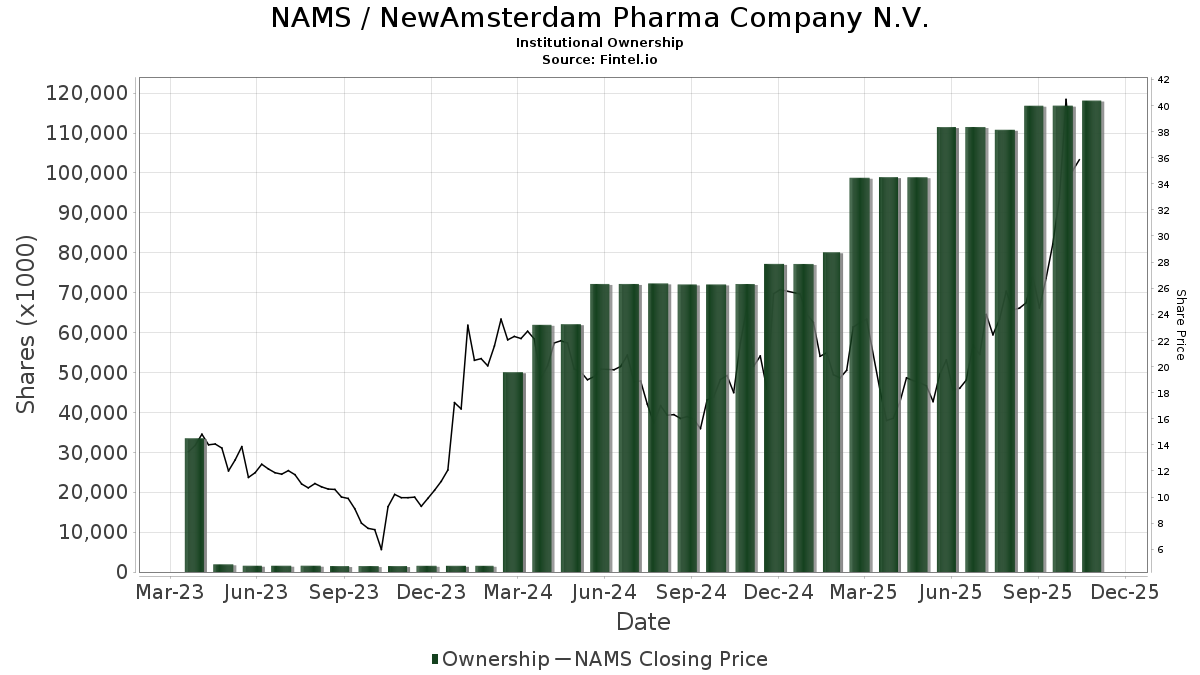
Institutionelt ejerskab og aktionærer
NewAmsterdam Pharma Company N.V. (US:NAMS) har 197 institutionelle ejere og aktionærer, der har indsendt 13D/G- eller 13F-formularer til Securities Exchange Commission (SEC). Disse institutioner har i alt 117,984,950 aktier. Største aktionærer omfatter Frazier Life Sciences Management, L.P., Capital World Investors, Ra Capital Management, L.p., Fcpm Iii Services B.v., Bain Capital Life Sciences Investors, LLC, Fmr Llc, Wellington Management Group Llp, Viking Global Investors Lp, Deerfield Management Company, L.p. (series C), and Jennison Associates Llc .
NewAmsterdam Pharma Company N.V. (NasdaqGM:NAMS) institutionel ejerskabsstruktur viser aktuelle positioner i virksomheden efter institutioner og fonde, samt seneste ændringer i positionsstørrelse. Større aktionærer kan omfatte individuelle investorer, investeringsforeninger, hedgefonde eller institutioner. Skema 13D angiver, at investoren besidder (eller besidder) mere end 5 % af virksomheden og har til hensigt (eller har til hensigt at) aktivt at forfølge en ændring i forretningsstrategi. Skema 13G indikerer en passiv investering på over 5%.
The share price as of March 17, 2026 is 30,60 / share. Previously, on March 18, 2025, the share price was 23,67 / share. This represents an increase of 29,28% over that period.
Fondens stemningsscore
Fund Sentiment Score (fka Ownership Accumulation Score) finder de aktier, der bliver mest købt af fonde. Det er resultatet af en sofistikeret, multi-faktor kvantitativ model, der identificerer virksomheder med de højeste niveauer af institutionel akkumulering. Scoringsmodellen bruger en kombination af den samlede stigning i oplyste ejere, ændringerne i porteføljeallokeringer i disse ejere og andre målinger. Tallet går fra 0 til 100, hvor højere tal indikerer et højere niveau af akkumulering for sine jævnaldrende, og 50 er gennemsnittet.
Opdateringsfrekvens: Dagligt
Se Ownership Explorer, som giver en liste over højest rangerende virksomheder.
AI+ Ask Fintel’s AI assistant about NewAmsterdam Pharma Company N.V..
Select a question to share a public post with an AI-crafted answer.
Thinking of good questions…
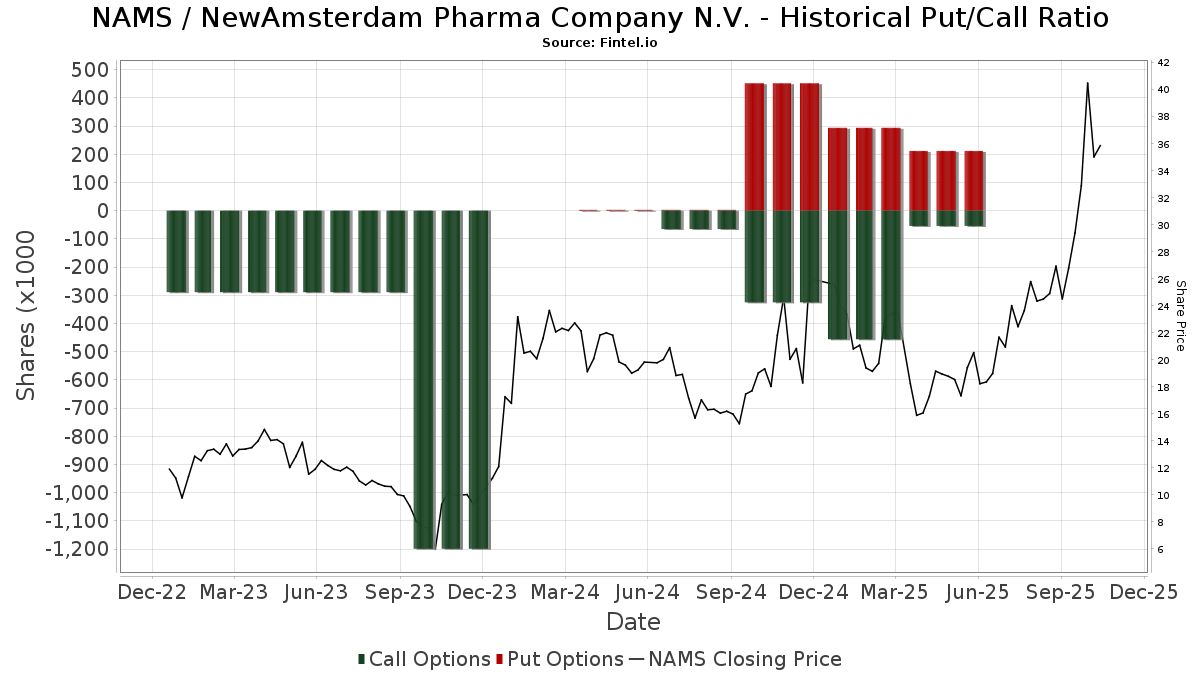
Institutionel Put/Call-forhold
Ud over at indberette standardaktie- og gældsudstedelser skal institutter med mere end 100 mill. aktiver under forvaltning også oplyse deres put- og call-optionsbeholdninger. Da salgsoptioner generelt indikerer negativ stemning, og købsoptioner indikerer positiv stemning, kan vi få en fornemmelse af den overordnede institutionelle stemning ved at plotte forholdet mellem put og kald. Diagrammet til højre viser det historiske put/call-forhold for dette instrument.
Brug af Put/Call Ratio som en indikator for investorernes stemning overvinder en af de vigtigste mangler ved at bruge totalt institutionelt ejerskab, som er, at en betydelig mængde af aktiver under forvaltning investeres passivt for at spore indekser. Passivt forvaltede fonde køber typisk ikke optioner, så indikatoren for put/call-forholdet følger mere nøje følelsen af aktivt forvaltede fonde.
13D/G-arkivering
Vi præsenterer 13D/G ansøgninger separat fra 13F ansøgninger på grund af den forskellige behandling af SEC. 13D/G-ansøgninger kan indgives af grupper af investorer (med én ledende), hvorimod 13F-ansøgninger ikke kan. Dette resulterer i situationer, hvor en investor kan indsende en 13D/G, der rapporterer én værdi for de samlede aktier (der repræsenterer alle de aktier, der ejes af investorgruppen), men derefter indsender en 13F, der rapporterer en anden værdi for de samlede aktier (der udelukkende repræsenterer deres egne) ejendomsret). Det betyder, at aktieejerskab af 13D/G-arkiver og 13F-arkiveringer ofte ikke er direkte sammenlignelige, så vi præsenterer dem separat.
Bemærk: Fra den 16. maj 2021 viser vi ikke længere ejere, der ikke har indsendt en 13D/G inden for det seneste år. Tidligere viste vi den fulde historie af 13D/G-arkiver. Generelt skal enheder, der er forpligtet til at indgive 13D/G-ansøgninger, indgive mindst årligt, før de indsender en afsluttende ansøgning. Dog forlader fonde nogle gange positioner uden at indsende en afsluttende ansøgning (dvs. de afvikler), så visning af den fulde historie resulterede nogle gange i forvirring om det nuværende ejerskab. For at undgå forvirring viser vi nu kun 'aktuelle' ejere - det vil sige - ejere, der har anmeldt inden for det seneste år.
Upgrade to unlock premium data.
| Fil dato | Form | Investor | Forrige Aktier |
Seneste Aktier |
Δ Aktier (Procent) |
Ejendomsret (Procent) |
Δ Ejerskab (Procent) |
|
|---|---|---|---|---|---|---|---|---|
| 2026-02-17 | VIKING GLOBAL INVESTORS LP | 6,978,534 | 4,203,567 | -39.76 | 3.70 | -43.08 | ||
| 2026-02-05 | FMR LLC | 6,412,984 | 5.70 | |||||
| 2025-12-04 | BCLS Fund III Investments, LP | 11,422,504 | 5,376,356 | -52.93 | 4.70 | -52.95 | ||
| 2025-11-13 | Capital World Investors | 8,387,725 | 9,822,711 | 17.11 | 8.70 | 16.00 | ||
| 2025-11-04 | Frazier Life Sciences X, L.P. | 7,327,937 | 8,623,939 | 17.69 | 7.70 | 18.46 | ||
| 2025-09-30 | Forbion Capital Fund IV Cooperatief U.A. | 10,578,806 | 9,316,914 | -11.93 | 8.30 | -11.70 | ||
| 2025-05-15 | RA CAPITAL MANAGEMENT, L.P. | 10,875,454 | 11,063,125 | 1.73 | 9.90 | 0.00 |
13F og NPORT arkivering
Detaljer om 13F-arkivering er gratis. Detaljer om NP-ansøgninger kræver et premium-medlemskab. Grønne rækker angiver nye positioner. Røde rækker angiver lukkede positioner. Klik på linket ikon for at se den fulde transaktionshistorik.
Opgrader
for at låse premium-data op og eksportere til Excel ![]() .
.
| Fil dato | Kilde | Investor | Type | Gennemsnitlig pris (Øst) |
Aktier | Δ Aktier (%) |
Rapporteret Værdi ($1000) |
Δ Værdi (%) |
Port Alloc (%) |
|
|---|---|---|---|---|---|---|---|---|---|---|
| 2026-02-17 | 13F | Fcpm Iii Services B.v. | 9.198.900 | -0,15 | 322.697 | 23,17 | ||||
| 2026-02-11 | 13F | Deutsche Bank Ag\ | 123.963 | 81,17 | 4.349 | 123,43 | ||||
| 2026-02-12 | 13F | Swiss National Bank | 88.900 | 2,07 | 3.119 | 25,88 | ||||
| 2026-02-17 | 13F | Twinbeech Capital Lp | 27.400 | 961 | ||||||
| 2026-02-17 | 13F | Ameriprise Financial Inc | 152.269 | 4,78 | 5.342 | 29,23 | ||||
| 2026-02-13 | 13F | Kennedy Capital Management, Inc. | 172.931 | 17,87 | 6.066 | 45,40 | ||||
| 2026-02-13 | 13F | Verition Fund Management LLC | 32.391 | 134,24 | 1.136 | 189,06 | ||||
| 2026-02-13 | 13F | Morgan Stanley | 532.803 | -64,42 | 18.691 | -56,11 | ||||
| 2026-02-13 | 13F | American Century Companies Inc | 603.401 | -3,35 | 21.167 | 19,22 | ||||
| 2026-02-17 | 13F | Ishara Investments LP | 30.000 | 1.052 | ||||||
| 2026-01-30 | 13F | Rachor Investment Advisory Services, LLC | 28 | 1 | ||||||
| 2026-02-12 | 13F | BlackRock, Inc. | 849.779 | 36,51 | 29.810 | 68,38 | ||||
| 2026-02-17 | 13F | Holocene Advisors, LP | 20.459 | 718 | ||||||
| 2026-02-13 | 13F | Wells Fargo & Company/mn | 900 | 50,00 | 32 | 82,35 | ||||
| 2026-02-10 | 13F | Td Asset Management Inc | 13.180 | -26,78 | 462 | -9,59 | ||||
| 2026-02-17 | 13F | Millennium Management Llc | 254.596 | 8.931 | ||||||
| 2026-02-11 | 13F | Allianz Asset Management GmbH | 6.600 | 232 | ||||||
| 2026-02-17 | 13F | Readystate Asset Management Lp | 0 | -100,00 | 0 | |||||
| 2026-02-11 | 13F | Winton Capital Group Ltd | 28.665 | 1.006 | ||||||
| 2026-02-12 | 13F | Polen Capital Management Llc | 11.239 | 394 | ||||||
| 2026-02-17 | 13F | XTX Topco Ltd | 137.492 | 1.714,12 | 4.823 | 2.143,26 | ||||
| 2026-02-17 | 13F | Creative Planning | 15.637 | 549 | ||||||
| 2026-02-13 | 13F | Nicholas Investment Partners, LP | 213.419 | 20,21 | 7.487 | 48,27 | ||||
| 2026-02-17 | 13F | Ra Capital Management, L.p. | 9.550.191 | -5,81 | 335.021 | 16,18 | ||||
| 2026-02-10 | 13F | Envestnet Asset Management Inc | 17.572 | 616 | ||||||
| 2026-02-11 | 13F | Group One Trading, L.p. | 1.313 | 19,69 | 46 | 48,39 | ||||
| 2025-11-14 | 13F | Strategic Wealth Partners, Ltd. | 975 | 28 | ||||||
| 2026-02-12 | 13F | Decheng Capital LLC | 592.057 | -9,89 | 20.769 | 11,15 | ||||
| 2026-02-06 | 13F | Handelsbanken Fonder AB | 415.800 | 2,46 | 15 | 27,27 | ||||
| 2026-01-13 | 13F | Mather Group, Llc. | 0 | -100,00 | 0 | -100,00 | ||||
| 2026-02-17 | 13F | Russell Investments Group, Ltd. | 71.282 | 2.501 | ||||||
| 2026-01-29 | 13F | UBS Group AG | 899.442 | 17,04 | 31.552 | 44,36 | ||||
| 2026-02-17 | 13F | Bain Capital Life Sciences Investors, LLC | 7.306.566 | -31,84 | 256.314 | -15,92 | ||||
| 2026-02-11 | 13F | Fox Run Management, L.l.c. | 9.798 | 344 | ||||||
| 2026-02-17 | 13F | Caption Management, LLC | Call | 0 | -100,00 | 0 | ||||
| 2026-02-17 | 13F | Jones Financial Companies Lllp | 199 | -20,08 | 7 | -14,29 | ||||
| 2026-02-17 | 13F | Eversept Partners, LP | 420.827 | -13,87 | 14.763 | 6,24 | ||||
| 2026-02-05 | 13F | Navalign, LLC | 1.315 | 46 | ||||||
| 2025-09-24 | NP | PPNMX - SmallCap Growth Fund I R-3 | 167.574 | 9,52 | 3.655 | 24,84 | ||||
| 2026-02-17 | 13F | StemPoint Capital LP | 73.106 | -51,45 | 2.565 | -40,12 | ||||
| 2026-02-12 | 13F | Ensign Peak Advisors, Inc | 549.511 | 19.277 | ||||||
| 2026-02-13 | 13F | SRS Capital Advisors, Inc. | 0 | -100,00 | 0 | |||||
| 2025-11-14 | 13F | Algert Global Llc | 0 | -100,00 | 0 | |||||
| 2026-02-11 | 13F | Simplex Trading, Llc | 0 | -100,00 | 0 | |||||
| 2026-02-17 | 13F | Guggenheim Capital Llc | 6.388 | 224 | ||||||
| 2026-02-17 | 13F | Northern Trust Corp | 32.137 | -3,49 | 1.127 | 19,01 | ||||
| 2026-02-13 | 13F | First Trust Advisors Lp | 279.701 | 9.812 | ||||||
| 2026-01-23 | 13F | Medicxi Ventures Management (Jersey) Ltd | 2.869.565 | 0,00 | 100.664 | 23,35 | ||||
| 2026-01-14 | 13F | Yarbrough Capital, LLC | 23.960 | 0,00 | 841 | 23,35 | ||||
| 2026-01-27 | 13F | Zurcher Kantonalbank (Zurich Cantonalbank) | 19.804 | 695 | ||||||
| 2026-02-13 | 13F | Manufacturers Life Insurance Company, The | 0 | -100,00 | 0 | |||||
| 2026-02-09 | 13F | Geode Capital Management, Llc | 102.395 | 0,43 | 3.590 | 23,92 | ||||
| 2026-01-30 | 13F | Us Bancorp \de\ | 3.419 | 2.432,59 | 120 | 3.866,67 | ||||
| 2026-02-06 | 13F | Mizuho Markets Cayman LP | 47.879 | 1.680 | ||||||
| 2026-02-17 | 13F | Glenmede Trust Co Na | 22.215 | 779 | ||||||
| 2026-02-17 | 13F | California State Teachers Retirement System | 40.276 | -15,85 | 1.413 | 3,75 | ||||
| 2026-01-29 | 13F | Vanguard Group Inc | 172.956 | 0,28 | 6.067 | 23,72 | ||||
| 2026-02-06 | 13F | Pnc Financial Services Group, Inc. | 3.682 | 1,83 | 129 | 26,47 | ||||
| 2026-01-30 | 13F | Jennison Associates Llc | 3.489.221 | -16,89 | 122.402 | 2,51 | ||||
| 2025-09-24 | NP | AACRX - Strategic Allocation: Conservative Fund R Class This fund is a listed as child fund of American Century Companies Inc and if that institution has disclosed ownership in this security, then these positions will not be double counted when calculating total shares and total value | 176 | 0,00 | 4 | 0,00 | ||||
| 2025-09-24 | NP | TWSMX - Strategic Allocation: Moderate Fund Investor Class This fund is a listed as child fund of American Century Companies Inc and if that institution has disclosed ownership in this security, then these positions will not be double counted when calculating total shares and total value | 757 | 0,00 | 17 | 14,29 | ||||
| 2026-02-13 | 13F/A | Virtus ETF Advisers LLC | 0 | -100,00 | 0 | |||||
| 2026-02-12 | 13F | AlphaCentric Advisors LLC | 13.731 | 482 | ||||||
| 2026-02-12 | 13F | New York State Common Retirement Fund | 26.680 | 0,00 | 936 | 23,35 | ||||
| 2026-02-06 | 13F | EverSource Wealth Advisors, LLC | 8 | 0,00 | 0 | |||||
| 2026-02-10 | 13F | Bnp Paribas Arbitrage, Sa | 25.134 | -8,03 | 882 | 13,38 | ||||
| 2026-02-17 | 13F | Polar Capital Holdings Plc | 2.776.222 | -4,65 | 97.390 | 17,61 | ||||
| 2026-02-17 | 13F | Bellevue Group AG | 36.336 | 148,69 | 1.275 | 206,99 | ||||
| 2026-02-17 | 13F | Adage Capital Partners Gp, L.l.c. | 1.406.631 | -45,41 | 49.345 | -32,66 | ||||
| 2026-02-10 | 13F | Goldman Sachs Group Inc | 1.725.662 | 95,98 | 60.536 | 141,74 | ||||
| 2026-02-13 | 13F | Ubs Asset Management Americas Inc | 265.199 | 9.303 | ||||||
| 2025-11-14 | 13F | Hrt Financial Lp | 0 | -100,00 | 0 | |||||
| 2026-02-10 | 13F | Daiwa Securities Group Inc. | 335 | -10,67 | 0 | |||||
| 2026-02-11 | 13F | DCF Advisers, LLC | 160.600 | 5.634 | ||||||
| 2025-09-29 | NP | GURU - Global X Guru Index ETF This fund is a listed as child fund of Mirae Asset Global Investments Co., Ltd. and if that institution has disclosed ownership in this security, then these positions will not be double counted when calculating total shares and total value | 32.477 | 10,27 | 708 | 25,75 | ||||
| 2026-02-13 | 13F | Centiva Capital, LP | 80.000 | 2.806 | ||||||
| 2026-02-10 | 13F | Bank of New York Mellon Corp | 391.827 | 17,67 | 13.745 | 45,14 | ||||
| 2026-01-23 | 13F | Farther Finance Advisors, LLC | 724 | 4.425,00 | 25 | |||||
| 2026-02-12 | 13F | Jane Street Group, Llc | Call | 64.900 | 2.277 | |||||
| 2026-02-11 | 13F | Capital World Investors | 9.984.000 | 1,64 | 350.239 | 25,37 | ||||
| 2026-01-20 | 13F | Thurston, Springer, Miller, Herd & Titak, Inc. | 1.067 | 0,00 | 37 | 23,33 | ||||
| 2026-02-12 | 13F | Jane Street Group, Llc | Put | 77.900 | 7,60 | 2.733 | 32,69 | |||
| 2026-02-12 | 13F | Jane Street Group, Llc | 421.491 | 14.786 | ||||||
| 2025-11-04 | 13F | Marshall Financial Group Inc /adv | 7.500 | 213 | ||||||
| 2026-01-28 | 13F | Teacher Retirement System Of Texas | 6.687 | -37,99 | 235 | -23,53 | ||||
| 2025-11-14 | 13F | Prelude Capital Management, Llc | 0 | -100,00 | 0 | -100,00 | ||||
| 2026-01-16 | 13F | Standard Life Aberdeen plc | 729.484 | 10,20 | 25.590 | 35,94 | ||||
| 2026-01-21 | 13F | SJS Investment Consulting Inc. | 85 | 3 | ||||||
| 2026-02-10 | 13F | SBI Okasan Asset Management Co.Ltd. | 14.900 | 522 | ||||||
| 2026-02-12 | 13F | Bank Of Montreal /can/ | 0 | -100,00 | 0 | |||||
| 2026-02-17 | 13F | MIRAE ASSET GLOBAL ETFS HOLDINGS Ltd. | 18.570 | -28,40 | 651 | -11,67 | ||||
| 2026-02-06 | 13F | TimesSquare Capital Management, LLC | 822.300 | -1,80 | 28.846 | 21,13 | ||||
| 2025-11-14 | 13F | Exome Asset Management LLC | 0 | -100,00 | 0 | |||||
| 2026-02-06 | 13F | PSP Research LLC | 14.920 | 523 | ||||||
| 2026-02-13 | 13F | BNP Paribas Asset Management Holding S.A. | 177.016 | 6 | ||||||
| 2026-02-17 | 13F | Castle Hook Partners LP | 1.085.008 | 38.062 | ||||||
| 2026-01-09 | 13F | Ptm Wealth Management, Llc | 12.900 | 0,00 | 432 | 3,11 | ||||
| 2026-02-17 | 13F | Bank Of America Corp /de/ | 459.391 | -2,69 | 16.115 | 20,03 | ||||
| 2026-02-17 | 13F | Rock Springs Capital Management LP | Call | 31.600 | 0,00 | 1.109 | 23,39 | |||
| 2026-02-17 | 13F | Boothbay Fund Management, Llc | 33.919 | -16,69 | 1.190 | 2,77 | ||||
| 2026-02-06 | 13F | HealthInvest Partners AB | 197.036 | 1,76 | 6.912 | 1.083,56 | ||||
| 2026-02-05 | 13F | DnB Asset Management AS | 20.119 | 706 | ||||||
| 2026-02-10 | 13F | Quantbot Technologies LP | 3.692 | 130 | ||||||
| 2026-02-17 | 13F | Slate Path Capital LP | 319.000 | 0,00 | 11.191 | 23,35 | ||||
| 2026-02-17 | 13F | Rock Springs Capital Management LP | 557.194 | -6,50 | 19.546 | 15,33 | ||||
| 2026-02-17 | 13F | Integral Health Asset Management, LLC | Put | 0 | -100,00 | 0 | -100,00 | |||
| 2026-01-30 | 13F | Moody Aldrich Partners Llc | 143.549 | 5.036 | ||||||
| 2026-02-17 | 13F | Tower Research Capital LLC (TRC) | 943 | -68,27 | 33 | -60,71 | ||||
| 2026-02-09 | 13F | Legal & General Group Plc | 40.951 | -10,47 | 1.437 | 10,46 | ||||
| 2026-01-15 | 13F | Jaffetilchin Investment Partners, LLC | 9.218 | 323 | ||||||
| 2026-02-13 | 13F | Citigroup Inc | 3.698 | -27,52 | 130 | -11,03 | ||||
| 2026-02-09 | 13F/A | Swedbank AB | 90.900 | 3.189 | ||||||
| 2025-10-27 | 13F | Kiker Wealth Management, LLC | 0 | -100,00 | 0 | |||||
| 2026-02-17 | 13F | Deerfield Management Company, L.p. (series C) | 4.164.789 | -2,39 | 146.101 | 20,40 | ||||
| 2026-02-17 | 13F | State Of Wisconsin Investment Board | 19.997 | 701 | ||||||
| 2026-02-17 | 13F | Ikarian Capital, LLC | 45.830 | -57,09 | 1.608 | -47,09 | ||||
| 2026-02-11 | 13F | Empowered Funds, LLC | 2.428 | 85 | ||||||
| 2026-02-17 | 13F | Woodline Partners LP | 751.270 | -35,12 | 26.355 | -19,97 | ||||
| 2026-01-28 | 13F | Arizona State Retirement System | 12.733 | -3,91 | 447 | 18,62 | ||||
| 2026-02-17 | 13F | Caption Management, LLC | 9.528 | 334 | ||||||
| 2026-02-17 | 13F | Caption Management, LLC | Put | 75.000 | -93,59 | 2.631 | -92,09 | |||
| 2026-02-17 | 13F | Persistent Asset Partners Ltd | 3.948 | 138 | ||||||
| 2025-11-14 | 13F | Axa S.a. | 0 | -100,00 | 0 | |||||
| 2026-02-17 | 13F | Wellington Management Group Llp | 5.033.175 | 25,20 | 176.564 | 54,43 | ||||
| 2026-02-03 | 13F | Cheviot Value Management, LLC | 796 | 0,00 | 25 | -10,71 | ||||
| 2026-01-29 | 13F | Simon Quick Advisors, Llc | 5.763 | 202 | ||||||
| 2026-02-13 | 13F | Barclays Plc | 5.652 | -1,15 | 198 | 22,22 | ||||
| 2026-02-26 | 13F | Seven Fleet Capital Management LP | 4.000 | 140 | ||||||
| 2026-02-13 | 13F | First Turn Management, LLC | 893.473 | 24,62 | 31.343 | 53,72 | ||||
| 2026-02-17 | 13F | Fred Alger Management, Llc | 47.535 | 15,20 | 1.668 | 42,11 | ||||
| 2026-02-13 | 13F | Sei Investments Co | 41.040 | 337,43 | 1.440 | 499,58 | ||||
| 2026-02-17 | 13F | Logos Global Management LP | 450.000 | 15.786 | ||||||
| 2026-02-19 | 13F | Invesco Ltd. | 5.961 | -94,31 | 209 | -92,98 | ||||
| 2026-02-17 | 13F | Citadel Advisors Llc | Call | 55.000 | 23,87 | 1.929 | 52,85 | |||
| 2026-02-17 | 13F | Citadel Advisors Llc | 635.247 | 207,68 | 22.284 | 279,56 | ||||
| 2026-02-13 | 13F | State Street Corp | 68.523 | 7,39 | 2.404 | 32,47 | ||||
| 2026-02-17 | 13F | Citadel Advisors Llc | Put | 59.300 | 73,39 | 2.080 | 113,99 | |||
| 2026-01-05 | 13F | GAMMA Investing LLC | 10 | 0 | ||||||
| 2026-02-02 | 13F | Wolverine Asset Management Llc | 2.012 | -17,17 | 71 | 1,45 | ||||
| 2026-02-13 | 13F | Lord, Abbett & Co. Llc | 200.638 | 7 | ||||||
| 2026-01-12 | 13F | Avanza Fonder AB | 6.566 | -12,51 | 230 | 7,98 | ||||
| 2026-02-17 | 13F | DZ BANK AG Deutsche Zentral Genossenschafts Bank, Frankfurt am Main | 63.302 | 2.221 | ||||||
| 2026-02-04 | 13F | Virginia Retirement Systems Et Al | 7.200 | 253 | ||||||
| 2026-02-17 | 13F | Artia Global Partners LP | 503.936 | 158,64 | 17.678 | 219,04 | ||||
| 2026-02-17 | 13F | Janus Henderson Group Plc | 2.341.723 | 10,61 | 82.300 | 36,83 | ||||
| 2026-02-13 | 13F | Squarepoint Ops LLC | 30.819 | 47,04 | 1.081 | 81,38 | ||||
| 2026-02-05 | 13F | Mesirow Financial Investment Management, Inc. | 8.215 | 0,00 | 288 | 23,61 | ||||
| 2026-02-17 | 13F | Royal Bank Of Canada | 24.084 | -9,12 | 846 | 12,20 | ||||
| 2026-01-05 | 13F | Roxbury Financial LLC | 443 | 36,73 | 16 | 66,67 | ||||
| 2026-02-12 | 13F | Voya Investment Management Llc | 28.875 | 49,61 | 1.013 | 84,67 | ||||
| 2026-01-26 | 13F | Mirae Asset Global Investments Co., Ltd. | 5.510 | 26,55 | 193 | 56,91 | ||||
| 2026-02-10 | 13F | JTC Employer Solutions Trusteee Ltd | 75.500 | 3 | ||||||
| 2026-02-13 | 13F | Greenline Wealth Management LLC | 233 | 8 | ||||||
| 2026-02-17 | 13F | Fmr Llc | 6.412.984 | 15,86 | 224.967 | 42,91 | ||||
| 2026-02-17 | 13F | Jain Global LLC | 47.584 | 1.669 | ||||||
| 2026-02-17 | 13F | Alliancebernstein L.p. | 1.300.875 | -39,26 | 45.635 | -25,08 | ||||
| 2026-02-11 | 13F | Franklin Resources Inc | 769.120 | 89,52 | 26.981 | 133,78 | ||||
| 2025-11-14 | 13F | Raymond James Financial Inc | 0 | -100,00 | 0 | |||||
| 2025-11-14 | 13F | AXA Investment Managers S.A. | 196.782 | 5.596 | ||||||
| 2026-02-11 | 13F | Letko, Brosseau & Associates Inc | 11.775 | 0,00 | 413 | 23,65 | ||||
| 2026-02-17 | 13F | Aquatic Capital Management LLC | 45.989 | 1.613 | ||||||
| 2026-01-30 | 13F | Keybank National Association/oh | 13.099 | -18,20 | 460 | 0,88 | ||||
| 2026-02-17 | 13F | Saturn V Capital Management LLC | 0 | -100,00 | 0 | |||||
| 2025-11-12 | 13F | CIBC Bancorp USA Inc. | 31.140 | 886 | ||||||
| 2026-01-29 | 13F | Nbc Securities, Inc. | 2.457 | 86 | ||||||
| 2026-02-13 | 13F | Maverick Capital Ltd | 1.894.226 | 25,88 | 66.449 | 55,27 | ||||
| 2026-02-13 | 13F | Quarry LP | 3.000 | -56,36 | 105 | -46,15 | ||||
| 2026-02-17 | 13F | Viking Global Investors Lp | 4.203.567 | -35,09 | 147.461 | -19,93 | ||||
| 2026-02-17 | 13F | Virtus Investment Advisers, Inc. | 7.142 | 31,99 | 251 | 63,40 | ||||
| 2026-01-26 | 13F | Dupont Capital Management Corp | 1 | 0,00 | 0 | |||||
| 2026-02-09 | 13F | Lisanti Capital Growth, LLC | 179.410 | 278,14 | 6.294 | 366,49 | ||||
| 2026-01-14 | 13F | Eastern Bank | 187 | 7 | ||||||
| 2026-02-11 | 13F | Capital International Investors | 2.062.535 | 0,00 | 72.354 | 23,35 | ||||
| 2026-02-13 | 13F | Frazier Life Sciences Management, L.P. | 16.943.774 | 1,45 | 594.388 | 25,13 | ||||
| 2025-09-24 | NP | ANONX - Small Cap Growth Fund I Class This fund is a listed as child fund of American Century Companies Inc and if that institution has disclosed ownership in this security, then these positions will not be double counted when calculating total shares and total value | 453.541 | 0,00 | 9.892 | 14,00 | ||||
| 2026-02-17 | 13F | Advisor Group Holdings, Inc. | 10 | 0 | ||||||
| 2026-01-08 | 13F | True Wealth Design, LLC | 21 | 0,00 | 1 | |||||
| 2025-09-29 | NP | KCSIX - Knights of Columbus Small Cap Fund I Shares | 29.644 | 647 | ||||||
| 2026-02-06 | 13F | Global Retirement Partners, LLC | 270 | 9 | ||||||
| 2026-02-20 | 13F | Sunbelt Securities, Inc. | 8 | 0,00 | 0 | |||||
| 2026-02-13 | 13F | Kilter Group LLC | 9 | -10,00 | 0 | |||||
| 2026-02-17 | 13F | Susquehanna International Group, Llp | Call | 118.300 | 4.150 | |||||
| 2026-02-17 | 13F | Price T Rowe Associates Inc /md/ | 116.258 | -15,96 | 4 | 33,33 | ||||
| 2026-02-17 | 13F | Cormorant Asset Management, LP | 0 | -100,00 | 0 | |||||
| 2026-02-17 | 13F | Susquehanna International Group, Llp | 195.635 | 28,85 | 6.863 | 58,92 | ||||
| 2026-02-17 | 13F | Susquehanna International Group, Llp | Put | 201.300 | 46,08 | 7.062 | 80,17 | |||
| 2026-01-28 | 13F | Klp Kapitalforvaltning As | 9.100 | 0,00 | 319 | 23,64 | ||||
| 2026-02-13 | 13F | Toroso Investments, LLC | Call | 2.400 | 84 | |||||
| 2026-02-11 | 13F | Parallel Advisors, LLC | 1.400 | 0,00 | 49 | 25,64 | ||||
| 2026-01-29 | 13F | Pictet Asset Management Holding SA | 746.122 | -42,26 | 26.174 | -28,78 | ||||
| 2026-02-13 | 13F | OMERS ADMINISTRATION Corp | 0 | -100,00 | 0 | |||||
| 2025-12-15 | 13F/A | Hudson Bay Capital Management LP | 0 | -100,00 | 0 | -100,00 | ||||
| 2025-11-14 | 13F | Two Sigma Investments, Lp | 0 | -100,00 | 0 | |||||
| 2026-02-17 | 13F | ADAR1 Capital Management, LLC | 118.623 | 3,73 | 4.161 | 27,95 | ||||
| 2026-01-29 | 13F | China Universal Asset Management Co., Ltd. | 26.477 | 34,12 | 929 | 65,42 | ||||
| 2026-02-06 | 13F | IFP Advisors, Inc | 3 | 0,00 | 0 | |||||
| 2025-12-15 | 13F/A | Hudson Bay Capital Management LP | Put | 0 | -100,00 | 0 | -100,00 | |||
| 2026-02-12 | 13F | Alps Advisors Inc | 92.902 | 3.259 | ||||||
| 2026-02-17 | 13F | HighVista Strategies LLC | 35.586 | 11,80 | 1.248 | 37,90 | ||||
| 2026-02-13 | 13F | National Bank Of Canada /fi/ | 2.017 | 3,49 | 71 | 27,27 | ||||
| 2026-03-12 | 13F/A | Peak6 Llc | 20.749 | 728 | ||||||
| 2026-01-30 | 13F | State of New Jersey Common Pension Fund D | 15.377 | 539 | ||||||
| 2026-01-21 | 13F | Stone House Investment Management, LLC | 325 | 0,00 | 11 | 22,22 | ||||
| 2026-01-20 | 13F | Signaturefd, Llc | 647 | 0,00 | 23 | 22,22 | ||||
| 2026-02-13 | 13F | Walleye Capital LLC | 96.261 | 3.377 | ||||||
| 2026-02-12 | 13F | CIBC Private Wealth Group, LLC | 7.240 | -5,24 | 254 | 16,59 | ||||
| 2026-02-17 | 13F | Aqr Capital Management Llc | 10.282 | 0,84 | 361 | 24,57 | ||||
| 2025-09-24 | NP | AAARX - Strategic Allocation: Aggressive Fund R Class This fund is a listed as child fund of American Century Companies Inc and if that institution has disclosed ownership in this security, then these positions will not be double counted when calculating total shares and total value | 911 | 0,00 | 20 | 11,76 | ||||
| 2025-09-29 | NP | KCXIX - Knights of Columbus U.S. All Cap Index Fund I Shares | 337 | 7,32 | 7 | 16,67 | ||||
| 2026-02-17 | 13F | ArrowMark Colorado Holdings LLC | 298.077 | -4,15 | 10.457 | 18,23 | ||||
| 2026-01-14 | 13F | ORG Partners LLC | 60 | 2 | ||||||
| 2026-02-11 | 13F | CenterBook Partners LP | 12.060 | 423 | ||||||
| 2026-02-12 | 13F | Brinker Capital Investments, LLC | 6.545 | 230 | ||||||
| 2026-01-27 | 13F | Gf Fund Management Co. Ltd. | 2.228 | -8,05 | 78 | 14,71 | ||||
| 2026-02-06 | 13F | Legato Capital Management LLC | 83.833 | 258,72 | 2.941 | 342,77 | ||||
| 2026-01-26 | 13F | Cwm, Llc | 981 | 0,20 | 0 | |||||
| 2026-02-11 | 13F | Jpmorgan Chase & Co | 999.976 | -23,23 | 35.079 | -5,30 | ||||
| 2026-02-13 | 13F | Siren, L.L.C. | 0 | -100,00 | 0 | |||||
| 2026-02-17 | 13F | Duquesne Family Office LLC | 3.070.146 | 59,60 | 108 | 98,15 | ||||
| 2026-02-10 | 13F | State of Wyoming | 601 | 3,62 | 21 | 31,25 | ||||
| 2026-02-10 | 13F | Nomura Asset Management Co Ltd | 0 | 0 | ||||||
| 2026-03-03 | 13F/A | Caitong International Asset Management Co., Ltd | 23 | 1 | ||||||
| 2026-02-09 | 13F | Jefferies Financial Group Inc. | 12.000 | 0,00 | 421 | 23,17 | ||||
| 2026-02-13 | 13F | Affinity Asset Advisors, LLC | 275.000 | 0,00 | 9.647 | 23,35 | ||||
| 2026-02-09 | 13F | Hartland & Co., LLC | 0 | -100,00 | 0 | |||||
| 2026-02-09 | 13F | Knights of Columbus Asset Advisors LLC | 32.483 | -3,35 | 1.140 | 19,27 | ||||
| 2026-02-17 | 13F | Gilder Gagnon Howe & Co Llc | 248.528 | 583,07 | 8.718 | 743,13 |
Other Listings
| DE:KH6 | 24,20 € |