Grundlæggende statistik
| Institutionelle ejere | 108 total, 108 long only, 0 short only, 0 long/short - change of -5,26% MRQ |
| Gennemsnitlig porteføljeallokering | 0.1218 % - change of -51,37% MRQ |
| Institutionelle aktier (lange) | 19.032.704 (ex 13D/G) - change of -2,87MM shares -13,12% MRQ |
| Institutionel værdi (lang) | $ 197.904 USD ($1000) |
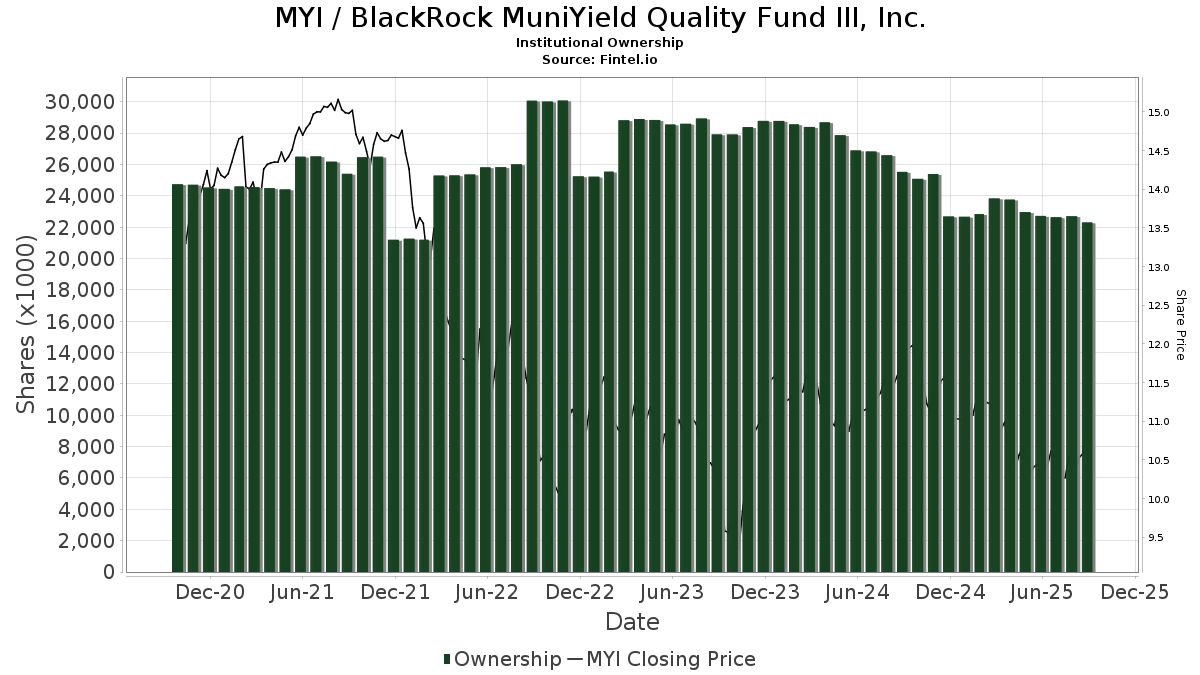
Institutionelt ejerskab og aktionærer
BlackRock MuniYield Quality Fund III, Inc. (US:MYI) har 108 institutionelle ejere og aktionærer, der har indsendt 13D/G- eller 13F-formularer til Securities Exchange Commission (SEC). Disse institutioner har i alt 19,032,704 aktier. Største aktionærer omfatter Morgan Stanley, Rivernorth Capital Management, Llc, Hennion & Walsh Asset Management, Inc., Guggenheim Capital Llc, Stifel Financial Corp, Raymond James Financial Inc, Bank Of America Corp /de/, UBS Group AG, Robinson Capital Management, Llc, and Advisors Asset Management, Inc. .
BlackRock MuniYield Quality Fund III, Inc. (NYSE:MYI) institutionel ejerskabsstruktur viser aktuelle positioner i virksomheden efter institutioner og fonde, samt seneste ændringer i positionsstørrelse. Større aktionærer kan omfatte individuelle investorer, investeringsforeninger, hedgefonde eller institutioner. Skema 13D angiver, at investoren besidder (eller besidder) mere end 5 % af virksomheden og har til hensigt (eller har til hensigt at) aktivt at forfølge en ændring i forretningsstrategi. Skema 13G indikerer en passiv investering på over 5%.
The share price as of March 13, 2026 is 10,89 / share. Previously, on March 17, 2025, the share price was 10,89 / share. This represents an increase of 0,00% over that period.
Fondens stemningsscore
Fund Sentiment Score (fka Ownership Accumulation Score) finder de aktier, der bliver mest købt af fonde. Det er resultatet af en sofistikeret, multi-faktor kvantitativ model, der identificerer virksomheder med de højeste niveauer af institutionel akkumulering. Scoringsmodellen bruger en kombination af den samlede stigning i oplyste ejere, ændringerne i porteføljeallokeringer i disse ejere og andre målinger. Tallet går fra 0 til 100, hvor højere tal indikerer et højere niveau af akkumulering for sine jævnaldrende, og 50 er gennemsnittet.
Opdateringsfrekvens: Dagligt
Se Ownership Explorer, som giver en liste over højest rangerende virksomheder.
AI+ Ask Fintel’s AI assistant about BlackRock MuniYield Quality Fund III, Inc..
Select a question to share a public post with an AI-crafted answer.
Thinking of good questions…
Institutionel Put/Call-forhold
Ud over at indberette standardaktie- og gældsudstedelser skal institutter med mere end 100 mill. aktiver under forvaltning også oplyse deres put- og call-optionsbeholdninger. Da salgsoptioner generelt indikerer negativ stemning, og købsoptioner indikerer positiv stemning, kan vi få en fornemmelse af den overordnede institutionelle stemning ved at plotte forholdet mellem put og kald. Diagrammet til højre viser det historiske put/call-forhold for dette instrument.
Brug af Put/Call Ratio som en indikator for investorernes stemning overvinder en af de vigtigste mangler ved at bruge totalt institutionelt ejerskab, som er, at en betydelig mængde af aktiver under forvaltning investeres passivt for at spore indekser. Passivt forvaltede fonde køber typisk ikke optioner, så indikatoren for put/call-forholdet følger mere nøje følelsen af aktivt forvaltede fonde.
13D/G-arkivering
Vi præsenterer 13D/G ansøgninger separat fra 13F ansøgninger på grund af den forskellige behandling af SEC. 13D/G-ansøgninger kan indgives af grupper af investorer (med én ledende), hvorimod 13F-ansøgninger ikke kan. Dette resulterer i situationer, hvor en investor kan indsende en 13D/G, der rapporterer én værdi for de samlede aktier (der repræsenterer alle de aktier, der ejes af investorgruppen), men derefter indsender en 13F, der rapporterer en anden værdi for de samlede aktier (der udelukkende repræsenterer deres egne) ejendomsret). Det betyder, at aktieejerskab af 13D/G-arkiver og 13F-arkiveringer ofte ikke er direkte sammenlignelige, så vi præsenterer dem separat.
Bemærk: Fra den 16. maj 2021 viser vi ikke længere ejere, der ikke har indsendt en 13D/G inden for det seneste år. Tidligere viste vi den fulde historie af 13D/G-arkiver. Generelt skal enheder, der er forpligtet til at indgive 13D/G-ansøgninger, indgive mindst årligt, før de indsender en afsluttende ansøgning. Dog forlader fonde nogle gange positioner uden at indsende en afsluttende ansøgning (dvs. de afvikler), så visning af den fulde historie resulterede nogle gange i forvirring om det nuværende ejerskab. For at undgå forvirring viser vi nu kun 'aktuelle' ejere - det vil sige - ejere, der har anmeldt inden for det seneste år.
Upgrade to unlock premium data.
| Fil dato | Form | Investor | Forrige Aktier |
Seneste Aktier |
Δ Aktier (Procent) |
Ejendomsret (Procent) |
Δ Ejerskab (Procent) |
|
|---|---|---|---|---|---|---|---|---|
| 2026-03-09 | Toronto Dominion Investments, Inc. | 3,564 | 5,877 | 64.90 | 100.00 | 0.00 |
13F og NPORT arkivering
Detaljer om 13F-arkivering er gratis. Detaljer om NP-ansøgninger kræver et premium-medlemskab. Grønne rækker angiver nye positioner. Røde rækker angiver lukkede positioner. Klik på linket ikon for at se den fulde transaktionshistorik.
Opgrader
for at låse premium-data op og eksportere til Excel ![]() .
.
| Fil dato | Kilde | Investor | Type | Gennemsnitlig pris (Øst) |
Aktier | Δ Aktier (%) |
Rapporteret Værdi ($1000) |
Δ Værdi (%) |
Port Alloc (%) |
|
|---|---|---|---|---|---|---|---|---|---|---|
| 2026-01-12 | 13F | Moody National Bank Trust Division | 10.420 | 113 | ||||||
| 2026-02-13 | 13F | Westchester Capital Management, LLC | 51.189 | 0,00 | 556 | -1,94 | ||||
| 2026-02-17 | 13F | Scarborough Advisors, LLC | 63.000 | 0,00 | 685 | -2,01 | ||||
| 2026-02-17 | 13F | Logan Stone Capital, LLC | 43.600 | 474 | ||||||
| 2026-02-03 | 13F | Cresta Advisors, Ltd. | 27.000 | 0,00 | 293 | -2,01 | ||||
| 2026-01-28 | 13F | WPG Advisers, LLC | 304 | 49,75 | 3 | 50,00 | ||||
| 2025-10-17 | 13F | Bard Financial Services, Inc. | 27.500 | -31,25 | 305 | -27,45 | ||||
| 2026-01-14 | 13F | TrueMark Investments, LLC | 17.943 | 2,51 | 195 | 1,04 | ||||
| 2026-02-13 | 13F | Colony Group, LLC | 10.000 | 109 | ||||||
| 2026-02-17 | 13F | Citadel Advisors Llc | 18.204 | 198 | ||||||
| 2026-02-02 | 13F | CX Institutional | 14.000 | 0,00 | 0 | |||||
| 2026-02-13 | 13F | Robinson Capital Management, Llc | 524.385 | 65,53 | 5.700 | 62,39 | ||||
| 2026-02-12 | 13F | Jane Street Group, Llc | 98.858 | 372,76 | 1.075 | 364,94 | ||||
| 2026-03-05 | 13F | Bayban | 478 | 5 | ||||||
| 2026-02-17 | 13F | Rivernorth Capital Management, Llc | 1.751.449 | -11,10 | 19.038 | -12,79 | ||||
| 2026-02-17 | 13F | Ameriprise Financial Inc | 25.486 | -28,43 | 277 | -29,70 | ||||
| 2025-10-07 | 13F | Sonora Investment Management Group, LLC | 10.000 | 0,00 | 111 | 5,77 | ||||
| 2026-02-11 | 13F | Fiera Capital Corp | 427.965 | 4.652 | ||||||
| 2026-02-17 | 13F | Private Advisor Group, LLC | 19.100 | -0,30 | 208 | -2,36 | ||||
| 2026-01-29 | 13F | Concurrent Investment Advisors, LLC | 37.466 | 1,73 | 407 | -0,25 | ||||
| 2026-02-10 | 13F | Moors & Cabot, Inc. | 32.890 | 17,09 | 358 | 14,79 | ||||
| 2026-02-02 | 13F | Wolverine Asset Management Llc | 2.884 | 31 | ||||||
| 2026-02-09 | 13F | Harbour Investments, Inc. | 5.200 | 0,00 | 57 | -1,75 | ||||
| 2026-02-12 | 13F | Commonwealth Equity Services, Llc | 191.984 | 3,72 | 2.087 | 104.200,00 | ||||
| 2026-01-14 | 13F | Eastern Bank | 0 | -100,00 | 0 | -100,00 | ||||
| 2026-02-10 | 13F | Goldman Sachs Group Inc | 10.463 | 114 | ||||||
| 2025-10-28 | 13F | Pinnacle Financial Partners Inc | 0 | -100,00 | 0 | |||||
| 2026-01-09 | 13F | Westview Management dba Westview Investment Advisors | 19.600 | 213 | ||||||
| 2026-02-02 | 13F | Chung Wu Investment Group, LLC | 10.000 | 0,00 | 109 | -1,82 | ||||
| 2026-02-12 | 13F | Sit Investment Associates Inc | 0 | -100,00 | 0 | |||||
| 2026-02-05 | 13F | Elyxium Wealth, LLC | 6.316 | 69 | ||||||
| 2026-02-13 | 13F | Karpus Management, Inc. | 0 | -100,00 | 0 | |||||
| 2026-02-14 | 13F | Rockefeller Capital Management L.P. | 249.293 | 0,83 | 2.710 | -1,10 | ||||
| 2026-02-11 | 13F | Cerity Partners LLC | 13.339 | 145 | ||||||
| 2026-02-06 | 13F | Pnc Financial Services Group, Inc. | 84.326 | 6,30 | 917 | 4,33 | ||||
| 2026-02-17 | 13F | Readystate Asset Management Lp | 32.790 | 356 | ||||||
| 2026-02-17 | 13F | Two Sigma Securities, Llc | 10.171 | 111 | ||||||
| 2025-10-30 | 13F | Traub Capital Management LLC | 0 | -100,00 | 0 | |||||
| 2026-02-17 | 13F | Bank Of America Corp /de/ | 656.780 | 0,32 | 7.139 | -1,57 | ||||
| 2026-02-11 | 13F | Janney Montgomery Scott LLC | 28.420 | 9,73 | 0 | |||||
| 2026-02-18 | 13F | GWM Advisors LLC | 74.257 | -63,29 | 807 | -63,99 | ||||
| 2026-01-20 | 13F | AdvisorNet Financial, Inc | 1.537 | 0,00 | 17 | -5,88 | ||||
| 2026-01-29 | 13F | UBS Group AG | 637.653 | 3,05 | 6.931 | 1,11 | ||||
| 2026-01-16 | 13F | Trust Co Of Vermont | 2.300 | 25 | ||||||
| 2026-02-13 | 13F | Pinnacle Wealth Planning Services, Inc. | 1.085 | 12 | ||||||
| 2026-02-10 | 13F/A | Northwestern Mutual Wealth Management Co | 2.752 | -29,94 | 30 | -32,56 | ||||
| 2026-01-05 | 13F | Noble Wealth Management PBC | 0 | -100,00 | 0 | |||||
| 2026-01-26 | 13F | River Street Advisors LLC | 0 | -100,00 | 0 | |||||
| 2025-11-17 | 13F | Vivaldi Capital Management, LLC | 0 | -100,00 | 0 | |||||
| 2026-02-13 | 13F | First Trust Advisors Lp | 15.751 | 4,99 | 171 | 3,01 | ||||
| 2026-02-11 | 13F | Capital Analysts, Inc. | 0 | -100,00 | 0 | |||||
| 2025-10-27 | 13F | Mackay Shields Llc | 0 | -100,00 | 0 | |||||
| 2026-02-23 | 13F | Virtu Financial LLC | 41.337 | 0 | ||||||
| 2026-02-02 | 13F | Kim, Llc | 204.185 | 0,00 | 2.219 | -1,90 | ||||
| 2026-02-13 | 13F | Mariner, LLC | 16.389 | 0,80 | 178 | -1,11 | ||||
| 2026-02-26 | 13F | Anchor Investment Management, LLC | 3.275 | 0,00 | 36 | -2,78 | ||||
| 2026-02-13 | 13F | Van Eck Associates Corp | 504.046 | 15,23 | 5 | 25,00 | ||||
| 2025-11-05 | 13F | Envestnet Asset Management Inc | 0 | -100,00 | 0 | |||||
| 2026-02-13 | 13F | Landscape Capital Management, L.l.c. | 39.527 | 430 | ||||||
| 2026-01-07 | 13F | Permanent Capital Management, LP | 12.842 | 140 | ||||||
| 2026-01-16 | 13F | FNY Investment Advisers, LLC | 0 | -100,00 | 0 | |||||
| 2026-02-10 | 13F | Disciplined Investors, L.L.C. | 14.500 | 0,00 | 158 | -1,87 | ||||
| 2025-09-24 | NP | XMPT - VanEck Vectors CEF Municipal Income ETF | 425.251 | 4,67 | 4.414 | 2,89 | ||||
| 2026-03-09 | 13F/A | CI Private Wealth, LLC | 0 | -100,00 | 0 | -100,00 | ||||
| 2025-10-22 | 13F | Geneos Wealth Management Inc. | 0 | -100,00 | 0 | |||||
| 2026-02-11 | 13F | Daner Wealth Management, LLC | 20.417 | 0,00 | 229 | 1,79 | ||||
| 2026-02-13 | 13F | Wells Fargo & Company/mn | 395.173 | -4,72 | 4.296 | -6,53 | ||||
| 2026-01-13 | 13F | Capital Investment Advisors, LLC | 224.258 | -8,67 | 2.438 | -10,40 | ||||
| 2026-02-11 | 13F | Horizon Kinetics Asset Management Llc | 102.099 | 0,00 | 1.110 | -1,95 | ||||
| 2026-02-12 | 13F | Wealthspire Advisors, LLC | 0 | -100,00 | 0 | |||||
| 2026-02-17 | 13F | XTX Topco Ltd | 28.308 | 308 | ||||||
| 2026-02-12 | 13F | Gould Capital, LLC | 6.350 | 0,00 | 69 | -1,43 | ||||
| 2026-02-17 | 13F | Advisory Services Network, LLC | 58.798 | 14,53 | 639 | 12,50 | ||||
| 2026-02-10 | 13F | Rothschild Investment Llc | 11.500 | -37,84 | 125 | -38,73 | ||||
| 2026-02-13 | 13F | Cohen & Steers, Inc. | 166.757 | 0,00 | 2 | 0,00 | ||||
| 2026-01-29 | 13F | Rareview Capital LLC | 377.478 | 31,11 | 3.960 | 31,09 | ||||
| 2026-02-11 | 13F | Allianz Asset Management GmbH | 490.934 | 0,00 | 5.336 | -1,89 | ||||
| 2026-02-11 | 13F | Hilton Head Capital Partners, LLC | 441 | 5 | ||||||
| 2026-02-12 | 13F | Advisors Asset Management, Inc. | 512.926 | 25,05 | 5.576 | 22,69 | ||||
| 2026-02-17 | 13F | Advisor Group Holdings, Inc. | 23.092 | 12,24 | 251 | 13,06 | ||||
| 2026-02-06 | 13F | Pathway Financial Advisers, LLC | 20.870 | 11,62 | 227 | 9,18 | ||||
| 2026-02-13 | 13F | City Of London Investment Management Co Ltd | 391.043 | 0,00 | 4.251 | -1,89 | ||||
| 2026-02-17 | 13F | Coastal Bridge Advisors, LLC | 173.968 | 0,79 | 1.891 | -1,10 | ||||
| 2026-01-14 | 13F | Hennion & Walsh Asset Management, Inc. | 1.554.195 | 0,84 | 16.894 | -1,07 | ||||
| 2026-02-05 | 13F | Allworth Financial LP | 0 | -100,00 | 0 | |||||
| 2026-02-17 | 13F | Wiley Bros.-aintree Capital, Llc | 22.554 | 245 | ||||||
| 2026-02-17 | 13F | Guggenheim Capital Llc | 1.435.436 | 6,68 | 15.603 | 4,65 | ||||
| 2025-11-14 | 13F | Elequin Capital Lp | 0 | -100,00 | 0 | |||||
| 2026-01-13 | 13F | Mather Group, Llc. | 0 | -100,00 | 0 | |||||
| 2026-02-06 | 13F | HighTower Advisors, LLC | 66.746 | -41,10 | 726 | -42,23 | ||||
| 2026-02-10 | 13F | Crescent Grove Advisors, LLC | 31.350 | -21,36 | 341 | -23,25 | ||||
| 2026-02-13 | 13F | Pathstone Holdings, LLC | 15.700 | -5,62 | 171 | -7,61 | ||||
| 2026-01-28 | 13F | Alesco Advisors Llc | 11.800 | 0,00 | 128 | -1,54 | ||||
| 2026-02-13 | 13F | Commerce Bank | 10.000 | 0,00 | 109 | -1,82 | ||||
| 2026-02-11 | 13F | LPL Financial LLC | 163.018 | -17,27 | 1.772 | -18,83 | ||||
| 2026-02-17 | 13F | Susquehanna International Group, Llp | 13.662 | 149 | ||||||
| 2026-02-19 | 13F | Invesco Ltd. | 176.336 | 5,26 | 1.917 | 3,23 | ||||
| 2026-01-15 | 13F | Highline Wealth Partners Llc | 500 | 0,00 | 5 | 0,00 | ||||
| 2026-02-17 | 13F | Toronto Dominion Bank | 0 | -100,00 | 0 | |||||
| 2026-02-12 | 13F | Hollencrest Capital Management | 22.896 | 0,00 | 249 | -1,98 | ||||
| 2026-02-13 | 13F | Kestra Advisory Services, LLC | 0 | -100,00 | 0 | |||||
| 2026-02-17 | 13F | Summit Trail Advisors, Llc | 21.253 | 231 | ||||||
| 2025-11-13 | 13F | Franklin Resources Inc | 0 | -100,00 | 0 | |||||
| 2026-02-17 | 13F | Balyasny Asset Management Llc | 140.110 | 1.523 | ||||||
| 2026-02-17 | 13F | Raymond James Financial Inc | 874.475 | -8,28 | 9.506 | -10,02 | ||||
| 2026-01-29 | 13F | Ashton Thomas Private Wealth, LLC | 38.279 | 16,57 | 416 | 14,29 | ||||
| 2026-02-05 | 13F | Plancorp, LLC | 20.000 | 0,00 | 217 | -1,81 | ||||
| 2026-02-12 | 13F | First Western Trust Bank | 39.221 | 0,00 | 426 | -1,84 | ||||
| 2026-02-13 | 13F | Morgan Stanley | 3.039.217 | 4,68 | 33.036 | 2,70 | ||||
| 2026-02-17 | 13F | Cetera Investment Advisers | 22.208 | 55,21 | 241 | 52,53 | ||||
| 2026-01-29 | 13F | Comerica Bank | 6.579 | 22.586,21 | 72 | |||||
| 2026-02-17 | 13F | Mercer Global Advisors Inc /adv | 20.986 | -4,11 | 228 | -5,79 | ||||
| 2026-02-17 | 13F | Equitable Holdings, Inc. | 15.899 | 0,00 | 173 | -2,27 | ||||
| 2026-02-12 | 13F | Hrt Financial Lp | 33.680 | 146,13 | 0 | |||||
| 2026-02-13 | 13F | Stifel Financial Corp | 997.529 | -5,35 | 10.843 | -7,13 | ||||
| 2026-01-14 | 13F | ORG Wealth Partners, LLC | 981 | 0,00 | 11 | 0,00 | ||||
| 2026-01-16 | 13F | Melfa Wealth Management, Llc | 236.350 | -1,86 | 2.569 | -3,71 | ||||
| 2026-01-15 | 13F | Allspring Global Investments Holdings, LLC | 135.092 | 0,00 | 1.468 | -1,87 | ||||
| 2026-02-05 | 13F | Bessemer Group Inc | 3.500 | 0 | ||||||
| 2026-02-06 | 13F | GPS Wealth Strategies Group, LLC | 0 | -100,00 | 0 | |||||
| 2026-02-12 | 13F | Steward Partners Investment Advisory, Llc | 15.167 | 8,24 | 165 | 5,81 | ||||
| 2026-01-30 | 13F | Us Bancorp \de\ | 22.538 | 0,00 | 245 | -2,01 | ||||
| 2026-01-29 | 13F | Camelot Portfolios, LLC | 19.731 | 16,06 | 214 | 13,83 | ||||
| 2026-02-17 | 13F | Royal Bank Of Canada | 220.209 | -1,90 | 2.394 | -3,74 | ||||
| 2026-01-21 | 13F | Future Financial Wealth Managment LLC | 10.000 | 0,00 | 111 | 0,91 | ||||
| 2026-02-10 | 13F | Sfmg, Llc | 13.526 | 0,00 | 147 | -1,34 | ||||
| 2025-11-14 | 13F | Nomura Holdings Inc | 0 | -100,00 | 0 | |||||
| 2026-02-11 | 13F | Prestige Wealth Management Group LLC | 2.488 | -66,70 | 27 | -67,47 | ||||
| 2026-02-11 | 13F | Ackerman Capital Advisors, LLC | 15.574 | -62,54 | 169 | -63,26 | ||||
| 2026-02-17 | 13F | Creative Planning | 10.017 | -10,87 | 109 | -12,90 |