Grundlæggende statistik
| Institutionelle ejere | 247 total, 241 long only, 1 short only, 5 long/short - change of 9,78% MRQ |
| Gennemsnitlig porteføljeallokering | 0.3317 % - change of -422,81% MRQ |
| Institutionelle aktier (lange) | 23.801.734 (ex 13D/G) - change of 4,73MM shares 24,77% MRQ |
| Institutionel værdi (lang) | $ 1.233.061 USD ($1000) |
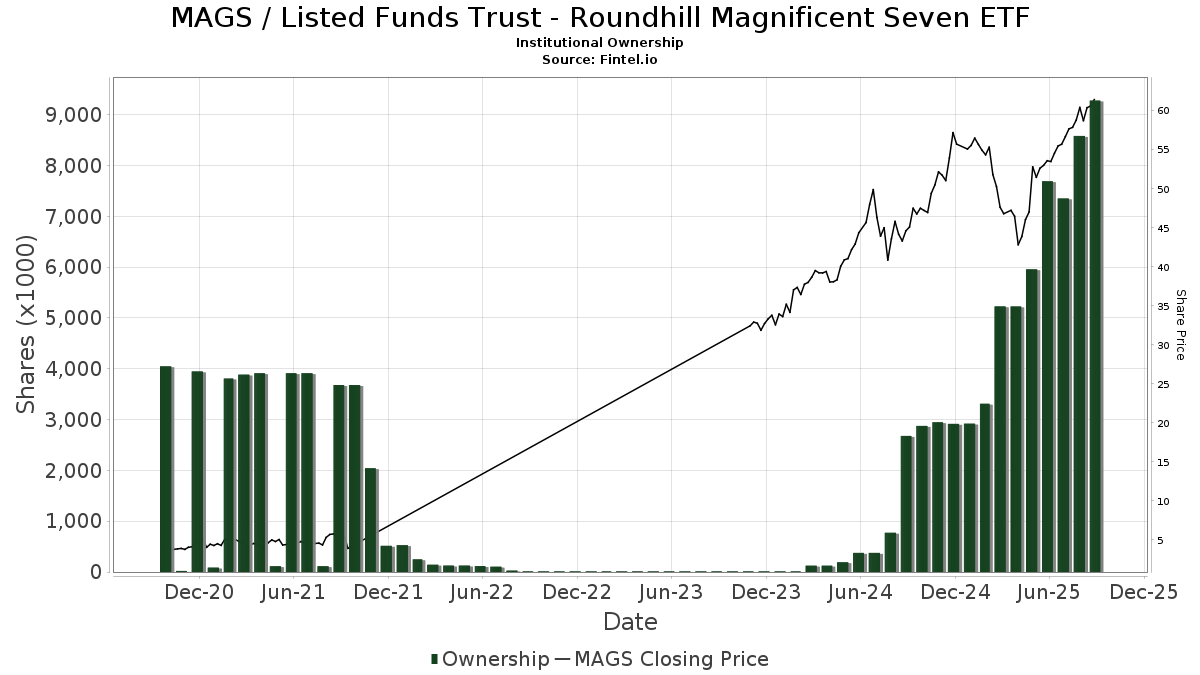
Institutionelt ejerskab og aktionærer
Listed Funds Trust - Roundhill Magnificent Seven ETF (US:MAGS) har 247 institutionelle ejere og aktionærer, der har indsendt 13D/G- eller 13F-formularer til Securities Exchange Commission (SEC). Disse institutioner har i alt 23,801,734 aktier. Største aktionærer omfatter Clal Insurance Enterprises Holdings Ltd, Exchange Traded Concepts, Llc, Jane Street Group, Llc, Horizon Investments, LLC, J.Safra Asset Management Corp, Money Concepts Capital Corp, Goldman Sachs Group Inc, Two Sigma Investments, Lp, Marks Wealth, LLC, and Susquehanna International Group, Llp .
Listed Funds Trust - Roundhill Magnificent Seven ETF (BATS:MAGS) institutionel ejerskabsstruktur viser aktuelle positioner i virksomheden efter institutioner og fonde, samt seneste ændringer i positionsstørrelse. Større aktionærer kan omfatte individuelle investorer, investeringsforeninger, hedgefonde eller institutioner. Skema 13D angiver, at investoren besidder (eller besidder) mere end 5 % af virksomheden og har til hensigt (eller har til hensigt at) aktivt at forfølge en ændring i forretningsstrategi. Skema 13G indikerer en passiv investering på over 5%.
The share price as of April 10, 2026 is 61,14 / share. Previously, on April 14, 2025, the share price was 44,87 / share. This represents an increase of 36,26% over that period.
Fondens stemningsscore
Fund Sentiment Score (fka Ownership Accumulation Score) finder de aktier, der bliver mest købt af fonde. Det er resultatet af en sofistikeret, multi-faktor kvantitativ model, der identificerer virksomheder med de højeste niveauer af institutionel akkumulering. Scoringsmodellen bruger en kombination af den samlede stigning i oplyste ejere, ændringerne i porteføljeallokeringer i disse ejere og andre målinger. Tallet går fra 0 til 100, hvor højere tal indikerer et højere niveau af akkumulering for sine jævnaldrende, og 50 er gennemsnittet.
Opdateringsfrekvens: Dagligt
Se Ownership Explorer, som giver en liste over højest rangerende virksomheder.
AI+ Ask Fintel’s AI assistant about Listed Funds Trust - Roundhill Magnificent Seven ETF.
Select a question to share a public post with an AI-crafted answer.
Thinking of good questions…
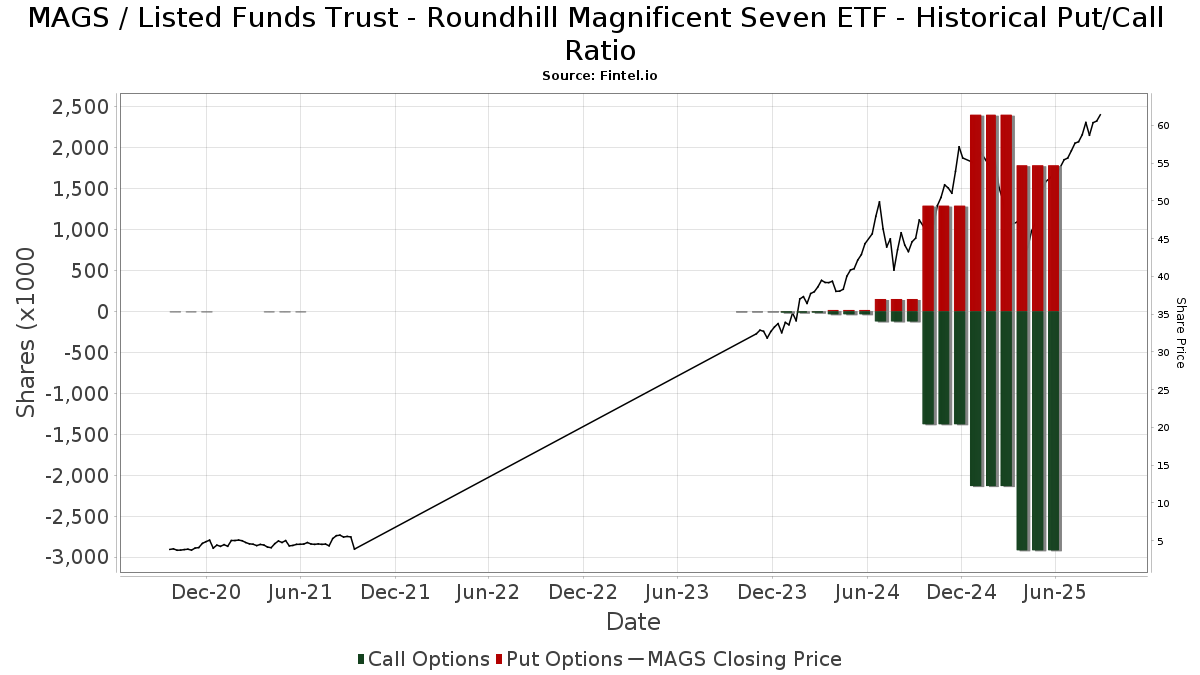
Institutionel Put/Call-forhold
Ud over at indberette standardaktie- og gældsudstedelser skal institutter med mere end 100 mill. aktiver under forvaltning også oplyse deres put- og call-optionsbeholdninger. Da salgsoptioner generelt indikerer negativ stemning, og købsoptioner indikerer positiv stemning, kan vi få en fornemmelse af den overordnede institutionelle stemning ved at plotte forholdet mellem put og kald. Diagrammet til højre viser det historiske put/call-forhold for dette instrument.
Brug af Put/Call Ratio som en indikator for investorernes stemning overvinder en af de vigtigste mangler ved at bruge totalt institutionelt ejerskab, som er, at en betydelig mængde af aktiver under forvaltning investeres passivt for at spore indekser. Passivt forvaltede fonde køber typisk ikke optioner, så indikatoren for put/call-forholdet følger mere nøje følelsen af aktivt forvaltede fonde.
13D/G-arkivering
Vi præsenterer 13D/G ansøgninger separat fra 13F ansøgninger på grund af den forskellige behandling af SEC. 13D/G-ansøgninger kan indgives af grupper af investorer (med én ledende), hvorimod 13F-ansøgninger ikke kan. Dette resulterer i situationer, hvor en investor kan indsende en 13D/G, der rapporterer én værdi for de samlede aktier (der repræsenterer alle de aktier, der ejes af investorgruppen), men derefter indsender en 13F, der rapporterer en anden værdi for de samlede aktier (der udelukkende repræsenterer deres egne) ejendomsret). Det betyder, at aktieejerskab af 13D/G-arkiver og 13F-arkiveringer ofte ikke er direkte sammenlignelige, så vi præsenterer dem separat.
Bemærk: Fra den 16. maj 2021 viser vi ikke længere ejere, der ikke har indsendt en 13D/G inden for det seneste år. Tidligere viste vi den fulde historie af 13D/G-arkiver. Generelt skal enheder, der er forpligtet til at indgive 13D/G-ansøgninger, indgive mindst årligt, før de indsender en afsluttende ansøgning. Dog forlader fonde nogle gange positioner uden at indsende en afsluttende ansøgning (dvs. de afvikler), så visning af den fulde historie resulterede nogle gange i forvirring om det nuværende ejerskab. For at undgå forvirring viser vi nu kun 'aktuelle' ejere - det vil sige - ejere, der har anmeldt inden for det seneste år.
Upgrade to unlock premium data.
| Fil dato | Form | Investor | Forrige Aktier |
Seneste Aktier |
Δ Aktier (Procent) |
Ejendomsret (Procent) |
Δ Ejerskab (Procent) |
|
|---|---|---|---|---|---|---|---|---|
| 2025-08-18 | MONEY CONCEPTS CAPITAL CORP | 977,740 | 1,221,775 | 24.96 | 3.80 | 26.67 |
13F og NPORT arkivering
Detaljer om 13F-arkivering er gratis. Detaljer om NP-ansøgninger kræver et premium-medlemskab. Grønne rækker angiver nye positioner. Røde rækker angiver lukkede positioner. Klik på linket ikon for at se den fulde transaktionshistorik.
Opgrader
for at låse premium-data op og eksportere til Excel ![]() .
.
| Fil dato | Kilde | Investor | Type | Gennemsnitlig pris (Øst) |
Aktier | Δ Aktier (%) |
Rapporteret Værdi ($1000) |
Δ Værdi (%) |
Port Alloc (%) |
|
|---|---|---|---|---|---|---|---|---|---|---|
| 2026-02-10 | 13F | Ritter Daniher Financial Advisory LLC / DE | 71 | 5 | ||||||
| 2026-02-13 | 13F | Ausdal Financial Partners, Inc. | 83.078 | 55,64 | 5.480 | 58,26 | ||||
| 2026-02-04 | 13F | Ameritas Advisory Services, LLC | 0 | -100,00 | 0 | |||||
| 2026-02-12 | 13F | Renaissance Technologies Llc | 0 | -100,00 | 0 | |||||
| 2026-02-17 | 13F | Jones Financial Companies Lllp | 721 | 48 | ||||||
| 2026-01-05 | 13F | GoalVest Advisory LLC | 0 | -100,00 | 0 | |||||
| 2026-01-23 | 13F | Sage Mountain Advisors LLC | 6.100 | 0,00 | 402 | 1,77 | ||||
| 2026-02-10 | 13F | Belvedere Trading LLC | 3.289 | 217 | ||||||
| 2026-01-28 | 13F | Fischer Investment Strategies, Llc | 8.692 | -59,03 | 573 | -58,36 | ||||
| 2026-02-13 | 13F | Gen-Wealth Partners Inc | 82 | 0,00 | 5 | 0,00 | ||||
| 2025-10-30 | 13F | Twin Peaks Wealth Advisors, LLC | 0 | -100,00 | 0 | |||||
| 2026-01-23 | 13F | Assetmark, Inc | 77 | 0,00 | 5 | 25,00 | ||||
| 2026-01-15 | 13F | Three Seasons Wealth, LLC | 6.379 | -8,39 | 421 | -6,87 | ||||
| 2026-02-13 | 13F | Mariner, LLC | 186.293 | 0,81 | 12.288 | 2,52 | ||||
| 2026-01-23 | 13F | Carnegie Capital Asset Management, LLC | 4.897 | -43,72 | 323 | -42,73 | ||||
| 2026-02-10 | 13F/A | Northwestern Mutual Wealth Management Co | 38.799 | 11,19 | 2.559 | 13,08 | ||||
| 2026-01-13 | 13F | FSA Investment Group, LLC | 8.203 | 1,01 | 541 | 2,27 | ||||
| 2026-01-23 | 13F | Diversify Advisory Services, LLC | 7.872 | 11,06 | 511 | 4,94 | ||||
| 2026-02-13 | 13F | Colony Group, LLC | 7.962 | 53,03 | 525 | 55,79 | ||||
| 2026-02-12 | 13F | Concorde Asset Management, LLC | 7.960 | 0,25 | 525 | 1,74 | ||||
| 2026-02-17 | 13F | Ionic Capital Management LLC | 17.762 | 0,00 | 1.172 | 1,65 | ||||
| 2026-04-07 | 13F | Estate Planners Group, LLC | 80.011 | 5.278 | ||||||
| 2026-01-28 | 13F | waypoint wealth counsel | 4.490 | 1,42 | 296 | 3,14 | ||||
| 2026-01-14 | 13F | ORG Partners LLC | 46 | 0,00 | 3 | 0,00 | ||||
| 2026-02-13 | 13F | Change Path, LLC | 3.118 | 206 | ||||||
| 2026-02-17 | 13F | Tudor Investment Corp Et Al | 26.709 | 1.762 | ||||||
| 2026-02-03 | 13F | SBI Securities Co., Ltd. | 1.479 | 88,17 | 98 | 94,00 | ||||
| 2026-02-10 | 13F | Advisor Resource Council | 8.752 | 579 | ||||||
| 2026-04-07 | 13F | Comprehensive Financial Planning, Inc./PA | 21.598 | -43,95 | 1.251 | -50,77 | ||||
| 2026-02-17 | 13F | Warren Averett Asset Management, LLC | 32.226 | 1,80 | 2.126 | 3,51 | ||||
| 2026-02-12 | 13F | Insigneo Advisory Services, Llc | 8.547 | -24,91 | 564 | -23,71 | ||||
| 2026-02-12 | 13F | Wealthspire Advisors, LLC | 0 | -100,00 | 0 | |||||
| 2026-02-17 | 13F | Creative Planning | 19.521 | 23,61 | 1.288 | 25,68 | ||||
| 2026-02-17 | 13F | SageView Advisory Group, LLC | 1.201 | 79 | ||||||
| 2026-01-15 | 13F | BetterWealth, LLC | 5.825 | 0,00 | 384 | 1,86 | ||||
| 2025-10-15 | 13F | Stephens Consulting, LLC | 0 | -100,00 | 0 | |||||
| 2026-02-10 | 13F | Belvedere Trading LLC | Put | 2.200 | 145 | |||||
| 2026-02-10 | 13F | Belvedere Trading LLC | Call | 1.100 | 73 | |||||
| 2025-11-14 | 13F | Bnp Paribas | 0 | -100,00 | 0 | -100,00 | ||||
| 2025-11-12 | 13F | Creekmur Asset Management LLC | 639 | -1,39 | 41 | 17,14 | ||||
| 2026-02-06 | 13F | HighTower Advisors, LLC | 435.118 | 0,95 | 28.700 | 2,66 | ||||
| 2026-02-17 | 13F | Advisor Group Holdings, Inc. | 187.360 | 7,40 | 12.358 | 14,86 | ||||
| 2026-02-10 | 13F | NINE MASTS CAPITAL Ltd | 18.309 | 1.208 | ||||||
| 2026-01-26 | 13F | PFG Investments, LLC | 4.446 | -6,02 | 293 | -4,25 | ||||
| 2026-01-27 | 13F | Belpointe Asset Management LLC | 31.866 | -2,42 | 2.102 | -0,80 | ||||
| 2026-02-06 | 13F | Geometric Wealth Advisors | 3.465 | 0,00 | 229 | 1,79 | ||||
| 2026-01-26 | 13F | Midland Wealth Advisors Llc | 139.183 | -1,24 | 9.181 | 0,44 | ||||
| 2026-02-09 | 13F | Prospera Financial Services Inc | 8.750 | -5,17 | 577 | -3,51 | ||||
| 2026-01-20 | 13F | AdvisorNet Financial, Inc | 685 | 0,00 | 45 | 2,27 | ||||
| 2026-01-26 | 13F | Reyes Financial Architecture, Inc. | 1.344 | -98,64 | 89 | -98,62 | ||||
| 2026-02-09 | 13F | Strategic Financial Concepts, LLC | 0 | -100,00 | 0 | |||||
| 2026-01-14 | 13F | Spire Wealth Management | 117.413 | -2,72 | 7.745 | -1,07 | ||||
| 2026-01-21 | 13F | Newbridge Financial Services Group, Inc. | 75 | 5 | ||||||
| 2026-01-27 | 13F | BigSur Wealth Management LLC | 12.000 | 0,00 | 792 | 1,67 | ||||
| 2026-02-12 | 13F | Brinker Capital Investments, LLC | 46.756 | -13,12 | 3.084 | -11,63 | ||||
| 2026-02-10 | 13F | Goldman Sachs Group Inc | 1.087.124 | 0,15 | 71.707 | 1,85 | ||||
| 2026-02-17 | 13F | Citadel Advisors Llc | Put | 193.600 | 7,68 | 12.770 | 9,50 | |||
| 2025-11-14 | 13F | Massar Capital Management, LP | 0 | -100,00 | 0 | -100,00 | ||||
| 2026-02-17 | 13F | Citadel Advisors Llc | 209.781 | 53,62 | 13.837 | 56,23 | ||||
| 2025-11-14 | 13F | Balyasny Asset Management Llc | 0 | -100,00 | 0 | |||||
| 2026-01-28 | 13F | Salomon & Ludwin, LLC | 0 | -100,00 | 0 | |||||
| 2026-02-17 | 13F | Citadel Advisors Llc | Call | 220.100 | -2,05 | 14.518 | -0,39 | |||
| 2026-02-12 | 13F | Kovack Advisors, Inc. | 6.942 | 337 | ||||||
| 2026-02-12 | 13F | Triumph Capital Management | 9.854 | 2,28 | 650 | 4,01 | ||||
| 2026-01-20 | 13F | Monticello Wealth Management, Llc | 5.435 | 60,70 | 358 | 63,47 | ||||
| 2026-02-12 | 13F | Principal Securities, Inc. | 0 | -100,00 | 0 | |||||
| 2026-02-17 | 13F | Old Mission Capital Llc | Call | 39.000 | -95,59 | 9 | -98,11 | |||
| 2026-02-12 | 13F | Summit Financial, LLC | 3.427 | 226 | ||||||
| 2026-02-11 | 13F | MCF Advisors LLC | 415 | 27 | ||||||
| 2026-01-08 | 13F | Goodman Financial Corp | 0 | -100,00 | 0 | |||||
| 2026-04-03 | 13F | Investors Research Corp | 240 | 0,00 | 14 | -13,33 | ||||
| 2026-01-29 | 13F | Kestra Private Wealth Services, Llc | 5.004 | 0,00 | 330 | 1,85 | ||||
| 2026-02-11 | 13F | Cerity Partners LLC | 391.952 | 4.174,29 | 25.853 | 4.252,36 | ||||
| 2026-02-17 | 13F | Qube Research & Technologies Ltd | 309.814 | 418,02 | 20.435 | 426,81 | ||||
| 2026-02-20 | 13F | Sunbelt Securities, Inc. | 510 | 7,37 | 34 | 10,00 | ||||
| 2026-01-23 | 13F | Smith, Moore & Co. | 8.535 | 0,00 | 563 | 1,63 | ||||
| 2026-01-26 | 13F | AE Wealth Management LLC | 2.561 | 16,15 | 169 | 17,48 | ||||
| 2026-02-09 | 13F | Cypress Capital Management LLC (WY) | 8 | 1 | ||||||
| 2026-02-02 | 13F | Horizon Investments, LLC | 2.130.240 | 292,66 | 140.511 | 299,32 | ||||
| 2026-01-21 | 13F | Capital Advisory Group Advisory Services, LLC | 14.237 | -3,12 | 939 | -1,47 | ||||
| 2026-02-17 | 13F | Cetera Investment Advisers | 24.365 | 127,77 | 1.607 | 131,89 | ||||
| 2026-02-17 | 13F | Trexquant Investment LP | 3.159 | -13,00 | 208 | -11,49 | ||||
| 2026-02-17 | 13F | Susquehanna International Group, Llp | Call | 534.800 | -57,82 | 35.275 | -57,10 | |||
| 2026-02-17 | 13F | Susquehanna International Group, Llp | 365.803 | 7.895,69 | 24.128 | 8.051,35 | ||||
| 2026-02-17 | 13F | Susquehanna International Group, Llp | Put | 233.800 | -42,04 | 15.421 | -41,06 | |||
| 2026-04-07 | 13F | CoreCap Advisors, LLC | 16.382 | -20,60 | 949 | -30,22 | ||||
| 2026-01-30 | 13F | Trifecta Capital Advisors, LLC | 1.000 | 0,00 | 66 | 1,56 | ||||
| 2026-02-12 | 13F | CIBC Private Wealth Group, LLC | 1.000 | -44,44 | 66 | -43,97 | ||||
| 2026-01-22 | 13F | Brookwood Investment Group LLC | 3.717 | 0,92 | 245 | 2,94 | ||||
| 2026-01-21 | 13F | Access Financial Services, Inc. | 7.216 | 62,38 | 275 | -4,51 | ||||
| 2026-02-13 | 13F | Barclays Plc | 2.000 | -36,71 | 132 | -35,78 | ||||
| 2026-01-28 | 13F | Momentum Wealth Planning, LLC | 33.961 | 2.240 | ||||||
| 2026-02-14 | 13F | Rockefeller Capital Management L.P. | 108.305 | 128,23 | 7.157 | 132,56 | ||||
| 2026-01-27 | 13F | Fortis Capital Advisors, LLC | 9.605 | 1,43 | 634 | 3,09 | ||||
| 2026-01-20 | 13F | Coastal Investment Advisors, Inc. | 0 | -100,00 | 0 | |||||
| 2026-01-23 | 13F | Oxler Private Wealth LLC | 11.679 | -1,26 | 770 | 0,39 | ||||
| 2026-02-09 | 13F | Harbour Investments, Inc. | 29.650 | -13,97 | 1.956 | -12,53 | ||||
| 2026-02-10 | 13F | Anchor Capital Advisors Llc | 6.743 | -2,66 | 445 | -1,11 | ||||
| 2026-02-06 | 13F | Larson Financial Group LLC | 200 | -81,13 | 13 | -80,88 | ||||
| 2026-02-09 | 13F | Hartland & Co., LLC | 6.956 | 0,49 | 459 | 2,23 | ||||
| 2026-01-28 | 13F | Kingswood Wealth Advisors, Llc | 6.895 | 455 | ||||||
| 2026-02-12 | 13F | Commonwealth Equity Services, Llc | 237.341 | 0,05 | 15.655 | 104.260,00 | ||||
| 2026-01-12 | 13F | Evolution Wealth Advisors, LLC | 5.150 | 0,00 | 340 | 1,50 | ||||
| 2026-02-02 | 13F | Cornerstone Planning Group LLC | 0 | -100,00 | 0 | |||||
| 2026-02-13 | 13F | Integrated Wealth Concepts LLC | 0 | -100,00 | 0 | |||||
| 2026-02-12 | 13F | Wedbush Securities Inc | 9.213 | 50,15 | 1 | |||||
| 2026-04-10 | 13F | Quaker Wealth Management, LLC | 123.927 | 7.180 | ||||||
| 2026-01-23 | 13F | Freestone Capital Holdings, LLC | 6.678 | 38,75 | 440 | 41,03 | ||||
| 2026-01-27 | 13F | PFG Advisors | 4.682 | 1,23 | 309 | 3,01 | ||||
| 2026-01-29 | 13F | UBS Group AG | 35.232 | -21,58 | 2.324 | -20,28 | ||||
| 2026-02-04 | 13F | Pensionmark Financial Group, Llc | 6.605 | -74,51 | 396 | -76,49 | ||||
| 2026-01-08 | 13F | Maridea Wealth Management LLC | 42.966 | 33,41 | 2.834 | 34,82 | ||||
| 2026-01-23 | 13F | Howard Capital Management Inc. | 5.848 | 386 | ||||||
| 2026-01-21 | 13F | Prime Capital Investment Advisors, LLC | 5.315 | -7,44 | 351 | -5,91 | ||||
| 2026-02-12 | 13F | Jane Street Group, Llc | 0 | -100,00 | 0 | -100,00 | ||||
| 2026-02-02 | 13F | Oppenheimer & Co Inc | 92.310 | -6,22 | 6.089 | -4,64 | ||||
| 2026-02-17 | 13F | Bank Of America Corp /de/ | 27.775 | -12,89 | 1.832 | -11,37 | ||||
| 2026-01-09 | 13F | Capital CS Group, LLC | 27.239 | -2,95 | 1.797 | -1,32 | ||||
| 2026-02-05 | 13F | BlueChip Wealth Advisors LLC | 19.489 | 0,00 | 1.285 | 1,66 | ||||
| 2026-01-07 | 13F | American Asset Management Inc. | 7.337 | 62,39 | 484 | 64,85 | ||||
| 2026-01-29 | 13F | Comerica Bank | 482 | 89,76 | 32 | 93,75 | ||||
| 2026-02-17 | 13F | VestGen Advisors, LLC | 41.928 | 465,98 | 2.766 | 476,04 | ||||
| 2026-02-10 | 13F | Hazlett, Burt & Watson, Inc. | 1.604 | 10,32 | 0 | |||||
| 2026-01-12 | 13F | World Equity Group, Inc. | 7.296 | -4,16 | 481 | -2,43 | ||||
| 2026-01-12 | 13F | AllSquare Wealth Management LLC | 100 | 0,00 | 6 | 20,00 | ||||
| 2026-01-15 | 13F | Victory Financial Group, Llc | 16.759 | -0,83 | 1.105 | 0,82 | ||||
| 2026-02-17 | 13F | Royal Bank Of Canada | 116.036 | 11,76 | 7.654 | 13,65 | ||||
| 2026-02-17 | 13F | Concentric Capital Strategies, LP | 46.109 | -76,56 | 3.041 | -76,16 | ||||
| 2026-02-18 | 13F | Beacon Pointe Advisors, LLC | 11.665 | 28,33 | 769 | 30,56 | ||||
| 2026-02-10 | 13F | Foundations Investment Advisors, LLC | 41.291 | 25,98 | 2.724 | 28,14 | ||||
| 2026-01-28 | 13F | WPG Advisers, LLC | 5 | 0 | ||||||
| 2026-02-12 | 13F | Steward Partners Investment Advisory, Llc | 1.680 | 5,13 | 111 | 6,80 | ||||
| 2026-01-15 | 13F | Brookstone Capital Management | 103.602 | -0,28 | 6.834 | 1,41 | ||||
| 2026-01-13 | 13F | Signal Advisors Wealth, LLC | 7.725 | 25,43 | 510 | 27,57 | ||||
| 2026-01-28 | 13F | Milestone Asset Management, Llc | 11.453 | 52,32 | 756 | 55,03 | ||||
| 2026-02-13 | 13F | Smartleaf Asset Management LLC | 3.200 | 213 | ||||||
| 2026-02-11 | 13F | Parallel Advisors, LLC | 289 | 0,35 | 19 | 5,56 | ||||
| 2025-11-12 | 13F | Blair William & Co/il | 0 | -100,00 | 0 | -100,00 | ||||
| 2026-01-30 | 13F | Simplicity Wealth,LLC | 3.365 | 222 | ||||||
| 2026-02-12 | 13F | Colonial Trust Co / SC | 150 | 20,00 | 10 | 12,50 | ||||
| 2026-02-10 | 13F | Alpha Financial Partners, LLC | 9.680 | 0,00 | 638 | 1,75 | ||||
| 2026-01-28 | 13F | Members Wealth Llc | 3.602 | 0,00 | 237 | 1,28 | ||||
| 2026-02-05 | 13F | IMG Wealth Management, Inc. | 112 | 0,00 | 7 | 0,00 | ||||
| 2026-01-13 | 13F | Norden Group Llc | 9.050 | 0,00 | 597 | 1,71 | ||||
| 2026-02-05 | 13F | WealthPlan Investment Management, LLC | 3.856 | -26,43 | 254 | -25,07 | ||||
| 2025-10-21 | 13F | Morton Brown Family Wealth, LLC | 0 | -100,00 | 0 | |||||
| 2026-02-17 | 13F | Integrated Advisors Network LLC | 3.307 | -46,38 | 218 | -45,50 | ||||
| 2026-01-27 | 13F/A | Capital Performance Advisors Llp | 3.200 | -1,90 | 211 | 0,00 | ||||
| 2026-02-12 | 13F | TopTier Wealth Management, LLC | 11.231 | 741 | ||||||
| 2025-10-30 | 13F | Envestnet Portfolio Solutions, Inc. | 0 | -100,00 | 0 | -100,00 | ||||
| 2026-02-12 | 13F | Bank Of Montreal /can/ | 13.062 | 62,73 | 862 | 65,58 | ||||
| 2026-01-29 | 13F | Sanctuary Advisors, LLC | 13.243 | 3,20 | 874 | 4,93 | ||||
| 2026-02-06 | 13F | Fortis Group Advisors, LLC | 63.031 | -0,18 | 4.170 | -2,84 | ||||
| 2025-11-14 | 13F | Nomura Holdings Inc | Call | 0 | -100,00 | 0 | -100,00 | |||
| 2026-01-21 | 13F | New Wave Wealth Advisors Llc | 4.337 | -37,52 | 286 | -36,44 | ||||
| 2026-02-13 | 13F | Ieq Capital, Llc | 32.224 | 1,04 | 2.125 | 2,76 | ||||
| 2025-11-14 | 13F | Nomura Holdings Inc | Put | 0 | -100,00 | 0 | -100,00 | |||
| 2026-02-17 | 13F | RMB Capital Management, LLC | 32.185 | 2.123 | ||||||
| 2026-01-26 | 13F | Cwm, Llc | 1.910 | 0,21 | 0 | |||||
| 2026-02-02 | 13F | WT Wealth Management | 21.476 | 10,34 | 1.417 | 12,20 | ||||
| 2026-01-14 | 13F | Exchange Traded Concepts, Llc | 4.267.718 | 98,73 | 281.499 | 102,11 | ||||
| 2026-02-09 | 13F | Client First Investment Management LLC | 0 | -100,00 | 0 | |||||
| 2026-02-17 | 13F | Two Sigma Investments, Lp | 801.100 | 577,75 | 52.841 | 589,28 | ||||
| 2026-02-13 | 13F | Advyzon Investment Management, LLC | 84.519 | 119,66 | 5.575 | 123,41 | ||||
| 2026-02-13 | 13F | Financial Freedom, LLC | 8.192 | -0,91 | 540 | 0,75 | ||||
| 2026-01-29 | 13F | Ashton Thomas Private Wealth, LLC | 3.870 | -17,45 | 255 | -16,12 | ||||
| 2026-01-14 | 13F | Barnes Dennig Private Wealth Management LLC | 748 | 25,50 | 49 | 28,95 | ||||
| 2026-01-27 | 13F | Institute for Wealth Management, LLC. | 3.820 | 6,97 | 252 | 8,66 | ||||
| 2026-02-03 | 13F | Financial Partners Group, Inc | 3.975 | 263 | ||||||
| 2026-02-13 | 13F | Mml Investors Services, Llc | 35.315 | -2,78 | 2.329 | -1,10 | ||||
| 2026-02-09 | 13F | HBK Sorce Advisory LLC | 0 | -100,00 | 0 | -100,00 | ||||
| 2026-02-13 | 13F | Vienna Asset Management LLC | 25.963 | -15,57 | 1.713 | -14,14 | ||||
| 2026-01-14 | 13F | Wealthcare Advisory Partners LLC | 9.723 | -29,87 | 641 | -28,70 | ||||
| 2026-02-17 | 13F | Optiver Holding B.V. | 208 | 14 | ||||||
| 2026-02-13 | 13F | Pin Oak Investment Advisors Inc | 2.855 | 0 | ||||||
| 2025-11-14 | 13F | Wolverine Trading, Llc | Put | 57.800 | -31,68 | 3.744 | -20,37 | |||
| 2026-02-03 | 13F | International Assets Investment Management, Llc | 2.605 | -38,42 | 172 | -25,97 | ||||
| 2025-10-23 | 13F | SG Americas Securities, LLC | 0 | -100,00 | 0 | |||||
| 2026-01-09 | 13F | Tactive Advisors, LLC | 46.820 | 3,88 | 3.088 | 5,64 | ||||
| 2026-02-11 | 13F | Mascagni Wealth Management, Inc. | 12.484 | 25,67 | 823 | 27,80 | ||||
| 2026-04-09 | 13F | Key Client Fiduciary Advisors, LLC | 32.132 | 8,24 | 1.862 | -4,95 | ||||
| 2026-01-22 | 13F | Venturi Wealth Management, LLC | 10.030 | 662 | ||||||
| 2026-04-08 | 13F | Wealth Enhancement Advisory Services, Llc | 8.816 | 12,11 | 514 | -0,58 | ||||
| 2026-01-23 | 13F | Twelve Points Wealth Management LLC | 39.100 | 63,98 | 2.595 | 67,85 | ||||
| 2026-01-23 | 13F | Altfest L J & Co Inc | 4.953 | 44,02 | 327 | 46,19 | ||||
| 2026-02-11 | 13F | Hilton Head Capital Partners, LLC | 415 | 27 | ||||||
| 2026-02-13 | 13F | Kestra Advisory Services, LLC | 31.420 | -3,96 | 2.072 | -2,31 | ||||
| 2026-01-12 | 13F | Focus Financial Network, Inc. | 14.622 | -9,46 | 964 | -7,93 | ||||
| 2026-02-10 | 13F | Sarver Vrooman Wealth Advisors | 46 | 3 | ||||||
| 2026-01-30 | 13F | Strategic Blueprint, LLC | 5.256 | 347 | ||||||
| 2026-01-30 | 13F | Activest Wealth Management | 11.625 | 46,78 | 767 | 49,32 | ||||
| 2026-02-13 | 13F | Gts Securities Llc | 28.106 | 1.854 | ||||||
| 2026-01-27 | 13F | GHP Investment Advisors, Inc. | 76 | 5 | ||||||
| 2026-02-17 | 13F | Private Advisor Group, LLC | 18.595 | -5,17 | 1.227 | -3,54 | ||||
| 2026-02-17 | 13F | IHT Wealth Management, LLC | 5.188 | 0,10 | 342 | 1,79 | ||||
| 2026-01-23 | 13F | HBW Advisory Services LLC | 12.037 | 1,23 | 794 | 2,85 | ||||
| 2026-01-27 | 13F | Vista Finance, Llc | 502.010 | -2,49 | 33.113 | -0,83 | ||||
| 2025-11-07 | 13F | HighTower Advisors, LLC | Put | 0 | -100,00 | 0 | -100,00 | |||
| 2025-11-13 | 13F | Total Investment Management Inc | 0 | -100,00 | 0 | |||||
| 2025-11-14 | 13F | City Of London Investment Management Co Ltd | 0 | -100,00 | 0 | |||||
| 2026-02-17 | 13F | Regal Investment Advisors LLC | 8.398 | 6,40 | 554 | 8,22 | ||||
| 2026-01-20 | 13F | JB Capital LLC | 6.116 | 0,05 | 403 | 1,77 | ||||
| 2026-01-26 | 13F | Xcel Wealth Management, LLC | 7.128 | 0,04 | 470 | 1,73 | ||||
| 2026-02-11 | 13F | M Holdings Securities, Inc. | 14.951 | 1 | ||||||
| 2026-04-09 | 13F | C2P Capital Advisory Group, LLC d.b.a. Prosperity Capital Advisors | 3.520 | 0,43 | 204 | -12,12 | ||||
| 2026-02-02 | 13F | Pittenger & Anderson Inc | 300 | 20 | ||||||
| 2026-02-17 | 13F | Boothbay Fund Management, Llc | 8.200 | 17,14 | 541 | 18,94 | ||||
| 2026-02-10 | 13F | Envestnet Asset Management Inc | 104.469 | 29,80 | 6.891 | 31,99 | ||||
| 2026-02-11 | 13F | J.w. Cole Advisors, Inc. | 26.558 | 52,02 | 1.580 | 39,45 | ||||
| 2026-02-03 | 13F | RFG Advisory, LLC | 89.896 | 6,36 | 5.930 | 8,15 | ||||
| 2026-02-12 | 13F | Brown Brothers Harriman & Co | 76 | 0,00 | 5 | 25,00 | ||||
| 2026-02-13 | 13F | Clal Insurance Enterprises Holdings Ltd | 4.650.000 | 0,00 | 307 | 1,66 | ||||
| 2026-02-06 | 13F | Global Retirement Partners, LLC | 111 | 0,00 | 7 | 0,00 | ||||
| 2026-02-12 | 13F | BRYN MAWR TRUST Co | 730 | 0,00 | 48 | 2,13 | ||||
| 2026-02-05 | 13F | Tucker Asset Management Llc | 1.874 | 124 | ||||||
| 2026-02-13 | 13F | Polymer Capital Management (HK) LTD | 78.931 | -73,75 | 5.206 | -73,31 | ||||
| 2026-02-06 | 13F | IFP Advisors, Inc | 15.640 | 1,12 | 1.032 | 2,79 | ||||
| 2026-01-30 | 13F | Sigma Planning Corp | 37.407 | 6,14 | 2.462 | 7,75 | ||||
| 2026-02-17 | 13F | Bank Of America Corp /de/ | Call | 0 | -100,00 | 0 | ||||
| 2026-01-21 | 13F | Sound Income Strategies, LLC | 1.632 | 1,30 | 106 | 0,00 | ||||
| 2026-01-20 | 13F | Cooksen Wealth, LLC | 17.413 | 1,76 | 1.149 | 3,52 | ||||
| 2026-02-18 | 13F | GWM Advisors LLC | 14.956 | -64,46 | 986 | -63,87 | ||||
| 2026-02-04 | 13F | Meridian Wealth Management, LLC | 9.008 | 594 | ||||||
| 2026-01-27 | 13F | TD Waterhouse Canada Inc. | 8.567 | 84,99 | 565 | 87,71 | ||||
| 2026-02-13 | 13F | Maia Wealth LLC | 4.091 | 0,84 | 253 | -7,69 | ||||
| 2026-01-22 | 13F | Bartlett & Co. Wealth Management Llc | 0 | -100,00 | 0 | |||||
| 2026-01-07 | 13F | Harbor Investment Advisory, Llc | 580 | 0,00 | 38 | 2,70 | ||||
| 2026-02-11 | 13F | J.Safra Asset Management Corp | 1.510.220 | 2,91 | 99.614 | 4,66 | ||||
| 2026-03-04 | 13F | SHP Wealth Management | 473 | 31 | ||||||
| 2026-02-13 | 13F | National Bank Of Canada /fi/ | 495 | 0,00 | 33 | 0,00 | ||||
| 2026-01-30 | 13F | Catalytic Wealth RIA, LLC | 9.718 | -4,17 | 641 | -2,44 | ||||
| 2026-02-13 | 13F | Ingalls & Snyder Llc | Put | 10.000 | 0,00 | 1 | ||||
| 2026-01-30 | 13F | Bogart Wealth, LLC | 535 | 18,10 | 35 | 20,69 | ||||
| 2026-02-17 | 13F | Advisory Services Network, LLC | 40.912 | 169,53 | 2.699 | 174,19 | ||||
| 2026-01-29 | 13F | IMC-Chicago, LLC | 66.589 | 4.392 | ||||||
| 2026-02-02 | 13F | Marks Wealth, LLC | 661.332 | 98,00 | 43.621 | 101,36 | ||||
| 2026-02-13 | 13F | Wells Fargo & Company/mn | 6 | -98,69 | 0 | -100,00 | ||||
| 2025-10-15 | 13F | Defined Financial Planning LLC | 0 | -100,00 | 0 | -100,00 | ||||
| 2026-02-12 | 13F | Jane Street Group, Llc | Call | 3.385.600 | 364,54 | 223.314 | 372,43 | |||
| 2026-02-17 | 13F | Ameriflex Group, Inc. | 0 | -100,00 | 0 | |||||
| 2026-02-13 | 13F | J Hagan Capital, Inc. | 0 | -100,00 | 0 | -100,00 | ||||
| 2026-02-12 | 13F | Jane Street Group, Llc | Put | 57.800 | -44,37 | 3.812 | -43,43 | |||
| 2026-04-08 | 13F | IMZ Advisory Inc | 146.752 | 5,60 | 8.503 | -7,24 | ||||
| 2026-01-14 | 13F | BCO Wealth Management LLC | 3.744 | 247 | ||||||
| 2026-01-30 | 13F | Spreng Capital Management, Inc. | 9.115 | 601 | ||||||
| 2026-02-05 | 13F | Berkeley Capital Partners, LLC | 0 | -100,00 | 0 | |||||
| 2026-02-18 | 13F | Garton & Associates Financial Advisors LLC | 82 | 5 | ||||||
| 2026-01-27 | 13F | Krilogy Financial LLC | 4.715 | -40,39 | 311 | -41,95 | ||||
| 2026-02-11 | 13F | Jpmorgan Chase & Co | 21.845 | -51,83 | 1.441 | -51,04 | ||||
| 2026-02-17 | 13F | Tower Research Capital LLC (TRC) | 110.199 | 7.269 | ||||||
| 2026-02-09 | 13F | Kingsview Wealth Management, LLC | 103.644 | 1.283,03 | 6.836 | 1.306,58 | ||||
| 2026-02-04 | 13F | Money Concepts Capital Corp | 1.180.856 | -2,60 | 77.889 | -0,95 | ||||
| 2026-02-05 | 13F | Allworth Financial LP | 0 | -100,00 | 0 | |||||
| 2025-11-14 | 13F | Wolverine Trading, Llc | Call | 124.400 | 31,50 | 8.059 | 53,28 | |||
| 2026-02-11 | 13F | Group One Trading, L.p. | 22.796 | -90,73 | 1.504 | -90,58 | ||||
| 2025-11-14 | 13F | Wolverine Trading, Llc | 6.222 | -65,69 | 403 | -59,98 | ||||
| 2026-04-07 | 13F | Farther Finance Advisors, LLC | 1.842 | -87,44 | 108 | -88,83 | ||||
| 2026-02-10 | 13F | Moors & Cabot, Inc. | 4.550 | -8,08 | 300 | -6,54 | ||||
| 2026-01-30 | 13F | Us Bancorp \de\ | 2.209 | 0,00 | 146 | 1,40 | ||||
| 2026-02-10 | 13F | Boxwood Ventures, Inc. | 12.000 | 0,00 | 792 | 1,67 | ||||
| 2026-01-22 | 13F | Glass Jacobson Investment Advisors llc | 0 | -100,00 | 0 | |||||
| 2026-02-05 | 13F | Cambridge Investment Research Advisors, Inc. | 173.490 | 6,98 | 11 | 10,00 | ||||
| 2026-02-13 | 13F | Headlands Technologies LLC | 0 | -100,00 | 0 | |||||
| 2026-02-12 | 13F | Hrt Financial Lp | 14.546 | -32,42 | 1 | -100,00 | ||||
| 2026-02-13 | 13F | Quartz Partners, LLC | 0 | -100,00 | 0 | |||||
| 2026-02-11 | 13F | Paragon Private Wealth Management, LLC | 48.686 | 11,04 | 3.211 | 12,94 | ||||
| 2026-04-02 | 13F | Noble Wealth Management PBC | 1.000 | 0,00 | 58 | -12,31 | ||||
| 2026-02-10 | 13F | Murphy & Mullick Capital Management Corp | 1.220 | 1,67 | 80 | 3,90 | ||||
| 2026-02-13 | 13F | MAI Capital Management | 183 | 20,39 | 12 | 33,33 | ||||
| 2026-02-13 | 13F | Centaurus Financial, Inc. | 13.196 | -60,02 | 1 | -100,00 | ||||
| 2026-02-13 | 13F | Visionary Wealth Advisors | 3.246 | 214 | ||||||
| 2026-01-06 | 13F | Unique Wealth, Llc | 8.103 | 15,89 | 534 | 17,88 | ||||
| 2026-02-11 | 13F | LPL Financial LLC | 187.091 | 0,26 | 12.341 | 1,97 | ||||
| 2026-02-17 | 13F | Captrust Financial Advisors | 9.415 | 19,34 | 621 | 21,53 | ||||
| 2026-02-06 | 13F | Kingdom Financial Group LLC. | 5.118 | 338 | ||||||
| 2026-02-12 | 13F | Scotia Capital Inc. | 22.671 | 1.495 | ||||||
| 2026-02-02 | 13F | Truist Financial Corp | 33.332 | 55,88 | 2.199 | 58,59 | ||||
| 2026-02-17 | 13F | Millennium Management Llc | 3.290 | 217 | ||||||
| 2026-02-06 | 13F | Creative Financial Designs Inc /adv | 78 | 0,00 | 5 | 0,00 | ||||
| 2026-02-13 | 13F | SRS Capital Advisors, Inc. | 3.394 | 224 | ||||||
| 2026-02-12 | 13F | Federation des caisses Desjardins du Quebec | 24.132 | 4,02 | 1.592 | 5,78 | ||||
| 2026-02-13 | 13F | Morgan Stanley | 86.002 | 63,55 | 5.673 | 66,33 | ||||
| 2026-02-03 | 13F | Legacy Wealth Managment, LLC/ID | 714 | 1,42 | 47 | 4,44 | ||||
| 2026-02-11 | 13F | Janney Montgomery Scott LLC | 32.115 | 44,83 | 2 | 100,00 | ||||
| 2026-02-13 | 13F | Marshall Wace, Llp | 0 | -100,00 | 0 | |||||
| 2026-01-29 | 13F | Concurrent Investment Advisors, LLC | 28.820 | 12,35 | 1.901 | 14,25 | ||||
| 2026-01-20 | 13F | Jackson Wealth Management, LLC | 53.534 | 6,24 | 3.531 | 8,05 | ||||
| 2026-02-17 | 13F | Raymond James Financial Inc | 14.309 | 110,80 | 944 | 114,32 | ||||
| 2026-01-26 | 13F | Mirae Asset Global Investments Co., Ltd. | 21.980 | 22,45 | 1.450 | 24,48 | ||||
| 2026-02-05 | 13F | Thrivent Financial For Lutherans | 145.400 | 10 | ||||||
| 2025-11-14 | 13F | Strategic Wealth Partners, Ltd. | 5.139 | 6,88 | 333 | 25,19 | ||||
| 2026-04-08 | 13F | Holos Integrated Wealth LLC | 2.250 | 131 | ||||||
| 2026-02-12 | 13F | Castleark Management Llc | 49.640 | 3.274 | ||||||
| 2026-01-26 | 13F | Iams Wealth Management, Llc | 8.216 | 6,22 | 542 | 7,98 | ||||
| 2026-02-04 | 13F | Anson Capital, Inc. | 4.443 | 0,00 | 293 | 1,74 |