Grundlæggende statistik
| Institutionelle ejere | 173 total, 173 long only, 0 short only, 0 long/short - change of 10,19% MRQ |
| Gennemsnitlig porteføljeallokering | 0.3595 % - change of -30,36% MRQ |
| Institutionelle aktier (lange) | 10.100.534 (ex 13D/G) - change of 1,81MM shares 22,03% MRQ |
| Institutionel værdi (lang) | $ 868.155 USD ($1000) |
Institutionelt ejerskab og aktionærer
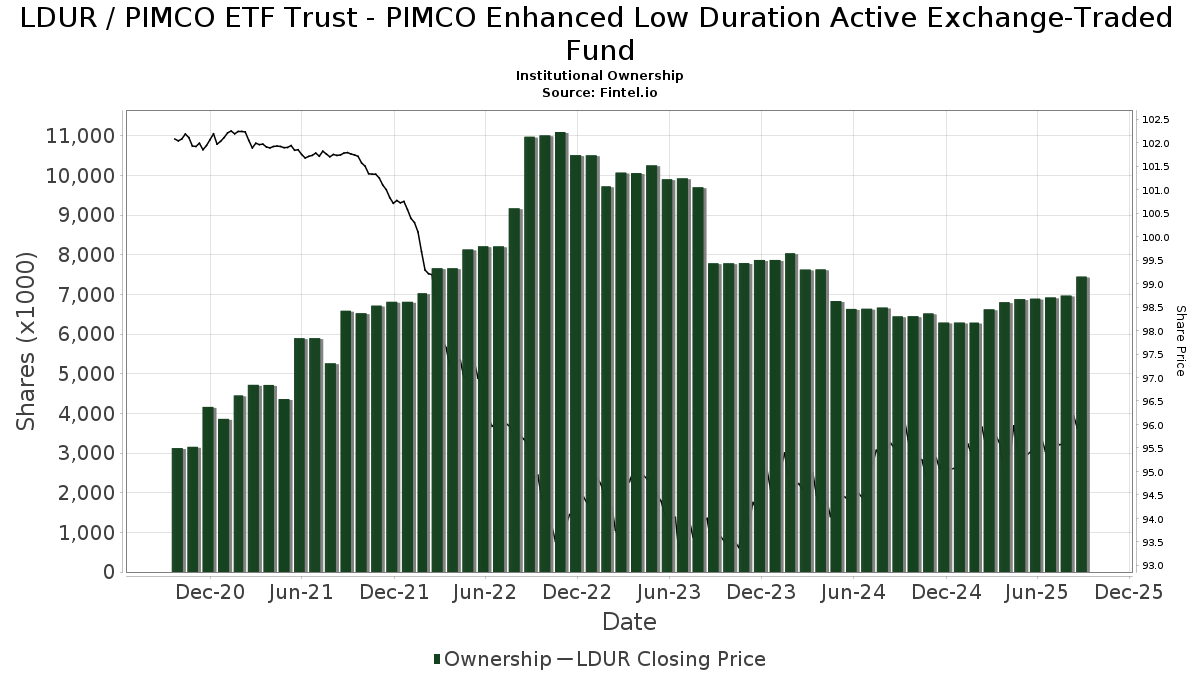
PIMCO ETF Trust - PIMCO Enhanced Low Duration Active Exchange-Traded Fund (US:LDUR) har 173 institutionelle ejere og aktionærer, der har indsendt 13D/G- eller 13F-formularer til Securities Exchange Commission (SEC). Disse institutioner har i alt 10,100,534 aktier. Største aktionærer omfatter Fmr Llc, Cwm, Llc, Advocacy Wealth Management Services, LLC, LPL Financial LLC, Wells Fargo & Company/mn, TD Capital Management LLC, Bank Of America Corp /de/, Morgan Stanley, Kelly Financial Group Llc, and Jpmorgan Chase & Co .
PIMCO ETF Trust - PIMCO Enhanced Low Duration Active Exchange-Traded Fund (ARCA:LDUR) institutionel ejerskabsstruktur viser aktuelle positioner i virksomheden efter institutioner og fonde, samt seneste ændringer i positionsstørrelse. Større aktionærer kan omfatte individuelle investorer, investeringsforeninger, hedgefonde eller institutioner. Skema 13D angiver, at investoren besidder (eller besidder) mere end 5 % af virksomheden og har til hensigt (eller har til hensigt at) aktivt at forfølge en ændring i forretningsstrategi. Skema 13G indikerer en passiv investering på over 5%.
The share price as of April 14, 2026 is 95,74 / share. Previously, on April 15, 2025, the share price was 95,42 / share. This represents an increase of 0,34% over that period.
Fondens stemningsscore
Fund Sentiment Score (fka Ownership Accumulation Score) finder de aktier, der bliver mest købt af fonde. Det er resultatet af en sofistikeret, multi-faktor kvantitativ model, der identificerer virksomheder med de højeste niveauer af institutionel akkumulering. Scoringsmodellen bruger en kombination af den samlede stigning i oplyste ejere, ændringerne i porteføljeallokeringer i disse ejere og andre målinger. Tallet går fra 0 til 100, hvor højere tal indikerer et højere niveau af akkumulering for sine jævnaldrende, og 50 er gennemsnittet.
Opdateringsfrekvens: Dagligt
Se Ownership Explorer, som giver en liste over højest rangerende virksomheder.
AI+ Ask Fintel’s AI assistant about PIMCO ETF Trust - PIMCO Enhanced Low Duration Active Exchange-Traded Fund.
Select a question to share a public post with an AI-crafted answer.
Thinking of good questions…
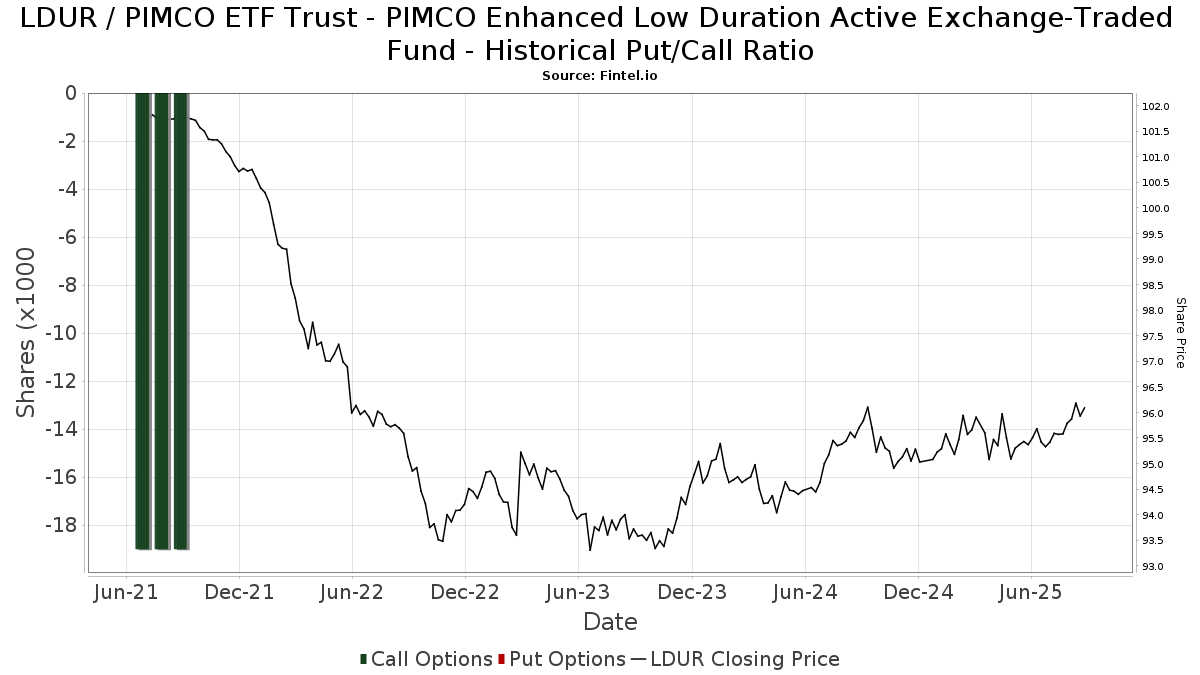
Institutionel Put/Call-forhold
Ud over at indberette standardaktie- og gældsudstedelser skal institutter med mere end 100 mill. aktiver under forvaltning også oplyse deres put- og call-optionsbeholdninger. Da salgsoptioner generelt indikerer negativ stemning, og købsoptioner indikerer positiv stemning, kan vi få en fornemmelse af den overordnede institutionelle stemning ved at plotte forholdet mellem put og kald. Diagrammet til højre viser det historiske put/call-forhold for dette instrument.
Brug af Put/Call Ratio som en indikator for investorernes stemning overvinder en af de vigtigste mangler ved at bruge totalt institutionelt ejerskab, som er, at en betydelig mængde af aktiver under forvaltning investeres passivt for at spore indekser. Passivt forvaltede fonde køber typisk ikke optioner, så indikatoren for put/call-forholdet følger mere nøje følelsen af aktivt forvaltede fonde.
13D/G-arkivering
Vi præsenterer 13D/G ansøgninger separat fra 13F ansøgninger på grund af den forskellige behandling af SEC. 13D/G-ansøgninger kan indgives af grupper af investorer (med én ledende), hvorimod 13F-ansøgninger ikke kan. Dette resulterer i situationer, hvor en investor kan indsende en 13D/G, der rapporterer én værdi for de samlede aktier (der repræsenterer alle de aktier, der ejes af investorgruppen), men derefter indsender en 13F, der rapporterer en anden værdi for de samlede aktier (der udelukkende repræsenterer deres egne) ejendomsret). Det betyder, at aktieejerskab af 13D/G-arkiver og 13F-arkiveringer ofte ikke er direkte sammenlignelige, så vi præsenterer dem separat.
Bemærk: Fra den 16. maj 2021 viser vi ikke længere ejere, der ikke har indsendt en 13D/G inden for det seneste år. Tidligere viste vi den fulde historie af 13D/G-arkiver. Generelt skal enheder, der er forpligtet til at indgive 13D/G-ansøgninger, indgive mindst årligt, før de indsender en afsluttende ansøgning. Dog forlader fonde nogle gange positioner uden at indsende en afsluttende ansøgning (dvs. de afvikler), så visning af den fulde historie resulterede nogle gange i forvirring om det nuværende ejerskab. For at undgå forvirring viser vi nu kun 'aktuelle' ejere - det vil sige - ejere, der har anmeldt inden for det seneste år.
Upgrade to unlock premium data.
13F og NPORT arkivering
Detaljer om 13F-arkivering er gratis. Detaljer om NP-ansøgninger kræver et premium-medlemskab. Grønne rækker angiver nye positioner. Røde rækker angiver lukkede positioner. Klik på linket ikon for at se den fulde transaktionshistorik.
Opgrader
for at låse premium-data op og eksportere til Excel ![]() .
.
| Fil dato | Kilde | Investor | Type | Gennemsnitlig pris (Øst) |
Aktier | Δ Aktier (%) |
Rapporteret Værdi ($1000) |
Δ Værdi (%) |
Port Alloc (%) |
|
|---|---|---|---|---|---|---|---|---|---|---|
| 2026-01-09 | 13F | Diversified Trust Co | 3.784 | -1,54 | 363 | -1,63 | ||||
| 2026-02-17 | 13F | Private Advisor Group, LLC | 13.339 | -25,77 | 1.280 | -25,94 | ||||
| 2026-02-05 | 13F | PAX Financial Group, LLC | 19.845 | -7,85 | 1.904 | -8,02 | ||||
| 2026-04-15 | 13F | Exchange Traded Concepts, Llc | 79.785 | 7.645 | ||||||
| 2026-02-09 | 13F | Syverson Strege & Co | 10.913 | 0,46 | 1.047 | 0,29 | ||||
| 2026-01-07 | 13F | Procyon Private Wealth Partners, LLC | 3.270 | 0,00 | 314 | -0,32 | ||||
| 2026-01-12 | 13F | Skyline Advisors, Inc. | 3.739 | 19,30 | 359 | 18,94 | ||||
| 2026-04-14 | 13F | Prospera Financial Services Inc | 5.590 | -33,15 | 536 | -33,25 | ||||
| 2026-02-09 | 13F | Huntington National Bank | 391 | -16,49 | ||||||
| 2025-11-05 | 13F | Key FInancial Inc | 0 | -100,00 | 0 | |||||
| 2026-01-23 | 13F | Clear Creek Financial Management, LLC | 5.825 | -65,23 | 559 | -65,34 | ||||
| 2026-01-30 | 13F | Sage Rhino Capital Llc | 26.589 | 0,32 | 2.551 | 0,12 | ||||
| 2026-04-13 | 13F | CGC Financial Services, LLC | 4.995 | 25,35 | 479 | 25,13 | ||||
| 2026-02-06 | 13F | Axxcess Wealth Management, Llc | 10.147 | 1,22 | 974 | 1,04 | ||||
| 2026-04-02 | 13F | Fulcrum Equity Management | 8.362 | 801 | ||||||
| 2025-11-05 | 13F | Moloney Securities Asset Management, LLC | 2.412 | -6,66 | 232 | -6,48 | ||||
| 2026-01-28 | 13F | Legacy Capital Group California, Inc. | 45.673 | -2,79 | 4.382 | -2,99 | ||||
| 2026-01-30 | 13F | Smart Portfolios, LLC | 3.277 | -59,96 | 314 | -60,05 | ||||
| 2026-02-24 | 13F | Barnes Wealth Management Group, Inc | 28.559 | 3,13 | 2.740 | 2,93 | ||||
| 2026-01-22 | 13F | Charter Capital Management, LLC\DE | 7.776 | 0,05 | 746 | -0,13 | ||||
| 2026-02-13 | 13F | Resources Investment Advisors, LLC. | 117.358 | -19,52 | 11.260 | -19,69 | ||||
| 2026-01-23 | 13F | Reuter James Wealth Management, Llc | 2.889 | -10,00 | 277 | -10,06 | ||||
| 2026-02-10 | 13F/A | Northwestern Mutual Wealth Management Co | 42.724 | 4.099 | ||||||
| 2026-01-30 | 13F | Wagner Wealth Management, Llc | 0 | -100,00 | 0 | |||||
| 2026-01-09 | 13F | Capital Asset Advisory Services LLC | 3.837 | 4,52 | 368 | 4,55 | ||||
| 2026-02-05 | 13F | Wealth Advisors of Iowa, LLC | 16.860 | 23,54 | 1.618 | 23,25 | ||||
| 2025-11-12 | 13F | Accredited Wealth Management, LLC | 2.700 | -51,07 | 606 | 14,58 | ||||
| 2026-01-27 | 13F | Greatmark Investment Partners, Inc. | 11.887 | -0,83 | 1.140 | -1,04 | ||||
| 2026-01-22 | 13F | Treasure Coast Financial Planning | 44.948 | 7,81 | 4.313 | 7,58 | ||||
| 2026-01-23 | 13F | Smith, Moore & Co. | 5.861 | 562 | ||||||
| 2026-02-17 | 13F | Cetera Investment Advisers | 27.231 | 3,00 | 2.613 | 2,79 | ||||
| 2026-02-11 | 13F | Parallel Advisors, LLC | 504 | 0,00 | 48 | 0,00 | ||||
| 2025-10-28 | 13F | First National Corp /ma/ /adv | 103.464 | 10,42 | 9.923 | 10,51 | ||||
| 2026-02-03 | 13F | We Are One Seven, LLC | 16.593 | -49,61 | 1.592 | -49,73 | ||||
| 2026-02-04 | 13F | Win Advisors, Inc | 0 | -100,00 | 0 | |||||
| 2026-02-17 | 13F | Advisor Group Holdings, Inc. | 47.645 | 5,90 | 4.573 | 5,59 | ||||
| 2026-04-09 | 13F | Kelly Financial Group Llc | 282.777 | 2,90 | 27.096 | 2,39 | ||||
| 2026-02-26 | 13F | TD Capital Management LLC | 431.360 | 0,83 | 41.387 | 0,62 | ||||
| 2025-10-30 | 13F | Wbh Advisory Inc | 0 | -100,00 | 0 | -100,00 | ||||
| 2026-02-17 | 13F | IHT Wealth Management, LLC | 11.543 | 1.107 | ||||||
| 2026-02-11 | 13F | Allianz Asset Management GmbH | 54 | 0,00 | 5 | 0,00 | ||||
| 2025-11-14 | 13F/A | NorthRock Partners, LLC | 0 | -100,00 | 0 | |||||
| 2026-04-01 | 13F | Financial Insights, Inc. | 2.269 | 218 | ||||||
| 2026-02-03 | 13F | Anfield Capital Management, LLC | 3.693 | 0,00 | 354 | -0,28 | ||||
| 2026-02-05 | 13F | Cambridge Investment Research Advisors, Inc. | 8.309 | 3,80 | 1 | |||||
| 2026-02-06 | 13F | Global Retirement Partners, LLC | 1.525 | -0,13 | 146 | 0,00 | ||||
| 2025-11-03 | 13F | SYM FINANCIAL Corp | 0 | -100,00 | 0 | |||||
| 2026-02-13 | 13F | National Bank Of Canada /fi/ | 500 | 48 | ||||||
| 2026-02-13 | 13F | Morgan Stanley | 337.435 | 3,55 | 32.375 | 3,33 | ||||
| 2026-01-21 | 13F | Mayfair Advisory Group, LLC | 6.078 | -2,42 | 583 | -2,51 | ||||
| 2026-01-26 | 13F | Nottingham Advisors, Inc. | 2.448 | -1,53 | 235 | -2,09 | ||||
| 2026-02-17 | 13F | RMB Capital Management, LLC | 12.805 | 148,21 | 1.233 | 149,09 | ||||
| 2026-01-27 | 13F | TD Waterhouse Canada Inc. | 4.360 | 418 | ||||||
| 2026-02-11 | 13F | Advocacy Wealth Management Services, LLC | 911.899 | 2,28 | 87.492 | 2,07 | ||||
| 2026-02-17 | 13F | Captrust Financial Advisors | 27.198 | -2,92 | 2.610 | -3,12 | ||||
| 2025-11-14 | 13F | Strategic Wealth Partners, Ltd. | 3.060 | 294 | ||||||
| 2026-02-03 | 13F | Capstone Triton Financial Group, LLC | 0 | -100,00 | 0 | |||||
| 2026-02-13 | 13F | MAI Capital Management | 0 | -100,00 | 0 | -100,00 | ||||
| 2026-01-23 | 13F | Assetmark, Inc | 1.154 | 2,03 | 111 | 1,85 | ||||
| 2026-02-06 | 13F | Aviance Capital Partners, LLC | 10.709 | -4,26 | 1.027 | -4,47 | ||||
| 2025-11-21 | 13F | Watts Gwilliam & Co., LLC | 3.845 | 370 | ||||||
| 2026-02-17 | 13F | Susquehanna International Group, Llp | 7.379 | 708 | ||||||
| 2026-02-05 | 13F | Stephens Inc /ar/ | 6.125 | 0,00 | 588 | -0,17 | ||||
| 2026-01-15 | 13F | Lodestone Wealth Management LLC | 208 | 20 | ||||||
| 2026-01-30 | 13F | Caldwell Securities, Inc | 5.695 | -10,37 | 546 | -10,49 | ||||
| 2026-02-14 | 13F | Rockefeller Capital Management L.P. | 378 | 36 | ||||||
| 2026-02-12 | 13F | Commonwealth Equity Services, Llc | 41.780 | -2,33 | 4.009 | 100.100,00 | ||||
| 2026-02-02 | 13F | Truist Financial Corp | 2.296 | 220 | ||||||
| 2026-02-03 | 13F | Patten & Patten Inc/tn | 20.031 | 0,73 | 1.922 | 0,52 | ||||
| 2026-01-23 | 13F | Halbert Hargrove Global Advisors, Llc | 4.708 | 17,88 | 452 | 17,75 | ||||
| 2026-01-27 | 13F | PFG Advisors | 23.671 | -7,88 | 2.271 | -8,06 | ||||
| 2026-01-12 | 13F | World Equity Group, Inc. | 0 | -100,00 | 0 | |||||
| 2026-01-28 | 13F | Bedel Financial Consulting, Inc. | 2.841 | 0,00 | 273 | -0,37 | ||||
| 2026-01-29 | 13F | Concurrent Investment Advisors, LLC | 8.798 | 5,04 | 844 | 4,84 | ||||
| 2026-02-11 | 13F | Omnitrust Wealth Management, Inc | 12.388 | 1.189 | ||||||
| 2026-02-11 | 13F | LPL Financial LLC | 597.089 | 38,61 | 57.288 | 38,32 | ||||
| 2026-01-22 | 13F | Networth Advisors, LLC | 27 | 3 | ||||||
| 2026-02-17 | 13F | Imprint Wealth LLC | 11 | -50,00 | 1 | -50,00 | ||||
| 2026-04-14 | 13F | Wealthcare Advisory Partners LLC | 9.428 | 2,32 | 903 | 2,15 | ||||
| 2026-01-21 | 13F | Raleigh Capital Management Inc. | 3.707 | 4,25 | 356 | 4,11 | ||||
| 2026-02-04 | 13F | AIFG Consultants Ltd. | 42.954 | -0,18 | 4.121 | -0,39 | ||||
| 2026-02-13 | 13F | Citigroup Inc | 2.122 | 0,00 | 204 | -0,49 | ||||
| 2026-02-03 | 13F | RFG Advisory, LLC | 8.701 | 13,12 | 835 | 12,86 | ||||
| 2026-02-09 | 13F | Kestra Investment Management, LLC | 2.284 | 1,42 | 219 | 1,39 | ||||
| 2026-02-09 | 13F | IPG Investment Advisors LLC | 2.743 | 0,00 | 264 | 0,38 | ||||
| 2025-10-22 | 13F | Gries Financial Llc | 2.259 | 217 | ||||||
| 2026-02-13 | 13F | Colony Group, LLC | 14.223 | 1.365 | ||||||
| 2026-02-17 | 13F | Opus Financial Solutions LLC | 3.534 | 339 | ||||||
| 2026-02-13 | 13F | Flow Traders U.s. Llc | 22.063 | -5,21 | 2 | 0,00 | ||||
| 2026-02-06 | 13F | HighTower Advisors, LLC | 139.715 | 1,33 | 13.405 | 1,12 | ||||
| 2026-02-10 | 13F | Goldman Sachs Group Inc | 14.126 | 1.355 | ||||||
| 2026-02-17 | 13F | Bank Of America Corp /de/ | 408.334 | 6,37 | 39.178 | 6,15 | ||||
| 2026-04-13 | 13F | Wolff Wiese Magana Llc | 176 | 17 | ||||||
| 2026-02-09 | 13F | Morris Financial Concepts, Inc. | 236 | -3,67 | 23 | -4,35 | ||||
| 2026-02-13 | 13F | Stifel Financial Corp | 11.636 | -2,72 | 1.116 | -2,96 | ||||
| 2026-01-26 | 13F | O'Connor Financial Group LLC | 231.409 | 5,28 | 22.236 | 5,22 | ||||
| 2026-01-30 | 13F | SOL Capital Management CO | 19.005 | 2 | ||||||
| 2026-02-04 | 13F | BankPlus Wealth Management LLC | 14.750 | 41,08 | 1.415 | 40,80 | ||||
| 2026-02-03 | 13F | Sequoia Financial Advisors, LLC | 3.534 | -2,54 | 339 | -2,59 | ||||
| 2026-02-13 | 13F | Motiv8 Investments LLC | 552 | 0 | ||||||
| 2026-04-07 | 13F | Farther Finance Advisors, LLC | 24.721 | 24,31 | 2.359 | 23,64 | ||||
| 2026-02-05 | 13F | SkyOak Wealth, LLC | 43.064 | 4,45 | 4.132 | 4,21 | ||||
| 2026-02-12 | 13F | Steward Partners Investment Advisory, Llc | 80 | 0,00 | 8 | 0,00 | ||||
| 2026-02-09 | 13F | Harbour Investments, Inc. | 651 | 0,77 | 62 | 0,00 | ||||
| 2026-04-13 | 13F | Thayer Financial, L.L.C. | 4.358 | -0,64 | 418 | -0,71 | ||||
| 2025-11-14 | 13F | Great Valley Advisor Group, Inc. | 0 | -100,00 | 0 | -100,00 | ||||
| 2026-01-30 | 13F | Caldwell Trust Co | 54 | 0,00 | 5 | 0,00 | ||||
| 2026-02-09 | 13F | Hartland & Co., LLC | 0 | -100,00 | 0 | |||||
| 2026-02-11 | 13F | Howard Bailey Securities, Llc | 3.095 | -16,67 | 297 | -17,09 | ||||
| 2026-01-30 | 13F | Sigma Planning Corp | 2.395 | -9,14 | 230 | -9,49 | ||||
| 2025-11-10 | 13F | EverSource Wealth Advisors, LLC | 0 | -100,00 | 0 | -100,00 | ||||
| 2026-02-17 | 13F | Signature Equity Partners, LLC | 920 | 88 | ||||||
| 2026-02-12 | 13F | Sand Hill Global Advisors, LLC | 14.149 | 8,53 | 1.358 | 8,30 | ||||
| 2025-10-22 | 13F | OneAscent Financial Services LLC | 0 | -100,00 | 0 | |||||
| 2026-01-16 | 13F | Legacy Capital Wealth Partners, LLC | 17.638 | -1,33 | 1.692 | -1,51 | ||||
| 2026-02-06 | 13F | Lloyd Advisory Services, LLC. | 3.298 | 31,81 | 316 | 31,67 | ||||
| 2026-04-07 | 13F | CoreCap Advisors, LLC | 85.941 | 8.235 | ||||||
| 2026-01-27 | 13F | Krilogy Financial LLC | 8.212 | -29,37 | 789 | -29,11 | ||||
| 2026-01-29 | 13F | Comerica Bank | 4.337 | -28,80 | 416 | -28,89 | ||||
| 2025-11-12 | 13F | Ameriflex Group, Inc. | 0 | -100,00 | 0 | |||||
| 2026-03-03 | 13F | NWF Advisory Services Inc. | 5.568 | 20,96 | 534 | 20,81 | ||||
| 2026-04-10 | 13F | Abound Wealth Management | 15 | 1 | ||||||
| 2025-11-14 | 13F | Capital Analysts, Inc. | 0 | -100,00 | 0 | |||||
| 2026-01-27 | 13F | Financial Management Professionals, Inc. | 811 | 0,00 | 78 | 1,30 | ||||
| 2026-01-20 | 13F | Hanson & Doremus Investment Management | 190 | 0,00 | 0 | |||||
| 2026-02-13 | 13F | Mariner, LLC | 15.025 | -37,68 | 1.442 | -37,81 | ||||
| 2026-02-17 | 13F | Wiley Bros.-aintree Capital, Llc | 11.108 | -0,89 | 1.066 | -0,37 | ||||
| 2026-02-17 | 13F | Raymond James Financial Inc | 55.591 | -17,33 | 5.334 | -17,51 | ||||
| 2026-04-13 | 13F | IFP Advisors, Inc | 42.764 | 32,93 | 4.098 | 32,76 | ||||
| 2026-02-12 | 13F | Bank Of Montreal /can/ | 415 | -12,26 | 40 | -13,33 | ||||
| 2026-01-23 | 13F | Diversify Advisory Services, LLC | 5.568 | 535 | ||||||
| 2026-01-21 | 13F | Capital Advisors, Ltd. LLC | 5.057 | 0,00 | 0 | |||||
| 2026-02-11 | 13F | Outlook Wealth Advisors, LLC | 3.075 | -2,66 | 295 | -2,64 | ||||
| 2026-02-10 | 13F | Envestnet Asset Management Inc | 191.440 | -12,13 | 18.368 | -12,31 | ||||
| 2026-02-13 | 13F | Integrated Wealth Concepts LLC | 15.921 | -21,70 | 1.527 | -21,89 | ||||
| 2026-02-19 | 13F | CI Private Wealth, LLC | 8.473 | 32,70 | 814 | 32,79 | ||||
| 2026-02-13 | 13F | SRS Capital Advisors, Inc. | 507 | 49 | ||||||
| 2026-01-21 | 13F | Future Financial Wealth Managment LLC | 0 | -100,00 | 0 | |||||
| 2026-02-06 | 13F | Cedar Wealth Management, LLC | 1.464 | -32,47 | 140 | -32,69 | ||||
| 2026-02-13 | 13F | Tobias Financial Advisors, Inc. | 2.643 | 1,07 | 254 | 0,80 | ||||
| 2026-01-23 | 13F | Valley National Advisers Inc | 59.728 | 15,74 | 6 | 25,00 | ||||
| 2026-01-16 | 13F | Crewe Advisors LLC | 100 | 0,00 | 10 | 0,00 | ||||
| 2026-02-17 | 13F | Mercer Global Advisors Inc /adv | 9.480 | 0,34 | 910 | 0,11 | ||||
| 2026-01-20 | 13F | Austin Private Wealth, LLC | 0 | -100,00 | 0 | -100,00 | ||||
| 2026-02-10 | 13F | Bank of New York Mellon Corp | 4.250 | -14,56 | 408 | -14,85 | ||||
| 2026-02-10 | 13F | Avestar Capital, LLC | 16.826 | 4,48 | 1.620 | 4,65 | ||||
| 2025-11-07 | 13F | Signet Financial Management, Llc | 0 | -100,00 | 0 | -100,00 | ||||
| 2026-04-08 | 13F | Wealth Enhancement Advisory Services, Llc | 105.698 | -45,16 | 10.090 | -45,48 | ||||
| 2026-02-17 | 13F | Advisory Services Network, LLC | 0 | -100,00 | 0 | |||||
| 2026-02-06 | 13F | Signature Estate & Investment Advisors Llc | 4.421 | -15,71 | 424 | -15,87 | ||||
| 2025-11-07 | 13F | Pnc Financial Services Group, Inc. | 0 | -100,00 | 0 | |||||
| 2026-04-14 | 13F | Howland Capital Management Llc | 70.446 | 3,64 | 6.750 | 3,18 | ||||
| 2026-02-04 | 13F | American Institute for Advanced Investment Management, LLP | 4.573 | 8,29 | 439 | 7,88 | ||||
| 2026-04-14 | 13F | Opal Wealth Advisors, LLC | 351 | 34 | ||||||
| 2026-02-03 | 13F | International Assets Investment Management, Llc | 31 | 3 | ||||||
| 2026-02-10 | 13F | Keyvantage Wealth, Llc | 6.624 | -1,31 | 636 | -1,55 | ||||
| 2026-02-13 | 13F | Sofos Investments, Inc. | 801 | -6,43 | 77 | -7,32 | ||||
| 2026-02-17 | 13F | Warren Averett Asset Management, LLC | 9.528 | -5,39 | 914 | -5,58 | ||||
| 2026-02-12 | 13F | Mark Sheptoff Financial Planning, Llc | 75 | 0,00 | 7 | 0,00 | ||||
| 2026-02-17 | 13F | Royal Bank Of Canada | 156.502 | 76,75 | 15.016 | 76,37 | ||||
| 2026-02-11 | 13F | Manchester Capital Management LLC | 93 | 9 | ||||||
| 2026-02-13 | 13F | Change Path, LLC | 31.631 | 4,53 | 3.035 | 4,30 | ||||
| 2026-02-10 | 13F | Beckerman Institutional, LLC | 54.923 | -18,63 | 5.269 | -18,80 | ||||
| 2025-11-06 | 13F | Ameritas Advisory Services, LLC | 0 | -100,00 | 0 | -100,00 | ||||
| 2026-01-22 | 13F | CarsonAllaria Wealth Management, Ltd. | 62.645 | 13,54 | 6.010 | 13,31 | ||||
| 2026-04-08 | 13F | Dynamic Advisor Solutions LLC | 70.161 | 3,40 | 6.723 | 3,26 | ||||
| 2026-02-09 | 13F | Clear Investment Research, Llc | 0 | -100,00 | 0 | |||||
| 2026-02-13 | 13F | Ausdal Financial Partners, Inc. | 6.518 | -5,07 | 625 | -5,30 | ||||
| 2026-01-29 | 13F | UBS Group AG | 119.578 | -39,04 | 11.473 | -39,17 | ||||
| 2026-02-18 | 13F | GWM Advisors LLC | 27.242 | 13,54 | 2.614 | 13,31 | ||||
| 2026-01-26 | 13F | Cwm, Llc | 939.933 | 1,74 | 90 | 2,27 | ||||
| 2026-01-28 | 13F | Geneos Wealth Management Inc. | 1.654 | -49,17 | 159 | -49,36 | ||||
| 2026-02-11 | 13F | Gateway Wealth Partners, LLC | 79.729 | 0,52 | 7.650 | 0,31 | ||||
| 2026-04-14 | 13F | XY Planning Network, Inc. | 2.213 | 211 | ||||||
| 2026-02-06 | 13F | Kingdom Financial Group LLC. | 287 | 28 | ||||||
| 2026-02-05 | 13F | Atria Investments Llc | 55.354 | -1,35 | 5.311 | -1,56 | ||||
| 2026-01-29 | 13F | Sanctuary Advisors, LLC | 4.178 | -2,22 | 401 | -2,44 | ||||
| 2026-02-17 | 13F | Fmr Llc | 1.821.453 | 174.759 | ||||||
| 2026-01-29 | 13F | Quest 10 Wealth Builders, Inc. | 593 | -1,66 | 57 | -1,75 | ||||
| 2026-02-13 | 13F | Brown Advisory Inc | 36.179 | -3,48 | 3.471 | -3,66 | ||||
| 2026-01-26 | 13F | AE Wealth Management LLC | 19.989 | -2,82 | 1.918 | -3,03 | ||||
| 2026-01-26 | 13F | Tribridge Partners Financial LLC | 3.027 | 290 | ||||||
| 2026-02-10 | 13F | Essex Financial Services, Inc. | 49.110 | 9,69 | 4.712 | 9,46 | ||||
| 2026-01-12 | 13F | DAVENPORT & Co LLC | 7.184 | 0,00 | 689 | -0,14 | ||||
| 2026-02-13 | 13F | Visionary Wealth Advisors | 68.459 | 252,72 | 6.568 | 251,98 | ||||
| 2026-02-17 | 13F | GeoWealth Management, LLC | 16.508 | -9,15 | 1.584 | -9,34 | ||||
| 2026-02-17 | 13F | Citadel Advisors Llc | 30.681 | 2.944 | ||||||
| 2026-02-11 | 13F | MCF Advisors LLC | 6.427 | 619 | ||||||
| 2026-02-05 | 13F | Compass Financial Group, Inc. | 12.841 | -5,18 | 1.232 | -5,30 | ||||
| 2026-02-13 | 13F | Wells Fargo & Company/mn | 543.802 | -7,56 | 52.175 | -7,75 | ||||
| 2026-02-11 | 13F | Jpmorgan Chase & Co | 278.513 | 3,78 | 26.722 | 3,57 | ||||
| 2026-02-13 | 13F | Kestra Advisory Services, LLC | 0 | -100,00 | 0 | |||||
| 2026-02-17 | 13F | Jones Financial Companies Lllp | 20.932 | 449,68 | 2.008 | 450,14 | ||||
| 2026-02-12 | 13F | Jane Street Group, Llc | 13.333 | 76,46 | 1.279 | 76,17 | ||||
| 2026-01-23 | 13F | Family Investment Center, Inc. | 22.049 | 14,56 | 2.115 | 14,32 | ||||
| 2025-10-15 | 13F | JGP Wealth Management, LLC | 0 | -100,00 | 0 | |||||
| 2026-02-13 | 13F | Mml Investors Services, Llc | 4.976 | 72,90 | 477 | 72,83 | ||||
| 2026-02-20 | 13F | Kovitz Investment Group Partners, LLC | 0 | -100,00 | 0 | |||||
| 2026-02-12 | 13F | Beacon Capital Management, Inc. | 178.039 | -30,27 | 17.082 | -30,42 |