Grundlæggende statistik
| Institutionelle aktier (lange) | 76.311.823 - 68,82% (ex 13D/G) - change of -4,90MM shares -6,03% MRQ |
| Institutionel værdi (lang) | $ 3.332.201 USD ($1000) |
Institutionelt ejerskab og aktionærer
Hut 8 Corp. (US:HUT) har 330 institutionelle ejere og aktionærer, der har indsendt 13D/G- eller 13F-formularer til Securities Exchange Commission (SEC). Disse institutioner har i alt 76,311,823 aktier. Største aktionærer omfatter BlackRock, Inc., Vanguard Group Inc, Susquehanna International Group, Llp, Susquehanna International Group, Llp, SRS Investment Management, LLC, Sachem Head Capital Management LP, Citadel Advisors Llc, Value Aligned Research Advisors, LLC, Geode Capital Management, Llc, and State Street Corp .
Hut 8 Corp. (NasdaqGS:HUT) institutionel ejerskabsstruktur viser aktuelle positioner i virksomheden efter institutioner og fonde, samt seneste ændringer i positionsstørrelse. Større aktionærer kan omfatte individuelle investorer, investeringsforeninger, hedgefonde eller institutioner. Skema 13D angiver, at investoren besidder (eller besidder) mere end 5 % af virksomheden og har til hensigt (eller har til hensigt at) aktivt at forfølge en ændring i forretningsstrategi. Skema 13G indikerer en passiv investering på over 5%.
The share price as of April 13, 2026 is 69,76 / share. Previously, on April 14, 2025, the share price was 12,10 / share. This represents an increase of 476,53% over that period.

Fondens stemningsscore
Fund Sentiment Score (fka Ownership Accumulation Score) finder de aktier, der bliver mest købt af fonde. Det er resultatet af en sofistikeret, multi-faktor kvantitativ model, der identificerer virksomheder med de højeste niveauer af institutionel akkumulering. Scoringsmodellen bruger en kombination af den samlede stigning i oplyste ejere, ændringerne i porteføljeallokeringer i disse ejere og andre målinger. Tallet går fra 0 til 100, hvor højere tal indikerer et højere niveau af akkumulering for sine jævnaldrende, og 50 er gennemsnittet.
Opdateringsfrekvens: Dagligt
Se Ownership Explorer, som giver en liste over højest rangerende virksomheder.
AI+ Ask Fintel’s AI assistant about Hut 8 Corp..
Select a question to share a public post with an AI-crafted answer.
Thinking of good questions…
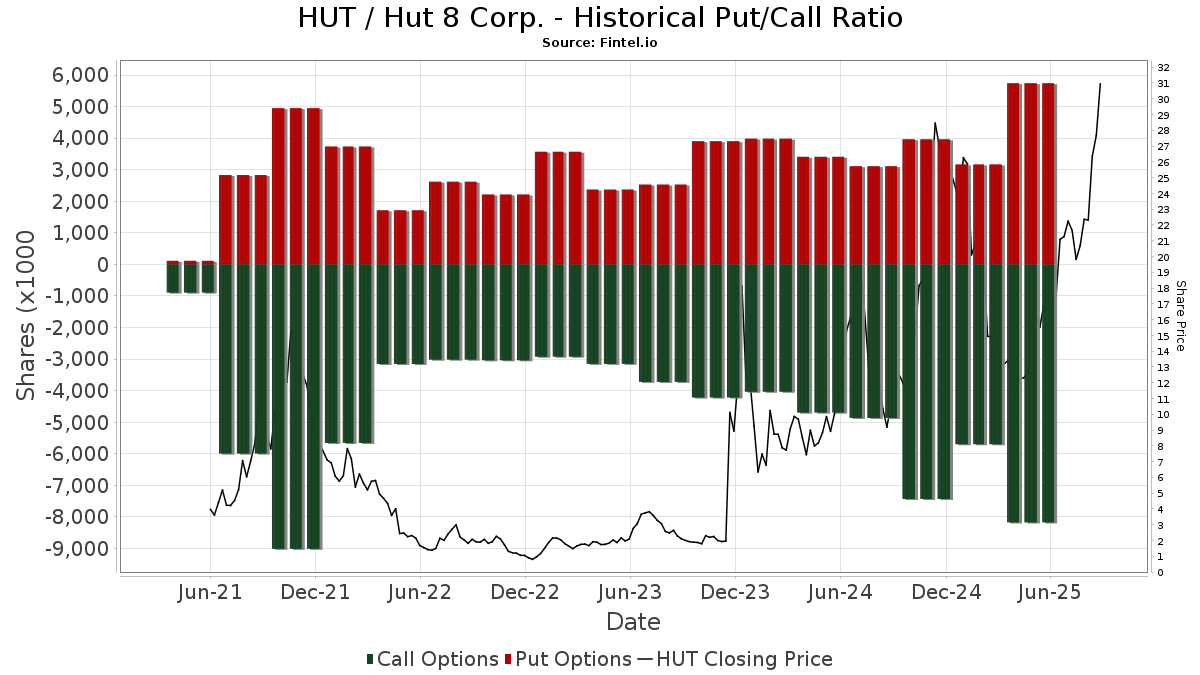
Institutionel Put/Call-forhold
Ud over at indberette standardaktie- og gældsudstedelser skal institutter med mere end 100 mill. aktiver under forvaltning også oplyse deres put- og call-optionsbeholdninger. Da salgsoptioner generelt indikerer negativ stemning, og købsoptioner indikerer positiv stemning, kan vi få en fornemmelse af den overordnede institutionelle stemning ved at plotte forholdet mellem put og kald. Diagrammet til højre viser det historiske put/call-forhold for dette instrument.
Brug af Put/Call Ratio som en indikator for investorernes stemning overvinder en af de vigtigste mangler ved at bruge totalt institutionelt ejerskab, som er, at en betydelig mængde af aktiver under forvaltning investeres passivt for at spore indekser. Passivt forvaltede fonde køber typisk ikke optioner, så indikatoren for put/call-forholdet følger mere nøje følelsen af aktivt forvaltede fonde.
13D/G-arkivering
Vi præsenterer 13D/G ansøgninger separat fra 13F ansøgninger på grund af den forskellige behandling af SEC. 13D/G-ansøgninger kan indgives af grupper af investorer (med én ledende), hvorimod 13F-ansøgninger ikke kan. Dette resulterer i situationer, hvor en investor kan indsende en 13D/G, der rapporterer én værdi for de samlede aktier (der repræsenterer alle de aktier, der ejes af investorgruppen), men derefter indsender en 13F, der rapporterer en anden værdi for de samlede aktier (der udelukkende repræsenterer deres egne) ejendomsret). Det betyder, at aktieejerskab af 13D/G-arkiver og 13F-arkiveringer ofte ikke er direkte sammenlignelige, så vi præsenterer dem separat.
Bemærk: Fra den 16. maj 2021 viser vi ikke længere ejere, der ikke har indsendt en 13D/G inden for det seneste år. Tidligere viste vi den fulde historie af 13D/G-arkiver. Generelt skal enheder, der er forpligtet til at indgive 13D/G-ansøgninger, indgive mindst årligt, før de indsender en afsluttende ansøgning. Dog forlader fonde nogle gange positioner uden at indsende en afsluttende ansøgning (dvs. de afvikler), så visning af den fulde historie resulterede nogle gange i forvirring om det nuværende ejerskab. For at undgå forvirring viser vi nu kun 'aktuelle' ejere - det vil sige - ejere, der har anmeldt inden for det seneste år.
Upgrade to unlock premium data.
| Fil dato | Form | Investor | Forrige Aktier |
Seneste Aktier |
Δ Aktier (Procent) |
Ejendomsret (Procent) |
Δ Ejerskab (Procent) |
|
|---|---|---|---|---|---|---|---|---|
| 2026-03-06 | LONE PINE CAPITAL LLC | 6,185,544 | 5.60 | |||||
| 2026-02-02 | JANE STREET GROUP, LLC | 5,308,617 | 2,183,885 | -58.86 | 2.00 | -60.00 | ||
| 2025-11-13 | SUSQUEHANNA SECURITIES, LLC | 5,644,581 | 5.30 |
13F og NPORT arkivering
Detaljer om 13F-arkivering er gratis. Detaljer om NP-ansøgninger kræver et premium-medlemskab. Grønne rækker angiver nye positioner. Røde rækker angiver lukkede positioner. Klik på linket ikon for at se den fulde transaktionshistorik.
Opgrader
for at låse premium-data op og eksportere til Excel ![]() .
.
| Fil dato | Kilde | Investor | Type | Gennemsnitlig pris (Øst) |
Aktier | Δ Aktier (%) |
Rapporteret Værdi ($1000) |
Δ Værdi (%) |
Port Alloc (%) |
|
|---|---|---|---|---|---|---|---|---|---|---|
| 2026-02-13 | 13F | Caxton Associates Llp | 0 | -100,00 | 0 | -100,00 | ||||
| 2025-11-21 | 13F | Bell Investment Advisors, Inc | 0 | -100,00 | 0 | |||||
| 2026-02-17 | 13F | Beartown Capital Management, LLC | 260.000 | 11.944 | ||||||
| 2025-11-14 | 13F | Two Sigma Advisers, Lp | 0 | -100,00 | 0 | -100,00 | ||||
| 2026-02-12 | 13F | Groupe la Francaise | 0 | -100,00 | 0 | |||||
| 2026-02-17 | 13F | Silvercrest Asset Management Group Llc | 0 | -100,00 | 0 | |||||
| 2025-12-09 | 13F/A | Tudor Investment Corp Et Al | Call | 0 | -100,00 | 0 | -100,00 | |||
| 2026-02-17 | 13F | Abel Hall, LLC | 4.719 | 217 | ||||||
| 2026-02-17 | 13F | CastleKnight Management LP | 544.700 | -24,61 | 25.024 | -0,50 | ||||
| 2026-01-30 | 13F/A | M&t Bank Corp | 4.422 | 203 | ||||||
| 2026-01-26 | 13F | KBC Group NV | 3.379 | 0,00 | 0 | |||||
| 2026-02-17 | 13F | Greenland Capital Management LP | 11.042 | 507 | ||||||
| 2026-02-10 | 13F | Thames Capital Management Llc | 528.246 | -26,69 | 24.268 | -3,25 | ||||
| 2026-02-17 | 13F | Caption Management, LLC | Call | 552.700 | -41,18 | 25.391 | -22,38 | |||
| 2026-02-13 | 13F | Morgan Stanley | 739.649 | -42,81 | 33.979 | -24,52 | ||||
| 2026-02-17 | 13F | Caption Management, LLC | Put | 54.500 | -51,56 | 2.504 | -36,08 | |||
| 2026-02-12 | 13F | Commonwealth Equity Services, Llc | 6.869 | 316 | ||||||
| 2025-11-06 | 13F | Financial Advocates Investment Management | Put | 0 | -100,00 | 0 | -100,00 | |||
| 2025-11-06 | 13F | Financial Advocates Investment Management | 0 | -100,00 | 0 | -100,00 | ||||
| 2026-02-13 | 13F | Marshall Wace, Llp | 367.063 | 16.863 | ||||||
| 2026-02-10 | 13F | Root Financial Partners, LLC | 79 | 4 | ||||||
| 2026-02-11 | 13F | Winton Capital Group Ltd | 83.400 | 109,55 | 3.831 | 176,61 | ||||
| 2026-02-12 | 13F | Advisors Asset Management, Inc. | 1.607 | -0,86 | 74 | 30,36 | ||||
| 2026-02-17 | 13F | Delta Global Management LP | 253.958 | 66,91 | 11.667 | 120,28 | ||||
| 2026-01-30 | 13F | Activest Wealth Management | 1.069 | 49 | ||||||
| 2026-02-13 | 13F | Thomist Capital Management, LP | 13.600 | 629 | ||||||
| 2026-02-12 | 13F | SWAN Capital LLC | 15 | 0,00 | 1 | |||||
| 2026-02-10 | 13F | Bank of New York Mellon Corp | 350.949 | 20,92 | 16.123 | 59,58 | ||||
| 2026-02-12 | 13F | State Board Of Administration Of Florida Retirement System | 17.190 | 0,00 | 790 | 31,94 | ||||
| 2026-02-13 | 13F | Sei Investments Co | 79.219 | 397,48 | 3.639 | 556,86 | ||||
| 2025-11-14 | 13F | Raymond James Financial Inc | 0 | -100,00 | 0 | -100,00 | ||||
| 2026-02-13 | 13F | Truvestments Capital Llc | 42 | 0,00 | 2 | 0,00 | ||||
| 2026-02-17 | 13F | CastleKnight Management LP | Call | 420.000 | -30,00 | 19.295 | -7,62 | |||
| 2026-02-17 | 13F | Toronto Dominion Bank | 9.926 | -93,36 | 457 | -91,24 | ||||
| 2026-02-17 | 13F | Prelude Capital Management, Llc | 19.727 | -85,11 | 906 | -80,35 | ||||
| 2026-02-10 | 13F | Rothschild Investment Llc | 168 | 1,82 | 8 | 40,00 | ||||
| 2026-02-13 | 13F | Walleye Trading LLC | 214.766 | 66,13 | 9.866 | 119,24 | ||||
| 2026-02-13 | 13F | Walleye Trading LLC | Put | 466.000 | 174,93 | 21.408 | 262,85 | |||
| 2026-02-13 | 13F | Walleye Trading LLC | Call | 194.400 | 6,52 | 8.931 | 40,59 | |||
| 2026-02-13 | 13F | Parkside Financial Bank & Trust | 106 | 0,00 | 5 | 33,33 | ||||
| 2026-02-17 | 13F | Mercer Global Advisors Inc /adv | 0 | -100,00 | 0 | |||||
| 2025-11-14 | 13F | Nomura Holdings Inc | Call | 0 | -100,00 | 0 | -100,00 | |||
| 2026-02-17 | 13F | Brevan Howard Capital Management LP | 60.000 | 2.756 | ||||||
| 2026-02-17 | 13F | Qube Research & Technologies Ltd | 336.089 | 1.286,28 | 15.440 | 1.731,44 | ||||
| 2026-02-17 | 13F | Millennium Management Llc | Call | 25.000 | -73,15 | 1.148 | -64,57 | |||
| 2026-03-20 | 13F | Purpose Unlimited Inc. | 3.000 | 138 | ||||||
| 2026-02-17 | 13F | Millennium Management Llc | 826.839 | -37,25 | 37.985 | -17,19 | ||||
| 2026-02-17 | 13F | Murchinson Ltd. | 0 | -100,00 | 0 | |||||
| 2026-02-13 | 13F | Dockside LLC | 20.609 | 947 | ||||||
| 2026-02-17 | 13F | Vennlight Capital Management, LP | 0 | -100,00 | 0 | |||||
| 2026-02-10 | 13F | Zweig-DiMenna Associates LLC | 672.750 | -4,84 | 30.906 | 25,58 | ||||
| 2025-11-13 | 13F | Triton Wealth Management, PLLC | 0 | -100,00 | 0 | -100,00 | ||||
| 2026-02-03 | 13F | Legacy Wealth Managment, LLC/ID | 28 | 0,00 | 1 | |||||
| 2026-02-17 | 13F | Sender Co & Partners, Inc. | 0 | -100,00 | 0 | |||||
| 2026-02-17 | 13F | Artisan Partners Limited Partnership | Call | 0 | -100,00 | 0 | ||||
| 2026-02-17 | 13F | Clearline Capital LP | 116.200 | 5.338 | ||||||
| 2026-02-06 | 13F | Leonteq Securities AG | 5.550 | 23,61 | 350 | 61,29 | ||||
| 2026-02-10 | 13F | CIBC World Markets Inc. | 35.410 | 372,57 | 1.627 | 525,38 | ||||
| 2026-02-18 | 13F | GWM Advisors LLC | 6.510 | 188,44 | 299 | 283,33 | ||||
| 2026-02-19 | 13F | CI Private Wealth, LLC | 4.423 | 203 | ||||||
| 2026-02-17 | 13F | SIG North Trading, ULC | Put | 124.000 | 12,22 | 5.697 | 48,10 | |||
| 2026-02-17 | 13F | SIG North Trading, ULC | Call | 263.500 | 14,76 | 12.105 | 51,46 | |||
| 2025-11-14 | 13F | Bayesian Capital Management, LP | 0 | -100,00 | 0 | |||||
| 2026-02-17 | 13F | SIG North Trading, ULC | 6.202 | 285 | ||||||
| 2025-11-14 | 13F | Lazard Asset Management Llc | 0 | -100,00 | 0 | |||||
| 2026-02-13 | 13F | FORA Capital, LLC | 68.327 | 129,34 | 3.139 | 202,60 | ||||
| 2026-02-06 | 13F | Harvest Portfolios Group Inc. | 56.531 | -33,57 | 590 | -16,31 | ||||
| 2026-02-13 | 13F | Umb Bank N A/mo | 500 | 23 | ||||||
| 2026-02-17 | 13F | Alight Capital Management LP | 300.000 | 200,00 | 13.782 | 295,92 | ||||
| 2026-01-15 | 13F | Guided Capital Wealth Management, LLC | 0 | -100,00 | 0 | -100,00 | ||||
| 2026-02-05 | 13F | Allworth Financial LP | 401 | -6,09 | 18 | 28,57 | ||||
| 2026-01-14 | 13F | Tradewinds Capital Management, LLC | 125 | -64,29 | 6 | -58,33 | ||||
| 2026-02-17 | 13F | Bank Of America Corp /de/ | Call | 0 | -100,00 | 0 | ||||
| 2026-02-05 | 13F | Amalgamated Bank | 3.009 | 8,04 | 0 | |||||
| 2026-01-26 | 13F | Opal Wealth Advisors, LLC | 0 | -100,00 | 0 | |||||
| 2026-01-30 | 13F | Levin Capital Strategies, L.p. | 18.000 | 8.900,00 | 827 | 13.666,67 | ||||
| 2026-01-30 | 13F | Levin Capital Strategies, L.p. | Call | 3.000 | -66,67 | 138 | -56,23 | |||
| 2026-02-17 | 13F | Parallax Volatility Advisers, L.P. | Put | 214.700 | 9.863 | |||||
| 2026-02-17 | 13F | Parallax Volatility Advisers, L.P. | Call | 333.000 | 1.156,60 | 15.298 | 1.559,22 | |||
| 2026-02-17 | 13F | Alliancebernstein L.p. | 101.093 | -0,07 | 4.644 | 31,89 | ||||
| 2026-04-07 | 13F | CoreCap Advisors, LLC | 380 | -44,12 | 18 | -45,16 | ||||
| 2026-02-09 | 13F | Harbour Investments, Inc. | 0 | -100,00 | 0 | |||||
| 2026-02-13 | 13F | Walleye Capital LLC | Put | 153.400 | 15,43 | 7.047 | 52,33 | |||
| 2026-02-06 | 13F | Pinnbrook Capital Management Lp | Call | 109.500 | 195,95 | 5.030 | 290,83 | |||
| 2026-02-13 | 13F | Walleye Capital LLC | 186.381 | 110,64 | 8.562 | 177,99 | ||||
| 2026-02-04 | 13F | Swiss Life Asset Management Ltd | 4.681 | 215 | ||||||
| 2026-02-13 | 13F | Walleye Capital LLC | Call | 103.600 | 2,98 | 4.759 | 35,93 | |||
| 2026-01-28 | 13F | Arizona State Retirement System | 27.404 | -6,44 | 1.259 | 23,45 | ||||
| 2026-02-17 | 13F | Philadelphia Financial Management of San Francisco, LLC | Put | 400.000 | 18.376 | |||||
| 2026-02-12 | 13F | Marex Group plc | 6.048 | 278 | ||||||
| 2026-02-13 | 13F | Y-Intercept (Hong Kong) Ltd | 0 | -100,00 | 0 | -100,00 | ||||
| 2026-01-28 | 13F | Teacher Retirement System Of Texas | 0 | -100,00 | 0 | |||||
| 2026-02-13 | 13F | Itau Unibanco Holding S.A. | 1.133 | 52 | ||||||
| 2026-02-12 | 13F | Dimensional Fund Advisors Lp | 186.806 | -40,49 | 8.584 | -21,45 | ||||
| 2026-02-12 | 13F | Nuveen, LLC | 395.641 | 10,07 | 18.176 | 45,26 | ||||
| 2026-02-13 | 13F | Rhumbline Advisers | 135.233 | -4,54 | 6.213 | 25,98 | ||||
| 2026-02-19 | 13F | Mcguire Capital Advisors Inc | 4.208 | 193 | ||||||
| 2026-02-13 | 13F | Smartleaf Asset Management LLC | 443 | 248,82 | 21 | 400,00 | ||||
| 2026-01-30 | 13F | R Squared Ltd | 5.407 | 248 | ||||||
| 2026-02-09 | 13F | Huntington National Bank | 1 | 0,00 | 0 | |||||
| 2026-02-17 | 13F | Oxford Asset Management Llp | 8.257 | 379 | ||||||
| 2026-02-13 | 13F | Kestra Advisory Services, LLC | 4.828 | 222 | ||||||
| 2026-03-03 | 13F/A | Caitong International Asset Management Co., Ltd | 22.570 | 1.037 | ||||||
| 2026-02-06 | 13F | Steadview Capital Management LLC | 431.655 | 1.425,28 | 19.830 | 1.913,20 | ||||
| 2026-02-17 | 13F | Zimmer Partners, LP | 72.500 | 52,63 | 3.331 | 101,45 | ||||
| 2026-02-17 | 13F | Balyasny Asset Management Llc | 0 | -100,00 | 0 | -100,00 | ||||
| 2026-02-17 | 13F | SRS Investment Management, LLC | 2.869.797 | 131.838 | ||||||
| 2026-02-17 | 13F | Ardsley Advisory Partners Lp | Call | 0 | -100,00 | 0 | ||||
| 2026-01-27 | 13F | WealthCollab, LLC | 57 | 0,00 | 3 | 100,00 | ||||
| 2026-02-13 | 13F | MAI Capital Management | 21 | 0,00 | 1 | |||||
| 2026-02-11 | 13F | Deutsche Bank Ag\ | 143.022 | 54,45 | 6.570 | 103,85 | ||||
| 2025-11-14 | 13F | Point72 Asia (Singapore) Pte. Ltd. | 3.262 | 114 | ||||||
| 2026-02-13 | 13F | Mariner, LLC | 27.793 | 5,19 | 1.277 | 38,85 | ||||
| 2026-04-06 | 13F | Rosenberg Matthew Hamilton | 0 | -100,00 | 0 | |||||
| 2026-02-17 | 13F | Citadel Advisors Llc | Put | 2.007.260 | 4,83 | 92.214 | 38,35 | |||
| 2026-02-17 | 13F | Citadel Advisors Llc | 662.324 | 144,04 | 30.427 | 222,08 | ||||
| 2026-02-02 | 13F | Principal Financial Group Inc | 0 | -100,00 | 0 | -100,00 | ||||
| 2026-02-09 | 13F | GeoSphere Capital Management | 115.000 | 64,29 | 5.283 | 116,87 | ||||
| 2026-02-17 | 13F | Citadel Advisors Llc | Call | 2.822.400 | 18,21 | 129.661 | 56,01 | |||
| 2026-02-17 | 13F | Ameriprise Financial Inc | 2.098.747 | -29,84 | 96.416 | -7,41 | ||||
| 2026-02-17 | 13F | Banco Bilbao Vizcaya Argentaria, S.a. | 0 | -100,00 | 0 | |||||
| 2025-11-13 | 13F | RR Advisors, LLC | 0 | -100,00 | 0 | |||||
| 2026-02-12 | 13F | CIBC Private Wealth Group, LLC | 1.876 | 1,85 | 86 | 34,38 | ||||
| 2026-02-17 | 13F | Quantinno Capital Management LP | 8.326 | 1,91 | 382 | 34,51 | ||||
| 2026-02-17 | 13F | Merewether Investment Management, LP | 393.600 | 18.082 | ||||||
| 2026-02-10 | 13F | Connor, Clark & Lunn Investment Management Ltd. | 441.399 | 20.297 | ||||||
| 2026-02-12 | 13F | Federated Hermes, Inc. | 9.542 | -72,88 | 438 | -64,22 | ||||
| 2026-02-17 | 13F | MIRAE ASSET GLOBAL ETFS HOLDINGS Ltd. | 1.569.855 | 0,90 | 72.190 | 33,30 | ||||
| 2026-01-21 | 13F | Sound Income Strategies, LLC | 203 | 24,54 | 12 | 71,43 | ||||
| 2026-01-30 | 13F | Moody Aldrich Partners Llc | 108.406 | 4.980 | ||||||
| 2026-02-03 | 13F | Mitsubishi UFJ Kokusai Asset Management Co., Ltd. | 4.589 | -51,69 | 235 | -28,79 | ||||
| 2026-01-20 | 13F | Stratos Wealth Partners, LTD. | 11.949 | 0,00 | 549 | 32,05 | ||||
| 2026-01-15 | 13F | Savior LLC | 7.075 | -16,93 | 325 | 9,80 | ||||
| 2026-04-08 | 13F | DiNuzzo Private Wealth, Inc. | 4 | 0,00 | 0 | |||||
| 2026-02-10 | 13F | Thoroughbred Financial Services, Llc | 16.144 | 1 | ||||||
| 2026-02-17 | 13F | Concentric Capital Strategies, LP | 28.483 | -40,71 | 1.309 | -21,77 | ||||
| 2026-02-13 | 13F | Citigroup Inc | 14.527 | -43,42 | 669 | -25,20 | ||||
| 2026-02-13 | 13F | Citigroup Inc | Call | 5.500 | -89,00 | 253 | -85,46 | |||
| 2026-03-26 | 13F/A | Peak6 Llc | 0 | -100,00 | 0 | -100,00 | ||||
| 2026-02-13 | 13F | Sterling Capital Management LLC | 5.544 | -15,06 | 255 | 11,89 | ||||
| 2026-02-13 | 13F | Neuberger Berman Group LLC | 7.584 | 348 | ||||||
| 2026-02-13 | 13F | Toroso Investments, LLC | Put | 352.900 | 183,00 | 16.212 | 273,55 | |||
| 2026-02-13 | 13F | Toroso Investments, LLC | Call | 202.300 | 9.294 | |||||
| 2026-01-29 | 13F | Concurrent Investment Advisors, LLC | 5.115 | 235 | ||||||
| 2026-02-13 | 13F | Toroso Investments, LLC | 1.429.489 | -20,40 | 65.671 | 5,05 | ||||
| 2026-02-17 | 13F | Susquehanna International Group, Llp | Call | 5.294.100 | 19,62 | 243.211 | 57,87 | |||
| 2026-02-17 | 13F | Susquehanna International Group, Llp | 258.512 | -80,61 | 11.876 | -74,41 | ||||
| 2026-02-17 | 13F | Advisory Services Network, LLC | 0 | -100,00 | 0 | |||||
| 2026-02-17 | 13F | Family Management Corp | 10.004 | 0,04 | 460 | 31,90 | ||||
| 2026-02-17 | 13F | Susquehanna International Group, Llp | Put | 3.167.800 | 17,98 | 145.529 | 55,70 | |||
| 2026-03-23 | 13F | Galaxy Digital Capital Management GP LLC | 28.193 | -77,47 | 1.295 | -10,87 | ||||
| 2026-01-29 | 13F | UMA Financial Services, Inc. | 11 | 1 | ||||||
| 2026-02-17 | 13F | D. E. Shaw & Co., Inc. | Call | 208.500 | 268,37 | 9.578 | 386,19 | |||
| 2026-02-06 | 13F | Larson Financial Group LLC | 670 | 12,42 | 31 | 50,00 | ||||
| 2026-02-17 | 13F | D. E. Shaw & Co., Inc. | 2.385.318 | 21,42 | 109.600 | 60,27 | ||||
| 2026-02-17 | 13F | D. E. Shaw & Co., Inc. | Put | 489.200 | 934,25 | 22.474 | 1.265,31 | |||
| 2026-01-29 | 13F | Pictet Asset Management Holding SA | 18.693 | 5,30 | 859 | 39,06 | ||||
| 2026-02-17 | 13F | Hidden Lake Asset Management LP | 64.710 | -49,23 | 2.973 | -33,00 | ||||
| 2026-04-13 | 13F | GoalVest Advisory LLC | 15.740 | 0,25 | 738 | 2,36 | ||||
| 2026-02-13 | 13F | Barclays Plc | Put | 9.000 | -97,88 | 413 | -97,20 | |||
| 2026-02-13 | 13F | Barclays Plc | 154.407 | -3,95 | 7.093 | 26,77 | ||||
| 2026-02-13 | 13F | Barclays Plc | Call | 266.600 | 313,33 | 12.248 | 445,52 | |||
| 2026-02-13 | 13F | Charles Schwab Investment Management Inc | 1.088.853 | -1,78 | 50.022 | 29,63 | ||||
| 2026-02-13 | 13F | Sachem Head Capital Management LP | 2.825.000 | 129.780 | ||||||
| 2025-11-14 | 13F | Incline Global Management LLC | 0 | -100,00 | 0 | -100,00 | ||||
| 2026-01-29 | 13F | Huntleigh Advisors, Inc. | 0 | -100,00 | 0 | |||||
| 2026-02-17 | 13F | Gillson Capital LP | 246.406 | 11 | ||||||
| 2026-02-11 | 13F | Situational Awareness LP | 860.200 | 43,61 | 39.518 | 89,52 | ||||
| 2026-02-17 | 13F | LMR Partners LLP | 205.000 | 9.418 | ||||||
| 2026-02-17 | 13F | LMR Partners LLP | Call | 79.800 | 33,00 | 3.666 | 75,57 | |||
| 2026-02-17 | 13F | Sphera Management Technology Funds Ltd | 0 | -100,00 | 0 | |||||
| 2025-11-14 | 13F | Skopos Labs, Inc. | 0 | -100,00 | 0 | |||||
| 2026-01-23 | 13F | State of Alaska, Department of Revenue | 12.352 | 1 | ||||||
| 2026-02-17 | 13F | Arrington Capital Management, LLC | Call | 63.000 | 2.894 | |||||
| 2026-01-16 | 13F | Marquette Asset Management, LLC | 18 | 1 | ||||||
| 2026-02-17 | 13F | Northern Right Capital Management, L.P. | 603.201 | -11,93 | 27.711 | 16,23 | ||||
| 2026-02-05 | 13F | Phoenix Holdings Ltd. | 7.551 | -40,81 | 347 | -22,07 | ||||
| 2025-10-29 | 13F | Massachusetts Financial Services Co /ma/ | 0 | -100,00 | 0 | |||||
| 2026-02-13 | 13F | Ripple Effect Asset Management LP | 18.000 | -91,00 | 827 | -88,14 | ||||
| 2026-02-17 | 13F | Millennium Management Llc | Put | 0 | -100,00 | 0 | ||||
| 2026-03-12 | 13F/A | Peak6 Llc | Call | 725.500 | -38,36 | 33.329 | -18,65 | |||
| 2026-02-11 | 13F | BIT Capital GmbH | Call | 55.000 | 22,22 | 2.527 | 61,30 | |||
| 2026-02-11 | 13F | BIT Capital GmbH | 2.087.941 | -4,11 | 95.920 | 26,55 | ||||
| 2026-03-12 | 13F/A | Peak6 Llc | Put | 711.300 | -6,42 | 32.677 | 23,50 | |||
| 2026-01-16 | 13F | FNY Investment Advisers, LLC | 413 | -75,79 | 0 | |||||
| 2026-02-20 | 13F | Sunbelt Securities, Inc. | 217 | 0,00 | 10 | 28,57 | ||||
| 2026-02-13 | 13F | Bridgefront Capital, LLC | 7.905 | 363 | ||||||
| 2026-02-19 | 13F | Invesco Ltd. | 1.007.988 | 6,79 | 46.307 | 40,93 | ||||
| 2026-02-12 | 13F | Banco BTG Pactual S.A. | 85.000 | 608,33 | 3.905 | 836,21 | ||||
| 2026-02-06 | 13F | ProShare Advisors LLC | 17.908 | 11,09 | 823 | 46,52 | ||||
| 2026-02-17 | 13F | Price T Rowe Associates Inc /md/ | 94.523 | 26,84 | 4 | 100,00 | ||||
| 2026-02-17 | 13F | Tower Research Capital LLC (TRC) | 3.150 | -26,33 | 145 | -2,70 | ||||
| 2026-02-17 | 13F | Creative Planning | 18.934 | 25,25 | 870 | 65,21 | ||||
| 2026-02-18 | 13F | Mackenzie Financial Corp | 13.435 | 124,25 | 621 | 198,08 | ||||
| 2026-02-13 | 13F | Public Employees Retirement Association Of Colorado | 11.793 | 1 | ||||||
| 2026-02-06 | 13F | Handelsbanken Fonder AB | 25.100 | 1 | ||||||
| 2026-02-17 | 13F | Shay Capital LLC | 74.378 | 3.417 | ||||||
| 2026-02-09 | 13F | Geode Capital Management, Llc | 2.593.916 | 3,17 | 119.181 | 36,15 | ||||
| 2026-02-10 | 13F | Goldman Sachs Group Inc | Call | 230.000 | 15,00 | 10.566 | 51,77 | |||
| 2026-02-13 | 13F | Manufacturers Life Insurance Company, The | 31.498 | -7,11 | 1.447 | 22,63 | ||||
| 2026-02-13 | 13F | SRS Capital Advisors, Inc. | 12 | -98,64 | 1 | -100,00 | ||||
| 2026-02-17 | 13F | Royal Bank Of Canada | 14.404 | -47,38 | 662 | -30,54 | ||||
| 2026-02-17 | 13F | Metavasi Capital LP | 0 | -100,00 | 0 | |||||
| 2026-01-21 | 13F | Raleigh Capital Management Inc. | 100 | 5 | ||||||
| 2026-02-13 | 13F | Marnell Management LLC | 75.942 | 3.489 | ||||||
| 2026-02-17 | 13F | Northwood Liquid Management Lp | 0 | -100,00 | 0 | |||||
| 2026-02-10 | 13F | BW Gestao de Investimentos Ltda. | Call | 0 | -100,00 | 0 | -100,00 | |||
| 2026-02-17 | 13F | Tricadia Capital Management, LLC | 0 | -100,00 | 0 | |||||
| 2026-02-17 | 13F | Ninepoint Partners LP | 0 | -100,00 | 0 | |||||
| 2026-02-17 | 13F | Amundi | 6.475 | 297 | ||||||
| 2026-02-09 | 13F | Main Street Research LLC | 8.986 | 413 | ||||||
| 2026-02-13 | 13F | Dynamic Technology Lab Private Ltd | 0 | -100,00 | 0 | |||||
| 2026-02-23 | 13F | Virtu Financial LLC | 0 | -100,00 | 0 | |||||
| 2026-01-30 | 13F | Wealth High Governance Capital Ltda | 366.157 | -12,82 | 16.821 | 15,05 | ||||
| 2026-04-07 | 13F | Farther Finance Advisors, LLC | 1.421 | 2,01 | 67 | 6,35 | ||||
| 2026-01-23 | 13F | Natural Investments, Llc | 5.100 | 0 | ||||||
| 2026-02-17 | 13F | Glenmede Trust Co Na | 16.265 | 747 | ||||||
| 2026-01-09 | 13F | SG Americas Securities, LLC | 11.688 | -34,59 | 1 | |||||
| 2026-02-11 | 13F | Los Angeles Capital Management Llc | 425 | 21 | ||||||
| 2025-11-07 | 13F | Atticus Wealth Management, Llc | 0 | -100,00 | 0 | -100,00 | ||||
| 2026-02-17 | 13F | SummitTX Capital, L.P. | 13.726 | 31,04 | 631 | 73,08 | ||||
| 2026-02-12 | 13F | EAM Investors, LLC | 0 | -100,00 | 0 | -100,00 | ||||
| 2025-11-14 | 13F | Balyasny Asset Management Llc | Call | 0 | -100,00 | 0 | -100,00 | |||
| 2025-10-28 | 13F | Wolff Wiese Magana Llc | 0 | -100,00 | 0 | |||||
| 2026-02-12 | 13F | Brinker Capital Investments, LLC | 4.769 | 219 | ||||||
| 2026-02-17 | 13F | T. Rowe Price Investment Management, Inc. | 727.971 | -47,63 | 33 | -31,25 | ||||
| 2026-02-17 | 13F | Mark Asset Management Lp | 120.607 | -33,35 | 5.541 | -12,05 | ||||
| 2026-02-10 | 13F | Goldman Sachs Group Inc | 589.820 | -25,81 | 27.096 | -2,09 | ||||
| 2026-02-13 | 13F | JustInvest LLC | 8.992 | 4,51 | 413 | 38,13 | ||||
| 2026-02-11 | 13F | Two Seas Capital LP | 491.500 | 22.580 | ||||||
| 2026-02-11 | 13F | Two Seas Capital LP | Call | 1.752.500 | 80.510 | |||||
| 2026-01-22 | 13F | Advantage Alpha Capital Partners LP | 0 | -100,00 | 0 | |||||
| 2026-02-13 | 13F | Stifel Financial Corp | 160.386 | -1,45 | 7.368 | 30,06 | ||||
| 2026-01-28 | 13F | Universal- Beteiligungs- und Servicegesellschaft mbH | 218.561 | 17,26 | 10.046 | 54,82 | ||||
| 2026-02-11 | 13F | LPL Financial LLC | 58.026 | 23,75 | 2.666 | 63,30 | ||||
| 2026-02-17 | 13F | Fmr Llc | 75.303 | 1.303,86 | 3.460 | 1.759,68 | ||||
| 2026-02-11 | 13F | Group One Trading, L.p. | 119.264 | -65,10 | 5.479 | -53,95 | ||||
| 2026-02-12 | 13F | Xponance, Inc. | 7.491 | 1,82 | 344 | 34,38 | ||||
| 2026-02-17 | 13F | Cresset Asset Management, LLC | 58.778 | 2,66 | 2.700 | 35,54 | ||||
| 2026-01-14 | 13F | Jfs Wealth Advisors, Llc | 14 | 1 | ||||||
| 2026-02-13 | 13F | Wells Fargo & Company/mn | 140.308 | 31,67 | 6.446 | 73,77 | ||||
| 2026-02-04 | 13F | LRI Investments, LLC | 13 | 1 | ||||||
| 2026-02-17 | 13F | Sona Asset Management (us) Llc | 0 | -100,00 | 0 | |||||
| 2026-02-05 | 13F | HFM Investment Advisors, LLC | 2 | 0 | ||||||
| 2026-02-17 | 13F | BlueCrest Capital Management Ltd | Call | 0 | -100,00 | 0 | -100,00 | |||
| 2026-02-17 | 13F | Capital Fund Management S.a. | Put | 121.700 | -40,86 | 5.591 | -21,96 | |||
| 2026-02-17 | 13F | Capital Fund Management S.a. | Call | 133.500 | -52,64 | 6.133 | -37,51 | |||
| 2026-01-29 | 13F | Concord Wealth Partners | 2 | 0 | ||||||
| 2025-11-14 | 13F | Yaupon Capital Management LP | Call | 0 | -100,00 | 0 | ||||
| 2026-02-02 | 13F | Strs Ohio | 25.000 | 278,79 | 1.148 | 401,31 | ||||
| 2026-02-17 | 13F | Dendur Capital Lp | 473.000 | 3,50 | 21.730 | 36,59 | ||||
| 2026-02-18 | 13F | VGI Partners Ltd | 0 | -100,00 | 0 | -100,00 | ||||
| 2026-04-02 | 13F | Aspect Partners, LLC | 100 | 0,00 | 5 | 0,00 | ||||
| 2026-02-17 | 13F | Boothbay Fund Management, Llc | 42.660 | 523,32 | 1.960 | 723,11 | ||||
| 2026-02-12 | 13F | EntryPoint Capital, LLC | 0 | -100,00 | 0 | |||||
| 2026-02-17 | 13F | G2 Investment Partners Management LLC | 65.108 | 551,08 | 2.991 | 759,48 | ||||
| 2026-02-04 | 13F | Dogwood Wealth Management LLC | 32 | 0,00 | 1 | 0,00 | ||||
| 2026-04-08 | 13F | Arlington Trust Co LLC | 100 | -60,00 | 5 | -63,64 | ||||
| 2026-02-17 | 13F | Sig Brokerage, Lp | Call | 0 | -100,00 | 0 | ||||
| 2026-02-17 | 13F | Cetera Investment Advisers | 24.430 | -1,18 | 1.122 | 30,47 | ||||
| 2026-02-17 | 13F | Nishkama Capital, LLC | 205.722 | -74,55 | 9.451 | -66,41 | ||||
| 2026-02-11 | 13F | Trivest Advisors Ltd | 102.400 | 4.704 | ||||||
| 2026-01-27 | 13F | Zurcher Kantonalbank (Zurich Cantonalbank) | 21.685 | 1,70 | 996 | 34,23 | ||||
| 2026-02-13 | 13F | State Street Corp | 2.476.020 | 0,73 | 113.748 | 32,94 | ||||
| 2026-02-12 | 13F | Cibc World Markets Corp | 6.337 | -45,45 | 291 | 34,72 | ||||
| 2026-02-13 | 13F | Oasis Management Co Ltd. | 2.307.683 | 662,29 | 106.015 | 906,02 | ||||
| 2026-02-17 | 13F | Jain Global LLC | 13.810 | 3,77 | 634 | 36,93 | ||||
| 2026-02-17 | 13F | Scoggin Management Lp | Put | 0 | -100,00 | 0 | ||||
| 2026-02-13 | 13F | Pinnacle Wealth Planning Services, Inc. | 38 | 2 | ||||||
| 2026-01-23 | 13F | Assetmark, Inc | 7 | 0,00 | 0 | |||||
| 2026-02-13 | 13F | Pine Valley Investments Ltd Liability Co | 5.040 | 232 | ||||||
| 2026-02-10 | 13F | Bbr Partners, Llc | 16.085 | 0,00 | 739 | 32,02 | ||||
| 2026-02-11 | 13F | Atlantic Private Wealth, LLC | 10 | 0 | ||||||
| 2026-02-13 | 13F | Squarepoint Ops LLC | Call | 17.800 | -87,63 | 818 | -83,69 | |||
| 2026-02-11 | 13F | Parallel Advisors, LLC | 20 | 300,00 | 1 | |||||
| 2026-02-13 | 13F | Squarepoint Ops LLC | Put | 70.000 | 7,03 | 3.216 | 41,26 | |||
| 2026-02-13 | 13F | Squarepoint Ops LLC | 67.139 | 3.084 | ||||||
| 2026-02-17 | 13F | Advisor Group Holdings, Inc. | 1.591 | 22,76 | 73 | 69,77 | ||||
| 2026-01-30 | 13F | Us Bancorp \de\ | 18.055 | -21,30 | 829 | 3,88 | ||||
| 2026-02-13 | 13F | Integrated Wealth Concepts LLC | 10.028 | 4,76 | 461 | 38,14 | ||||
| 2026-01-15 | 13F | Allspring Global Investments Holdings, LLC | 8.375 | 429 | ||||||
| 2026-02-17 | 13F | Hampton Road Capital Management LP | 15.294 | -74,87 | 703 | -66,86 | ||||
| 2026-02-13 | 13F | Rafferty Asset Management, LLC | 4.924 | 226 | ||||||
| 2026-02-13 | 13F | Police & Firemen's Retirement System of New Jersey | 25.809 | -2,91 | 1.186 | 28,11 | ||||
| 2026-02-17 | 13F | XTX Topco Ltd | 0 | -100,00 | 0 | |||||
| 2025-11-12 | 13F | HAP Trading, LLC | Call | 16.200 | 248 | |||||
| 2026-02-12 | 13F | Intrinsic Edge Capital Management LLC | Put | 300.000 | 13.782 | |||||
| 2026-02-12 | 13F | Intrinsic Edge Capital Management LLC | 350.000 | -12,50 | 16.079 | 15,48 | ||||
| 2026-02-02 | 13F | Fifth Third Bancorp | 2.000 | 0,00 | 92 | 31,88 | ||||
| 2026-02-13 | 13F | Verition Fund Management LLC | Put | 18.500 | -84,04 | 850 | -78,95 | |||
| 2026-02-06 | 13F | Covestor Ltd | 21.327 | 355.350,00 | 1 | |||||
| 2026-02-13 | 13F | Verition Fund Management LLC | 22.700 | -79,83 | 1.043 | -73,40 | ||||
| 2026-02-17 | 13F | Shay Capital LLC | Call | 0 | -100,00 | 0 | -100,00 | |||
| 2026-02-17 | 13F | Scoggin Management Lp | 25.000 | 1.148 | ||||||
| 2026-02-17 | 13F | Scoggin Management Lp | Call | 50.000 | 2.297 | |||||
| 2026-01-20 | 13F | Global Trust Asset Management, LLC | 20 | 1 | ||||||
| 2026-02-10 | 13F | Bnp Paribas Arbitrage, Sa | 21.115 | 14,83 | 970 | 51,56 | ||||
| 2026-02-17 | 13F | Optiver Holding B.V. | 939 | 43 | ||||||
| 2026-01-06 | 13F | E Six Thirteen, Llc | 18.542 | -60,92 | 852 | -48,46 | ||||
| 2026-02-17 | 13F | BTG Pactual Asset Management US LLC | Call | 0 | -100,00 | 0 | ||||
| 2026-02-13 | 13F | Centiva Capital, LP | Call | 0 | -100,00 | 0 | -100,00 | |||
| 2026-02-10 | 13F | Envestnet Asset Management Inc | 14.730 | 677 | ||||||
| 2026-02-10 | 13F | Belvedere Trading LLC | 26.054 | -19,32 | 1.197 | 6,41 | ||||
| 2026-02-10 | 13F | BW Gestao de Investimentos Ltda. | 233.843 | -16,48 | 10.743 | 10,22 | ||||
| 2026-02-10 | 13F | Belvedere Trading LLC | Put | 42.400 | 0,00 | 1.492 | 32,04 | |||
| 2026-02-05 | 13F | Am Investment Strategies Llc | 39.000 | -11,36 | 2 | 0,00 | ||||
| 2026-02-10 | 13F | Belvedere Trading LLC | Call | 92.800 | 16,88 | 1.301 | 121,26 | |||
| 2026-02-13 | 13F | Centiva Capital, LP | 0 | -100,00 | 0 | -100,00 | ||||
| 2026-02-13 | 13F | Ripple Effect Asset Management LP | Put | 0 | -100,00 | 0 | -100,00 | |||
| 2026-02-04 | 13F | Independent Advisor Alliance | 20.459 | 19,76 | 940 | 58,08 | ||||
| 2026-02-17 | 13F | Tudor Investment Corp Et Al | Put | 12.800 | -10,49 | 588 | 18,31 | |||
| 2026-02-13 | 13F | Vontobel Holding Ltd. | 8.026 | 0,00 | 369 | 32,26 | ||||
| 2026-02-17 | 13F | Tudor Investment Corp Et Al | 15.572 | -46,63 | 715 | -29,56 | ||||
| 2025-11-14 | 13F | Summit Trail Advisors, Llc | 0 | -100,00 | 0 | |||||
| 2026-02-12 | 13F | Ci Investments Inc. | 0 | -100,00 | 0 | |||||
| 2026-02-14 | 13F | Rockefeller Capital Management L.P. | 348 | 16 | ||||||
| 2026-02-17 | 13F | Northern Trust Corp | 740.378 | -6,31 | 34.013 | 23,64 | ||||
| 2026-02-17 | 13F | California State Teachers Retirement System | 94.440 | 1,57 | 4.339 | 34,05 | ||||
| 2026-01-07 | 13F | Permanent Capital Management, LP | 12.000 | 551 | ||||||
| 2026-02-09 | 13F | Keating Financial Advisory Services, Inc. | 48 | 2 | ||||||
| 2026-02-11 | 13F | Simplex Trading, Llc | 128.859 | 211,01 | 5.920 | 591.800,00 | ||||
| 2026-01-26 | 13F | Cwm, Llc | 1.106 | 37,39 | 0 | |||||
| 2026-01-15 | 13F | Nisa Investment Advisors, Llc | 15.969 | 1,62 | 734 | 34,00 | ||||
| 2026-02-12 | 13F | Benson Wealth Management INC | 13 | 1 | ||||||
| 2026-01-30 | 13F | State of New Jersey Common Pension Fund D | 55.776 | 2.562 | ||||||
| 2026-02-17 | 13F | Point72 Asset Management, L.P. | 119.993 | 764,63 | 5.511 | 1.040,79 | ||||
| 2026-02-17 | 13F | Point72 Asset Management, L.P. | Put | 279.400 | 12.836 | |||||
| 2026-02-17 | 13F | Point72 Asset Management, L.P. | Call | 295.900 | 457,25 | 13.594 | 635,55 | |||
| 2026-02-17 | 13F | Pertento Partners LLP | 0 | -100,00 | 0 | |||||
| 2025-10-30 | 13F | Twin Peaks Wealth Advisors, LLC | 0 | -100,00 | 0 | |||||
| 2026-02-05 | 13F | Cambridge Investment Research Advisors, Inc. | 12.107 | -81,59 | 1 | -100,00 | ||||
| 2026-04-08 | 13F | E Fund Management (Hong Kong) Co., Ltd. | 170 | 8 | ||||||
| 2026-02-17 | 13F | Polymer Capital Management (US) LLC | 27.437 | 12,63 | 1.260 | 48,76 | ||||
| 2026-02-18 | 13F | Vident Advisory, LLC | 321.482 | -11,56 | 14.769 | 16,72 | ||||
| 2026-02-17 | 13F | Toronto Dominion Bank | Call | 349.200 | 47,03 | 16.042 | 94,05 | |||
| 2026-01-20 | 13F | Quintet Private Bank (Europe) S.A. | 300 | 14 | ||||||
| 2026-02-13 | 13F | Edgestream Partners, L.P. | 73.471 | -42,80 | 3.375 | -24,51 | ||||
| 2026-02-17 | 13F | Toronto Dominion Bank | Put | 50.000 | -78,95 | 2.297 | -72,21 | |||
| 2025-11-14 | 13F | Point72 (DIFC) Ltd | 9.959 | 347 | ||||||
| 2026-02-12 | 13F | New York State Common Retirement Fund | 32.540 | 0,00 | 1.495 | 31,98 | ||||
| 2026-02-17 | 13F | Atom Investors LP | 0 | -100,00 | 0 | -100,00 | ||||
| 2026-02-17 | 13F | Hood River Capital Management LLC | 1.041.669 | -47,52 | 47.854 | -30,74 | ||||
| 2026-02-12 | 13F | BlackRock, Inc. | 8.423.285 | 5,46 | 386.966 | 39,18 | ||||
| 2026-02-17 | 13F | Goodlander Investment Management, LLC | 0 | -100,00 | 0 | |||||
| 2026-02-02 | 13F | Danske Bank A/s | 1.100 | 51 | ||||||
| 2026-02-17 | 13F | Aqr Capital Management Llc | 51.343 | 57,34 | 2.359 | 107,75 | ||||
| 2026-02-17 | 13F | Two Sigma Investments, Lp | 13.143 | -78,85 | 604 | -72,12 | ||||
| 2026-01-15 | 13F | Fortitude Family Office, LLC | 455 | 2,94 | 21 | 33,33 | ||||
| 2026-02-17 | 13F | Feynman Point Asset Management LLC | 44.500 | 2.044 | ||||||
| 2026-02-13 | 13F/A | Abound Financial, Llc | 240 | 11 | ||||||
| 2026-02-13 | 13F | Quarry LP | 0 | -100,00 | 0 | -100,00 | ||||
| 2026-02-17 | 13F | Imprint Wealth LLC | 836 | 38 | ||||||
| 2026-01-29 | 13F | UBS Group AG | Call | 40.000 | 1.838 | |||||
| 2026-01-29 | 13F | UBS Group AG | 156.034 | -76,13 | 7.168 | -68,49 | ||||
| 2026-01-30 | 13F | Jennison Associates Llc | 0 | -100,00 | 0 | -100,00 | ||||
| 2026-02-17 | 13F | Arosa Capital Management LP | 85.000 | 3.905 | ||||||
| 2026-01-29 | 13F | IMC-Chicago, LLC | 0 | -100,00 | 0 | -100,00 | ||||
| 2026-02-17 | 13F | Alphadyne Asset Management, LLC | 4.815 | 221 | ||||||
| 2026-02-17 | 13F | Alphadyne Asset Management, LLC | Put | 29.100 | 1.337 | |||||
| 2026-04-07 | 13F | Signaturefd, Llc | 344 | 69,46 | 16 | 77,78 | ||||
| 2026-02-17 | 13F | Alphadyne Asset Management, LLC | Call | 28.400 | 1.305 | |||||
| 2025-11-21 | 13F/A | CIBC Bancorp USA Inc. | 10.049 | 350 | ||||||
| 2026-01-21 | 13F | Capital Advisors, Ltd. LLC | 6 | 0 | ||||||
| 2026-02-11 | 13F | Meeder Asset Management Inc | 4.688 | 215 | ||||||
| 2026-02-17 | 13F | DZ BANK AG Deutsche Zentral Genossenschafts Bank, Frankfurt am Main | 0 | -100,00 | 0 | |||||
| 2025-11-12 | 13F | First Trust Advisors Lp | 0 | -100,00 | 0 | |||||
| 2025-11-14 | 13F | Ripple Effect Asset Management LP | Call | 0 | -100,00 | 0 | -100,00 | |||
| 2026-02-17 | 13F | Modern Wealth Management, LLC | 15.752 | 0,00 | 724 | 31,93 | ||||
| 2026-02-17 | 13F | Janus Henderson Group Plc | 46.500 | 16,25 | 2.136 | 53,38 | ||||
| 2026-02-10 | 13F/A | Northwestern Mutual Wealth Management Co | 87 | 0,00 | 4 | 0,00 | ||||
| 2026-02-09 | 13F | Legal & General Group Plc | 77.825 | -5,69 | 3.575 | 24,48 | ||||
| 2026-02-17 | 13F | Caption Management, LLC | 0 | -100,00 | 0 | |||||
| 2026-02-05 | 13F | Central Asset Investments & Management Holdings (HK) Ltd | 8.655 | 398 | -48,10 | |||||
| 2026-02-09 | 13F | Berkshire Capital Holdings Inc | 10 | 0 | ||||||
| 2026-02-13 | 13F | National Bank Of Canada /fi/ | 14.114 | 910 | ||||||
| 2026-02-11 | 13F | O'shaughnessy Asset Management, Llc | 13.077 | 0,19 | 601 | 32,16 | ||||
| 2026-02-12 | 13F | Jane Street Group, Llc | 454.405 | -75,49 | 20.902 | -67,59 | ||||
| 2026-02-12 | 13F | Jane Street Group, Llc | Call | 1.657.980 | 5,10 | 76.266 | 38,98 | |||
| 2026-02-06 | 13F | CloudAlpha Capital Management Limited/Hong Kong | 97.387 | 4.474 | ||||||
| 2026-02-12 | 13F | Jane Street Group, Llc | Put | 1.011.400 | -26,47 | 46.524 | -2,77 | |||
| 2026-02-02 | 13F | Bay Harbor Wealth Management, LLC | 1 | 0 | ||||||
| 2026-04-13 | 13F | IFP Advisors, Inc | 6.194 | 9,49 | 291 | 11,97 | ||||
| 2026-03-02 | 13F | Tobam | 5.258 | -85,81 | 0 | -100,00 | ||||
| 2026-02-10 | 13F | Intech Investment Management Llc | 36.392 | 29,33 | 1.672 | 70,68 | ||||
| 2026-02-06 | 13F | EverSource Wealth Advisors, LLC | 216 | -17,24 | 10 | 0,00 | ||||
| 2026-02-12 | 13F | Federation des caisses Desjardins du Quebec | 6.754 | -11,53 | 310 | 16,60 | ||||
| 2026-01-27 | 13F | TD Waterhouse Canada Inc. | 25 | -91,13 | 1 | -90,00 | ||||
| 2026-01-22 | 13F | Vision Financial Markets Llc | 20 | 0,00 | 1 | |||||
| 2026-02-18 | 13F | Galaxy Group Investments LLC | 28.193 | 1.295 | ||||||
| 2026-02-13 | 13F | Headlands Technologies LLC | 0 | -100,00 | 0 | -100,00 | ||||
| 2026-02-17 | 13F | Evolve Private Wealth, Llc | 37.105 | 1.705 | ||||||
| 2026-04-10 | 13F | Quaker Wealth Management, LLC | 14 | 0,00 | 1 | |||||
| 2026-02-17 | 13F | Owl Creek Asset Management, L.P. | 77.731 | 3.571 | ||||||
| 2025-10-30 | 13F | Vanguard Capital Wealth Advisors This fund is a listed as child fund of Vanguard Group Inc and if that institution has disclosed ownership in this security, then these positions will not be double counted when calculating total shares and total value | 0 | -100,00 | 0 | -100,00 | ||||
| 2026-04-06 | 13F | Versant Capital Management, Inc | 200 | 36,05 | 9 | 50,00 | ||||
| 2025-10-16 | 13F | West Tower Group, LLC | 0 | -100,00 | 0 | |||||
| 2026-01-23 | 13F | Ritholtz Wealth Management | 11.954 | 0,00 | 549 | 31,97 | ||||
| 2026-02-05 | 13F | Plancorp, LLC | 0 | -100,00 | 0 | |||||
| 2026-02-17 | 13F | Wellington Management Group Llp | 398.080 | 18.288 | ||||||
| 2026-02-17 | 13F | State Of Wisconsin Investment Board | 78.848 | -9,13 | 3.622 | 19,93 | ||||
| 2026-02-17 | 13F | Private Advisor Group, LLC | 7.983 | -7,75 | 367 | 21,59 | ||||
| 2026-02-13 | 13F | Ubs Asset Management Americas Inc | 168.934 | -12,19 | 7.761 | 15,89 | ||||
| 2026-02-17 | 13F | Weiss Asset Management LP | 636.346 | 503,39 | 29.234 | 696,32 | ||||
| 2025-11-14 | 13F | Main Management ETF Advisors, LLC | 0 | -100,00 | 0 | |||||
| 2026-02-06 | 13F | Global Retirement Partners, LLC | 4.608 | 37,59 | 212 | 81,90 | ||||
| 2026-02-12 | 13F | Wealthspire Advisors, LLC | 0 | -100,00 | 0 | |||||
| 2026-02-13 | 13F | Victory Capital Management Inc | 11.209 | 4,01 | 515 | 37,07 | ||||
| 2026-02-17 | 13F | ExodusPoint Capital Management, LP | 0 | -100,00 | 0 | -100,00 | ||||
| 2026-02-17 | 13F | Quantitative Investment Management, LLC | 0 | -100,00 | 0 | |||||
| 2025-11-14 | 13F | DeepCurrents Investment Group LLC | Call | 0 | -100,00 | 0 | ||||
| 2026-01-09 | 13F | Tactive Advisors, LLC | 80.481 | -14,34 | 3.697 | 13,06 | ||||
| 2026-02-17 | 13F | PointState Capital LP | 232.938 | 10.701 | ||||||
| 2026-02-17 | 13F | Voloridge Investment Management, Llc | 1.391.909 | 38,26 | 63.944 | 82,47 | ||||
| 2026-02-17 | 13F | Bank Of America Corp /de/ | 857.743 | 87,23 | 39.405 | 147,09 | ||||
| 2026-02-17 | 13F | Flight Deck Capital, LP | 214.700 | 9.863 | ||||||
| 2026-02-13 | 13F | Eschler Asset Management LLP | 8.990 | 413 | ||||||
| 2026-01-21 | 13F | Flagship Harbor Advisors, Llc | 375 | 17 | ||||||
| 2026-02-17 | 13F | Schonfeld Strategic Advisors LLC | 105.936 | 4.867 | ||||||
| 2025-11-14 | 13F | Cubist Systematic Strategies, LLC | 145.932 | 5.080 | ||||||
| 2025-10-14 | 13F | Munro Partners | 0 | -100,00 | 0 | -100,00 | ||||
| 2026-02-06 | 13F | HighTower Advisors, LLC | 5.587 | 257 | ||||||
| 2026-02-12 | 13F | Voya Investment Management Llc | 226.390 | 93,57 | 10.400 | 155,47 | ||||
| 2026-02-17 | 13F | Symmetry Investments LP | 0 | -100,00 | 0 | |||||
| 2026-02-17 | 13F | Symmetry Investments LP | Call | 0 | -100,00 | 0 | ||||
| 2026-02-13 | 13F | Prudential Financial Inc | 5.755 | -51,00 | 264 | -35,29 | ||||
| 2026-02-03 | 13F | SBI Securities Co., Ltd. | 4.942 | -4,30 | 227 | 26,82 | ||||
| 2026-02-13 | 13F | SPX Equities Gestao de Recursos Ltda | 18.180 | -70,10 | 835 | -60,54 | ||||
| 2026-02-17 | 13F | Aventail Capital Group, LP | 13.195 | -17,44 | 606 | 8,99 | ||||
| 2026-02-06 | 13F | Pnc Financial Services Group, Inc. | 1.720 | 101,41 | 79 | 172,41 | ||||
| 2026-02-12 | 13F | Swiss National Bank | 195.140 | 1,67 | 8.965 | 34,17 | ||||
| 2026-02-17 | 13F | Ardsley Advisory Partners Lp | 360.000 | -55,00 | 16.538 | -40,61 | ||||
| 2026-01-29 | 13F | Vanguard Group Inc | 7.978.357 | 3,24 | 366.526 | 36,25 | ||||
| 2026-01-07 | 13F | Harbour Capital Advisors, LLC | 18.020 | 924 | ||||||
| 2026-02-17 | 13F | Yaupon Capital Management LP | 536.522 | 24.648 | ||||||
| 2026-02-13 | 13F | Mml Investors Services, Llc | 19.297 | 887 | ||||||
| 2026-02-17 | 13F | Value Aligned Research Advisors, LLC | 2.788.516 | 43,07 | 128.104 | 88,82 | ||||
| 2026-02-17 | 13F | Moore Capital Management, Lp | 753.000 | -16,65 | 34.593 | 10,00 | ||||
| 2026-02-17 | 13F | Russell Investments Group, Ltd. | 10.572 | -0,67 | 486 | 31,08 | ||||
| 2026-01-29 | 13F | Comerica Bank | 304 | 1,00 | 14 | 30,00 | ||||
| 2025-11-14 | 13F | AXA Investment Managers S.A. | 30.000 | 1.044 | ||||||
| 2026-04-06 | 13F | GAMMA Investing LLC | 783 | 20,09 | 37 | 24,14 | ||||
| 2026-02-12 | 13F | Bank Of Montreal /can/ | 19.536 | 4,53 | 898 | 38,15 | ||||
| 2026-02-11 | 13F | CenterBook Partners LP | 0 | -100,00 | 0 | -100,00 | ||||
| 2026-02-13 | 13F | Natixis | 14.334 | 659 | ||||||
| 2025-11-14 | 13F | Wolverine Trading, Llc | 58.042 | 286,48 | 2.022 | 663,02 | ||||
| 2025-11-14 | 13F | Wolverine Trading, Llc | Call | 799.600 | 60,85 | 27.862 | 217,41 | |||
| 2025-11-14 | 13F | Wolverine Trading, Llc | Put | 298.500 | 81,35 | 10.401 | 257,91 | |||
| 2026-02-13 | 13F | Van Eck Associates Corp | 687.184 | 28,85 | 32 | 72,22 | ||||
| 2026-01-20 | 13F | Ethos Financial Group, LLC | 11.800 | 0,00 | 542 | 32,20 | ||||
| 2026-02-11 | 13F | Ameritas Investment Partners, Inc. | 7.876 | 362 | ||||||
| 2026-02-06 | 13F | Pinnbrook Capital Management Lp | 0 | -100,00 | 0 | -100,00 | ||||
| 2026-02-12 | 13F | Triumph Capital Management | 14 | 0,00 | 1 | |||||
| 2026-02-12 | 13F | MetLife Investment Management, LLC | 53.170 | -4,01 | 2.443 | 26,66 | ||||
| 2026-02-13 | 13F | BNP Paribas Asset Management Holding S.A. | 67.390 | 6.971,35 | 3 | |||||
| 2026-02-17 | 13F | Azora Capital LP | 690.492 | 181,21 | 31.721 | 271,14 | ||||
| 2026-02-17 | 13F | Driehaus Capital Management Llc | 217.624 | -82,83 | 9.998 | -77,35 | ||||
| 2026-02-12 | 13F | Steward Partners Investment Advisory, Llc | 1.311 | 3,97 | 60 | 39,53 | ||||
| 2026-02-17 | 13F | Park West Asset Management LLC | 253.500 | 11.646 | ||||||
| 2026-02-11 | 13F | Jpmorgan Chase & Co | 1.800.154 | 488,83 | 7.826 | 488,86 | ||||
| 2026-02-11 | 13F | Total Wealth Planning & Management, Inc. | 0 | -100,00 | 0 | -100,00 | ||||
| 2026-02-17 | 13F | Aquatic Capital Management LLC | 0 | -100,00 | 0 | |||||
| 2026-02-17 | 13F | Captrust Financial Advisors | 5.810 | 267 | ||||||
| 2026-02-17 | 13F | Torno Capital, Llc | Call | 0 | -100,00 | 0 | ||||
| 2025-11-14 | 13F | Point72 Europe (London) LLP | 6.962 | 242 | ||||||
| 2026-02-11 | 13F | Franklin Resources Inc | 49.658 | -6,52 | 2.281 | 23,36 | ||||
| 2026-02-17 | 13F | Algert Global Llc | 63.518 | 122,01 | 3 | |||||
| 2026-02-17 | 13F | Worth Venture Partners, LLC | 0 | -100,00 | 0 | -100,00 | ||||
| 2026-02-17 | 13F | Kemnay Advisory Services Inc. | 294 | 14 |