Grundlæggende statistik
| Institutionelle ejere | 274 total, 274 long only, 0 short only, 0 long/short - change of -3,83% MRQ |
| Gennemsnitlig porteføljeallokering | 0.1091 % - change of -20,72% MRQ |
| Institutionelle aktier (lange) | 51.976.285 (ex 13D/G) - change of -5,49MM shares -9,56% MRQ |
| Institutionel værdi (lang) | $ 295.979 USD ($1000) |
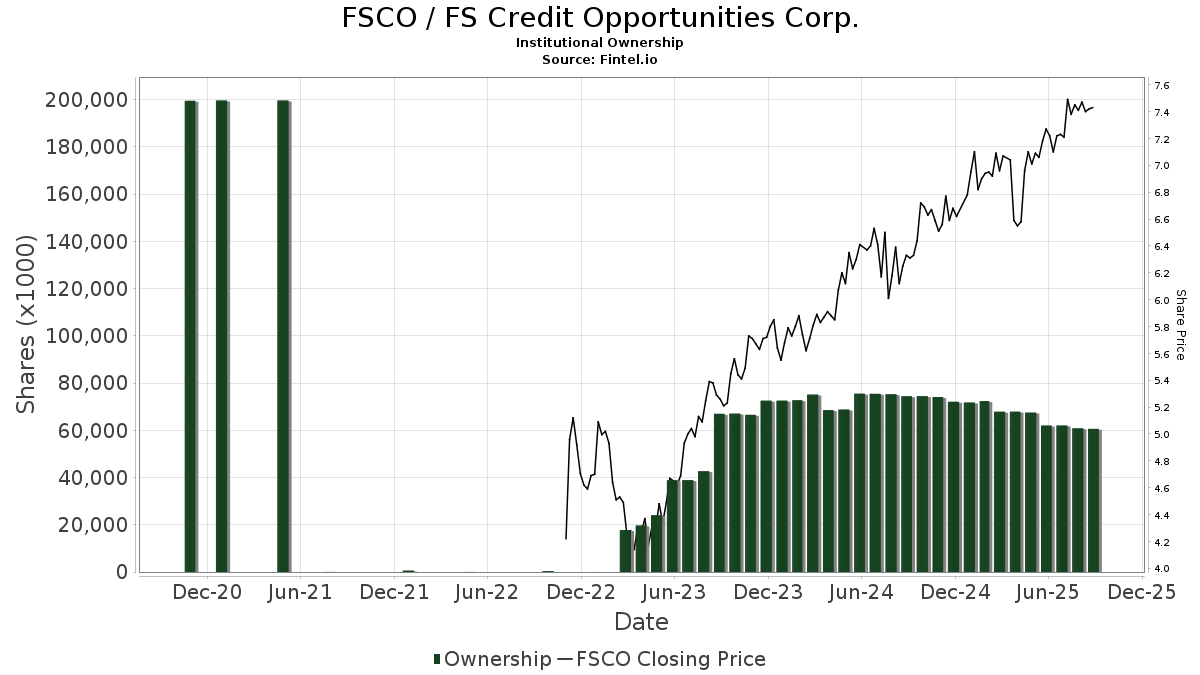
Institutionelt ejerskab og aktionærer
FS Credit Opportunities Corp. (US:FSCO) har 274 institutionelle ejere og aktionærer, der har indsendt 13D/G- eller 13F-formularer til Securities Exchange Commission (SEC). Disse institutioner har i alt 51,976,285 aktier. Største aktionærer omfatter Commonwealth Equity Services, Llc, Cambridge Investment Research Advisors, Inc., Cetera Investment Advisers, LPL Financial LLC, Vista Finance, Llc, Thomas J. Herzfeld Advisors, Inc., Blackstone Group Inc, Morgan Stanley, Envestnet Asset Management Inc, and Rockefeller Capital Management L.P. .
FS Credit Opportunities Corp. (NYSE:FSCO) institutionel ejerskabsstruktur viser aktuelle positioner i virksomheden efter institutioner og fonde, samt seneste ændringer i positionsstørrelse. Større aktionærer kan omfatte individuelle investorer, investeringsforeninger, hedgefonde eller institutioner. Skema 13D angiver, at investoren besidder (eller besidder) mere end 5 % af virksomheden og har til hensigt (eller har til hensigt at) aktivt at forfølge en ændring i forretningsstrategi. Skema 13G indikerer en passiv investering på over 5%.
The share price as of April 14, 2026 is 5,11 / share. Previously, on April 15, 2025, the share price was 6,53 / share. This represents a decline of 21,75% over that period.
Fondens stemningsscore
Fund Sentiment Score (fka Ownership Accumulation Score) finder de aktier, der bliver mest købt af fonde. Det er resultatet af en sofistikeret, multi-faktor kvantitativ model, der identificerer virksomheder med de højeste niveauer af institutionel akkumulering. Scoringsmodellen bruger en kombination af den samlede stigning i oplyste ejere, ændringerne i porteføljeallokeringer i disse ejere og andre målinger. Tallet går fra 0 til 100, hvor højere tal indikerer et højere niveau af akkumulering for sine jævnaldrende, og 50 er gennemsnittet.
Opdateringsfrekvens: Dagligt
Se Ownership Explorer, som giver en liste over højest rangerende virksomheder.
AI+ Ask Fintel’s AI assistant about FS Credit Opportunities Corp..
Select a question to share a public post with an AI-crafted answer.
Thinking of good questions…
Institutionel Put/Call-forhold
Ud over at indberette standardaktie- og gældsudstedelser skal institutter med mere end 100 mill. aktiver under forvaltning også oplyse deres put- og call-optionsbeholdninger. Da salgsoptioner generelt indikerer negativ stemning, og købsoptioner indikerer positiv stemning, kan vi få en fornemmelse af den overordnede institutionelle stemning ved at plotte forholdet mellem put og kald. Diagrammet til højre viser det historiske put/call-forhold for dette instrument.
Brug af Put/Call Ratio som en indikator for investorernes stemning overvinder en af de vigtigste mangler ved at bruge totalt institutionelt ejerskab, som er, at en betydelig mængde af aktiver under forvaltning investeres passivt for at spore indekser. Passivt forvaltede fonde køber typisk ikke optioner, så indikatoren for put/call-forholdet følger mere nøje følelsen af aktivt forvaltede fonde.
13D/G-arkivering
Vi præsenterer 13D/G ansøgninger separat fra 13F ansøgninger på grund af den forskellige behandling af SEC. 13D/G-ansøgninger kan indgives af grupper af investorer (med én ledende), hvorimod 13F-ansøgninger ikke kan. Dette resulterer i situationer, hvor en investor kan indsende en 13D/G, der rapporterer én værdi for de samlede aktier (der repræsenterer alle de aktier, der ejes af investorgruppen), men derefter indsender en 13F, der rapporterer en anden værdi for de samlede aktier (der udelukkende repræsenterer deres egne) ejendomsret). Det betyder, at aktieejerskab af 13D/G-arkiver og 13F-arkiveringer ofte ikke er direkte sammenlignelige, så vi præsenterer dem separat.
Bemærk: Fra den 16. maj 2021 viser vi ikke længere ejere, der ikke har indsendt en 13D/G inden for det seneste år. Tidligere viste vi den fulde historie af 13D/G-arkiver. Generelt skal enheder, der er forpligtet til at indgive 13D/G-ansøgninger, indgive mindst årligt, før de indsender en afsluttende ansøgning. Dog forlader fonde nogle gange positioner uden at indsende en afsluttende ansøgning (dvs. de afvikler), så visning af den fulde historie resulterede nogle gange i forvirring om det nuværende ejerskab. For at undgå forvirring viser vi nu kun 'aktuelle' ejere - det vil sige - ejere, der har anmeldt inden for det seneste år.
Upgrade to unlock premium data.
| Fil dato | Form | Investor | Forrige Aktier |
Seneste Aktier |
Δ Aktier (Procent) |
Ejendomsret (Procent) |
Δ Ejerskab (Procent) |
|
|---|---|---|---|---|---|---|---|---|
| 2025-05-07 | COMMONWEALTH EQUITY SERVICES, LLC | 10,104,494 | 9,869,575 | -2.32 | 4.90 | -3.92 |
13F og NPORT arkivering
Detaljer om 13F-arkivering er gratis. Detaljer om NP-ansøgninger kræver et premium-medlemskab. Grønne rækker angiver nye positioner. Røde rækker angiver lukkede positioner. Klik på linket ikon for at se den fulde transaktionshistorik.
Opgrader
for at låse premium-data op og eksportere til Excel ![]() .
.
| Fil dato | Kilde | Investor | Type | Gennemsnitlig pris (Øst) |
Aktier | Δ Aktier (%) |
Rapporteret Værdi ($1000) |
Δ Værdi (%) |
Port Alloc (%) |
|
|---|---|---|---|---|---|---|---|---|---|---|
| 2026-01-30 | 13F | Us Bancorp \de\ | 15.150 | 0,00 | 95 | -8,65 | ||||
| 2026-01-29 | 13F | Dunhill Financial, LLC | 30.288 | 0,00 | 191 | -9,09 | ||||
| 2026-01-22 | 13F | Curran Financial Partners, LLC | 11.112 | 0,00 | 70 | -7,89 | ||||
| 2026-01-21 | 13F | Prime Capital Investment Advisors, LLC | 425.950 | -13,83 | 2.683 | -21,43 | ||||
| 2026-02-13 | 13F | Integrity Investment Advisors, LLC | 0 | -100,00 | 0 | |||||
| 2026-02-13 | 13F | Baird Financial Group, Inc. | 125.947 | 33,80 | 793 | 22,00 | ||||
| 2026-01-28 | 13F | Absolute Investment Advisers Llc | 313.946 | 1.995 | ||||||
| 2026-04-14 | 13F | Prospera Financial Services Inc | 55.708 | -9,26 | 284 | -26,42 | ||||
| 2026-02-04 | 13F | Bensler, LLC | 0 | -100,00 | 0 | |||||
| 2026-02-12 | 13F | Principal Securities, Inc. | 0 | -100,00 | 0 | |||||
| 2026-02-02 | 13F | Ellis Investment Partners, LLC | 850.410 | 0,43 | 5.358 | -8,44 | ||||
| 2026-02-12 | 13F | Johnson Financial Group, Inc. | 500 | 3 | ||||||
| 2026-02-06 | 13F | HighTower Advisors, LLC | 43.004 | -20,82 | 271 | -28,00 | ||||
| 2026-02-13 | 13F | Denver Wealth Management, Inc. | 21.297 | -15,80 | 134 | -22,99 | ||||
| 2026-02-12 | 13F | Steward Partners Investment Advisory, Llc | 94.888 | 1,46 | 598 | -7,59 | ||||
| 2026-02-05 | 13F | Panoramic Investment Advisors, Llc | 23.963 | -8,34 | 151 | -16,67 | ||||
| 2026-02-17 | 13F | Advisor Group Holdings, Inc. | 1.184.897 | -3,24 | 7.465 | -17,55 | ||||
| 2026-02-12 | 13F | Hollencrest Capital Management | 0 | -100,00 | 0 | |||||
| 2026-02-17 | 13F | Virtus Investment Advisers, Inc. | 93.096 | 3,96 | 587 | -5,18 | ||||
| 2026-02-12 | 13F | Brinker Capital Investments, LLC | 51.795 | -91,21 | 326 | -91,99 | ||||
| 2026-02-17 | 13F | XTX Topco Ltd | 197.322 | 1.243 | ||||||
| 2026-01-29 | 13F | Huntleigh Advisors, Inc. | 67.369 | 0,00 | 424 | -8,82 | ||||
| 2026-02-10 | 13F | Foundations Investment Advisors, LLC | 29.954 | -36,74 | 189 | -42,51 | ||||
| 2026-02-12 | 13F | Wedbush Securities Inc | 42.939 | 0,00 | 0 | |||||
| 2026-04-07 | 13F | U.S. Capital Wealth Advisors, LLC | 388.400 | 1.981 | ||||||
| 2026-04-02 | 13F | Noble Wealth Management PBC | 431.914 | 8,19 | 2.203 | -12,45 | ||||
| 2026-02-12 | 13F | Virtue Capital Management, LLC | 11.290 | -99,02 | 387 | -98,69 | ||||
| 2026-03-03 | 13F | EJMK Ventures LLC | 27.153 | 171 | ||||||
| 2026-02-02 | 13F | Millstone Evans Group, LLC | 5.472 | 0,00 | 34 | -8,11 | ||||
| 2026-04-08 | 13F | First Heartland Consultants, Inc. | 32.463 | 151,65 | 166 | 103,70 | ||||
| 2026-01-26 | 13F | Independent Wealth Network Inc. | 50.704 | -2,32 | 319 | -10,89 | ||||
| 2025-11-05 | 13F | Fullcircle Wealth Llc | 17.109 | 0,00 | 108 | -16,28 | ||||
| 2026-01-22 | 13F | Harwood Advisory Group, LLC | 1.657 | 0,00 | 10 | -9,09 | ||||
| 2026-02-27 | 13F | Financially in Tune, LLC | 17.285 | 109 | ||||||
| 2026-01-30 | 13F | Wagner Wealth Management, Llc | 394.266 | -13,29 | 2.484 | -20,97 | ||||
| 2026-01-12 | 13F | Castleview Partners, Llc | 293.178 | 164,88 | 1.847 | 141,75 | ||||
| 2026-01-15 | 13F | OxenFree Capital LLC | 18.710 | 0,00 | 118 | -11,36 | ||||
| 2026-01-15 | 13F | Brookstone Capital Management | 23.060 | -10,82 | 145 | -18,54 | ||||
| 2025-11-06 | 13F | Ameritas Advisory Services, LLC | 0 | -100,00 | 0 | |||||
| 2026-02-17 | 13F | Blackstone Group Inc | 1.662.945 | 0,00 | 10.477 | -8,83 | ||||
| 2026-02-17 | 13F | Evolve Private Wealth, Llc | 18.083 | 114 | ||||||
| 2026-01-30 | 13F | Delta Investment Management, LLC | 0 | -100,00 | 0 | |||||
| 2026-01-06 | 13F | Canal Capital Management, LLC | 0 | -100,00 | 0 | -100,00 | ||||
| 2026-02-03 | 13F | We Are One Seven, LLC | 17.146 | 0,94 | 108 | -7,69 | ||||
| 2026-02-04 | 13F | Pensionmark Financial Group, Llc | 31.703 | 71,15 | 200 | 56,69 | ||||
| 2026-01-28 | 13F | Consolidated Planning Corp | 10.546 | 0,00 | 66 | -8,33 | ||||
| 2026-01-12 | 13F | VisionPoint Advisory Group, LLC | 25.480 | 161 | ||||||
| 2026-02-13 | 13F | Kestra Advisory Services, LLC | 0 | -100,00 | 0 | |||||
| 2026-02-03 | 13F | Wesbanco Bank Inc | 0 | -100,00 | 0 | |||||
| 2026-02-02 | 13F | Madrid Wealth Management, LLC | 10.272 | 65 | ||||||
| 2026-02-03 | 13F | Allegiance Financial Group Advisory Services LLC | 50.840 | 0,00 | 320 | -8,83 | ||||
| 2026-02-17 | 13F | Creative Planning | 139.529 | 12,25 | 879 | 2,45 | ||||
| 2026-02-17 | 13F | Royal Bank Of Canada | 171.367 | 0,68 | 1.080 | -8,24 | ||||
| 2026-02-04 | 13F | Summit Wealth Group Llc / Co | 183.779 | 1.145,37 | 1.158 | 1.364,56 | ||||
| 2026-02-06 | 13F | Advisory Alpha, LLC | 0 | -100,00 | 0 | |||||
| 2026-02-02 | 13F | AlphaStar Capital Management, LLC | 0 | -100,00 | 0 | |||||
| 2026-04-14 | 13F | Kozak & Associates, Inc. | 1.751 | 3,61 | 9 | -20,00 | ||||
| 2026-02-03 | 13F | Patton Albertson Miller Group, Llc | 19.149 | 0,00 | 121 | -9,09 | ||||
| 2026-02-18 | 13F | NFP Retirement, Inc. | 49.937 | 0,00 | 315 | -8,99 | ||||
| 2026-02-13 | 13F | Gen-Wealth Partners Inc | 15.821 | -17,17 | 100 | -24,43 | ||||
| 2026-02-17 | 13F | Wiley Bros.-aintree Capital, Llc | 516.757 | 3.103,30 | 3.256 | 2.832,43 | ||||
| 2026-01-26 | 13F | Merit Financial Group, LLC | 183.301 | 1,90 | 1.155 | -7,16 | ||||
| 2026-02-11 | 13F | Closed-End Fund Advisors, Inc. | 274.422 | 1.729 | ||||||
| 2026-02-03 | 13F | RFG Advisory, LLC | 122.655 | -0,86 | 773 | -9,60 | ||||
| 2026-02-13 | 13F | Morgan Stanley | 1.647.077 | 52,92 | 10.377 | 39,42 | ||||
| 2026-02-06 | 13F | Mach-1 Financial Group, Inc. | 0 | -100,00 | 0 | |||||
| 2026-01-29 | 13F | Concord Wealth Partners | 237 | 0,00 | 1 | 0,00 | ||||
| 2026-04-13 | 13F | Compass Ion Advisors, LLC | 12.806 | 0,00 | 65 | -18,75 | ||||
| 2026-02-10 | 13F | Sentinus, LLC | 66.749 | -15,33 | 421 | -22,79 | ||||
| 2026-01-22 | 13F | Apollon Wealth Management, LLC | 268.253 | 2,06 | 1.690 | -6,99 | ||||
| 2026-02-12 | 13F | Advisors Asset Management, Inc. | 757.235 | 12,45 | 4.771 | 2,51 | ||||
| 2026-04-09 | 13F | Freestate Advisors LLC | 13.663 | 3,60 | 70 | -16,87 | ||||
| 2026-02-10 | 13F/A | Northwestern Mutual Wealth Management Co | 50.234 | -0,70 | 316 | -9,46 | ||||
| 2026-02-06 | 13F | GPS Wealth Strategies Group, LLC | 16.097 | -3,33 | 101 | -12,17 | ||||
| 2026-01-27 | 13F | Financial Management Professionals, Inc. | 3.480 | 3,23 | 22 | -8,70 | ||||
| 2025-10-20 | 13F | Bravias Capital Group, LLC | 0 | -100,00 | 0 | -100,00 | ||||
| 2026-02-12 | 13F | Jane Street Group, Llc | 533.004 | 280,35 | 3.358 | 246,80 | ||||
| 2026-02-17 | 13F | IHT Wealth Management, LLC | 140.967 | 12,01 | 888 | 2,19 | ||||
| 2026-01-21 | 13F | Stock Yards Bank & Trust Co | 0 | -100,00 | 0 | |||||
| 2026-04-10 | 13F | Financial Partners Group, Inc | 12.111 | 2,03 | 62 | -15,28 | ||||
| 2026-02-12 | 13F | Marex Group plc | 401.498 | 146,19 | 2.529 | 124,60 | ||||
| 2026-01-28 | 13F | Ai Financial Services Llc | 0 | -100,00 | 0 | |||||
| 2025-11-13 | 13F | Seacrest Wealth Management, Llc | 0 | -100,00 | 0 | -100,00 | ||||
| 2026-02-17 | 13F | Wealthedge Investment Advisors, Llc | 19.029 | 0,00 | 120 | -9,16 | ||||
| 2026-02-17 | 13F | Alpine Global Management, LLC | 13.250 | 83 | ||||||
| 2026-02-02 | 13F | Mission Hills Financial Advisory, LLC | 13.612 | 86 | ||||||
| 2026-01-21 | 13F | Gerber, Llc | 14.077 | 0,00 | 89 | -9,28 | ||||
| 2026-02-06 | 13F | Cadence Wealth Management LLC | 18.093 | 3,21 | 114 | -6,61 | ||||
| 2026-02-12 | 13F | Kovack Advisors, Inc. | 220.650 | 40,84 | 1.377 | 27,17 | ||||
| 2026-02-13 | 13F | Quartz Partners, LLC | 12.388 | -14,33 | 78 | -21,21 | ||||
| 2026-04-06 | 13F | Rosenberg Matthew Hamilton | 8.859 | 0,00 | 45 | -18,18 | ||||
| 2026-01-23 | 13F | Smallwood Wealth Investment Management, LLC | 65.720 | 0,00 | 414 | -8,81 | ||||
| 2025-11-13 | 13F | Summit X, LLC | 0 | -100,00 | 0 | |||||
| 2026-04-08 | 13F | Wealth Enhancement Advisory Services, Llc | 146.540 | -28,65 | 743 | -43,70 | ||||
| 2026-01-13 | 13F | Riverbridge Partners Llc | 210.844 | 1.328 | ||||||
| 2026-02-17 | 13F | Captrust Financial Advisors | 87.983 | -0,06 | 554 | -8,88 | ||||
| 2026-04-14 | 13F | Amicus Financial Advisors, LLC | 10.818 | -31,85 | 55 | -45,00 | ||||
| 2026-01-28 | 13F | Investmark Advisory Group LLC | 97.779 | 0,34 | 616 | -8,47 | ||||
| 2026-02-13 | 13F | Colony Group, LLC | 61.319 | 14,84 | 426 | 15,49 | ||||
| 2026-02-17 | 13F | Susquehanna International Group, Llp | 55.854 | 23,93 | 352 | 12,86 | ||||
| 2026-02-18 | 13F | Beacon Pointe Advisors, LLC | 25.436 | 2,08 | 160 | -6,98 | ||||
| 2026-02-12 | 13F | Rossby Financial, LCC | 0 | -100,00 | 0 | |||||
| 2026-04-08 | 13F | Lakeridge Wealth Management LLC | 15.368 | 1,81 | 78 | -17,89 | ||||
| 2026-01-29 | 13F | Inscription Capital, LLC | 123.912 | -2,44 | 781 | -11,06 | ||||
| 2026-02-10 | 13F | IFG Advisory, LLC | 67.160 | 423 | ||||||
| 2026-04-14 | 13F | Plancorp, LLC | 43.478 | 220 | ||||||
| 2026-01-28 | 13F | West Michigan Advisors, Llc | 158.129 | 0,49 | 996 | -8,37 | ||||
| 2026-02-18 | 13F | GWM Advisors LLC | 27.870 | 404,71 | 176 | 360,53 | ||||
| 2026-03-03 | 13F | NWF Advisory Services Inc. | 0 | -100,00 | 0 | |||||
| 2026-01-09 | 13F | Capital Asset Advisory Services LLC | 23.668 | -22,50 | 152 | -28,44 | ||||
| 2026-02-09 | 13F | Blue Bell Private Wealth Management, Llc | 13.900 | 184,14 | 88 | 163,64 | ||||
| 2026-02-12 | 13F | Advocate Investing Services LLC | 6.813 | 43 | ||||||
| 2026-02-06 | 13F | Van Hulzen Asset Management, LLC | 28.710 | 0,00 | 181 | -9,09 | ||||
| 2026-02-03 | 13F | Dean, Jacobson Financial Services, LLC | 37.501 | 0,00 | 236 | -8,88 | ||||
| 2026-02-13 | 13F | Quarry LP | 125.281 | 789 | ||||||
| 2026-02-02 | 13F | Avidian Wealth Solutions, LLC | 15.075 | 0,00 | 95 | -9,62 | ||||
| 2026-01-20 | 13F | C2P Capital Advisory Group, LLC d.b.a. Prosperity Capital Advisors | 0 | -100,00 | 0 | |||||
| 2026-02-09 | 13F | Endowment Wealth Management, Inc. | 0 | -100,00 | 0 | |||||
| 2026-04-10 | 13F | Marshall Financial Group LLC | 10.217 | 0,00 | 52 | -18,75 | ||||
| 2026-02-10 | 13F | REAP Financial Group, LLC | 1.063 | 0,00 | 7 | -14,29 | ||||
| 2026-02-13 | 13F | Integrated Wealth Concepts LLC | 81.840 | -37,81 | 516 | -43,34 | ||||
| 2026-02-19 | 13F | Atomi Financial Group, Inc. | 0 | -100,00 | 0 | |||||
| 2026-02-13 | 13F | Stifel Financial Corp | 555.106 | 229,01 | 3.497 | 200,17 | ||||
| 2026-02-11 | 13F | Liberty Square Wealth Partners Llc | 34.356 | 0,29 | 216 | -8,47 | ||||
| 2026-02-11 | 13F | Jessup Wealth Management, Inc | 7.966 | 50 | ||||||
| 2026-02-02 | 13F | Souders Financial Advisors | 0 | -100,00 | 0 | |||||
| 2026-02-09 | 13F | Integrity Advisory Solutions, LLC | 15.998 | 0,00 | 101 | -9,09 | ||||
| 2026-02-12 | 13F | Concorde Asset Management, LLC | 145.153 | 2,48 | 914 | -4,49 | ||||
| 2026-02-09 | 13F | Hartland & Co., LLC | 3.987 | 0,00 | 25 | -7,41 | ||||
| 2026-02-17 | 13F | Russell Investments Group, Ltd. | 1.507 | -14,18 | 9 | -25,00 | ||||
| 2026-02-03 | 13F | Crossmark Global Holdings, Inc. | 0 | -100,00 | 0 | |||||
| 2026-02-13 | 13F | Golden State Wealth Management, LLC | 56.759 | -0,98 | 358 | -9,85 | ||||
| 2026-02-09 | 13F | Allen Capital Group, LLC | 127.630 | -1,28 | 804 | -9,97 | ||||
| 2025-11-14 | 13F | Imprint Wealth LLC | 0 | -100,00 | 0 | |||||
| 2025-11-14 | 13F | Binnacle Investments Inc | 33.132 | 0,00 | 229 | -5,00 | ||||
| 2026-01-30 | 13F | Keybank National Association/oh | 26.363 | 0,00 | 166 | -8,79 | ||||
| 2026-02-13 | 13F | Centaurus Financial, Inc. | 16.235 | -11,79 | 0 | |||||
| 2026-04-06 | 13F | CX Institutional | 7.509 | 0,00 | 0 | |||||
| 2026-02-03 | 13F | Anfield Capital Management, LLC | 37.956 | 0,00 | 239 | -8,78 | ||||
| 2026-02-17 | 13F | Valley Financial Group, Inc. | 16.284 | -20,03 | 103 | -27,14 | ||||
| 2026-02-17 | 13F | Raymond James Financial Inc | 1.007.989 | 51,87 | 6.350 | 38,46 | ||||
| 2026-01-29 | 13F | Comerica Bank | 0 | -100,00 | 0 | |||||
| 2026-02-04 | 13F | Valeo Financial Advisors, LLC | 15.191 | 0,97 | 96 | -7,77 | ||||
| 2026-02-13 | 13F | Jacobi Capital Management LLC | 29.546 | 2,11 | 186 | -6,53 | ||||
| 2026-01-16 | 13F | Legacy Capital Wealth Partners, LLC | 28.800 | 0,00 | 181 | -9,05 | ||||
| 2026-02-13 | 13F | Venture Visionary Partners LLC | 18.771 | 0,00 | 118 | -8,53 | ||||
| 2026-02-10 | 13F | Impact Partnership Wealth, LLC | 62.933 | 396 | ||||||
| 2026-02-12 | 13F | Great Valley Advisor Group, Inc. | 34.921 | -57,76 | 220 | -61,47 | ||||
| 2026-02-17 | 13F | Jones Financial Companies Lllp | 7.824 | 49 | ||||||
| 2026-01-26 | 13F | Consolidated Portfolio Review Corp | 0 | -100,00 | 0 | |||||
| 2026-04-14 | 13F | Moisand Fitzgerald Tamayo, LLC | 1.063 | 0,00 | 5 | -16,67 | ||||
| 2026-02-06 | 13F | Signature Estate & Investment Advisors Llc | 20.964 | 0,00 | 132 | -8,33 | ||||
| 2026-01-16 | 13F | Oregon Pacific Wealth Management, LLC | 23.060 | 0,00 | 145 | -8,81 | ||||
| 2026-02-05 | 13F | Western Wealth Management, LLC | 21.184 | -5,25 | 133 | -13,64 | ||||
| 2026-02-10 | 13F | WCG Wealth Advisors LLC | 73.164 | 34,54 | 461 | 22,67 | ||||
| 2026-01-21 | 13F | Newbridge Financial Services Group, Inc. | 0 | -100,00 | 0 | |||||
| 2026-04-09 | 13F | ASL Financial, LLC | 19.365 | 0,00 | 99 | -19,67 | ||||
| 2026-02-04 | 13F | Foundry Financial Group, Inc. | 38.062 | 0,00 | 240 | -9,13 | ||||
| 2026-01-26 | 13F | Patriot Financial Group Insurance Agency, LLC | 358.852 | 2,24 | 2.261 | -6,80 | ||||
| 2026-02-17 | 13F | Two Sigma Securities, Llc | 23.576 | 149 | ||||||
| 2026-02-13 | 13F | Ausdal Financial Partners, Inc. | 202.130 | -28,19 | 1.273 | -34,52 | ||||
| 2026-01-28 | 13F | Geneos Wealth Management Inc. | 122.855 | -78,25 | 774 | -80,19 | ||||
| 2026-01-08 | 13F | Maridea Wealth Management LLC | 74.940 | 2,16 | 472 | -2,48 | ||||
| 2026-02-05 | 13F | Cambridge Investment Research Advisors, Inc. | 4.241.218 | -7,33 | 27 | -16,13 | ||||
| 2026-02-17 | 13F | Ameriflex Group, Inc. | 11.560 | -50,00 | 73 | -54,72 | ||||
| 2026-02-09 | 13F | Integrity Alliance, Llc. | 19.875 | -40,58 | 125 | -45,89 | ||||
| 2026-02-13 | 13F/A | Abound Financial, Llc | 2.673 | 17 | ||||||
| 2026-02-10 | 13F | Bank of New York Mellon Corp | 280.848 | 21,81 | 1.769 | 11,05 | ||||
| 2026-01-27 | 13F | Paul Damon & Associates, Inc. | 0 | -100,00 | 0 | |||||
| 2026-02-17 | 13F | Strive Financial Group ,LLC | 3.616 | 23 | ||||||
| 2026-02-12 | 13F | Commonwealth Equity Services, Llc | 6.988.246 | -16,40 | 44.026 | 77.136,84 | ||||
| 2026-04-06 | 13F | Miller Global Investments, LLC | 177.456 | -0,07 | 905 | -19,05 | ||||
| 2026-01-27 | 13F | Clark Asset Management, LLC | 29.974 | 0,00 | 189 | -9,18 | ||||
| 2026-02-19 | 13F | Invesco Ltd. | 455.593 | 23,23 | 2.870 | 12,37 | ||||
| 2026-02-02 | 13F | Oppenheimer & Co Inc | 124.923 | 50,00 | 787 | 36,87 | ||||
| 2026-02-11 | 13F | Strategic Financial Partners, Ltd. | 79.652 | -20,86 | 502 | -27,91 | ||||
| 2026-02-02 | 13F | Chung Wu Investment Group, LLC | 900 | 0,00 | 6 | -16,67 | ||||
| 2026-02-02 | 13F | Benjamin Edwards Inc | 14.328 | 5,37 | 90 | -3,23 | ||||
| 2026-02-06 | 13F | Bare Financial Services, Inc | 0 | -100,00 | 0 | |||||
| 2026-02-04 | 13F | BankPlus Wealth Management LLC | 20.000 | 0,00 | 126 | -8,70 | ||||
| 2026-04-08 | 13F | BOS Asset Management, LLC | 33.537 | 0,00 | 171 | -18,96 | ||||
| 2025-11-14 | 13F | Sofos Investments, Inc. | 0 | -100,00 | 0 | |||||
| 2026-02-11 | 13F | Cerity Partners LLC | 20.687 | 31,87 | 130 | 20,37 | ||||
| 2026-02-14 | 13F | Rockefeller Capital Management L.P. | 1.295.650 | 4,89 | 8.163 | -4,37 | ||||
| 2026-01-20 | 13F | Steel Peak Wealth Management LLC | 0 | -100,00 | 0 | |||||
| 2025-11-14 | 13F | Citadel Advisors Llc | 0 | -100,00 | 0 | |||||
| 2026-01-15 | 13F | Ironwood Financial, llc | 0 | -100,00 | 0 | |||||
| 2026-01-15 | 13F | Stewardship Advisors, LLC | 25.906 | 0,86 | 163 | -7,91 | ||||
| 2026-02-17 | 13F | Modern Wealth Management, LLC | 181.609 | 7,95 | 1.144 | -1,55 | ||||
| 2026-04-15 | 13F | Exchange Traded Concepts, Llc | 0 | -100,00 | 0 | |||||
| 2026-02-12 | 13F | Andina Capital Management, LLC | 18.650 | 1,36 | 117 | -7,87 | ||||
| 2026-01-22 | 13F | Fiduciary Alliance LLC | 15.083 | -47,02 | 95 | -51,53 | ||||
| 2025-10-21 | 13F | Optimum Investment Advisors | 2.200 | 0,00 | 15 | 0,00 | ||||
| 2026-04-07 | 13F | Park Avenue Securities Llc | 17.470 | 0,00 | 0 | |||||
| 2025-10-15 | 13F | Norden Group Llc | 0 | -100,00 | 0 | |||||
| 2026-04-14 | 13F | Vestia Personal Wealth Advisors | 17.330 | 4,23 | 88 | -16,98 | ||||
| 2026-02-10 | 13F | Carnegie Lake Advisors LLC | 21.663 | 0,00 | 136 | -8,72 | ||||
| 2026-01-09 | 13F | Capital CS Group, LLC | 27.625 | 3,21 | 174 | -5,43 | ||||
| 2026-01-15 | 13F | MFA Wealth Services | 25.510 | 1,19 | 161 | -8,05 | ||||
| 2025-11-13 | 13F | Total Investment Management Inc | 0 | -100,00 | 0 | |||||
| 2026-04-13 | 13F | Mather Group, Llc. | 5.489 | 28 | ||||||
| 2026-01-29 | 13F | Concurrent Investment Advisors, LLC | 72.137 | -16,60 | 454 | -23,95 | ||||
| 2026-02-13 | 13F | Glen Eagle Advisors, LLC | 11.084 | 2,99 | 70 | -6,76 | ||||
| 2025-10-24 | 13F | Meeder Advisory Services, Inc. | 0 | -100,00 | 0 | |||||
| 2026-03-04 | 13F | Rehmann Capital Advisory Group | 0 | -100,00 | 0 | |||||
| 2026-01-27 | 13F | Vista Finance, Llc | 2.072.555 | -4,49 | 13.057 | -12,92 | ||||
| 2026-02-06 | 13F | EverSource Wealth Advisors, LLC | 7.773 | 0,00 | 49 | -9,43 | ||||
| 2026-02-13 | 13F | Arkadios Wealth Advisors | 109.838 | -10,56 | 692 | -18,51 | ||||
| 2026-02-10 | 13F | Moors & Cabot, Inc. | 34.179 | -15,75 | 215 | -23,21 | ||||
| 2026-02-13 | 13F | Mariner, LLC | 385.692 | -2,93 | 2.430 | -11,51 | ||||
| 2026-02-13 | 13F | Visionary Wealth Advisors | 11.273 | -91,56 | 71 | -92,30 | ||||
| 2026-02-13 | 13F | Aptus Capital Advisors, LLC | 11.473 | 0,00 | 72 | -8,86 | ||||
| 2026-02-02 | 13F | Truist Financial Corp | 20.082 | 0,00 | 127 | -8,70 | ||||
| 2026-02-04 | 13F | Certior Financial Group, Llc | 289.753 | 0,68 | 1.825 | -8,20 | ||||
| 2026-02-12 | 13F | Sit Investment Associates Inc | 0 | -100,00 | 0 | |||||
| 2026-01-28 | 13F | Kingswood Wealth Advisors, Llc | 52.039 | -6,57 | 328 | -14,84 | ||||
| 2026-02-17 | 13F | Cetera Investment Advisers | 2.908.952 | -30,34 | 18.326 | -36,49 | ||||
| 2026-02-17 | 13F | Mercer Global Advisors Inc /adv | 78.279 | -2,26 | 493 | -10,85 | ||||
| 2026-02-13 | 13F | Mill Creek Capital Advisors, LLC | 21.423 | -57,18 | 135 | -61,16 | ||||
| 2026-02-12 | 13F | WealthPLAN Partners, LLC | 36.032 | 0,00 | 227 | -8,47 | ||||
| 2026-01-12 | 13F | Divergent Planning, LLC | 10.146 | -8,01 | 64 | -15,79 | ||||
| 2026-02-13 | 13F | SRS Capital Advisors, Inc. | 78.674 | 117,10 | 496 | 98,00 | ||||
| 2026-02-09 | 13F | Bleakley Financial Group, LLC | 47.088 | -16,23 | 297 | -23,71 | ||||
| 2026-02-03 | 13F | Apeiron RIA LLC | 69.726 | -2,10 | 418 | -10,32 | ||||
| 2026-02-13 | 13F | Bay Colony Advisory Group, Inc d/b/a Bay Colony Advisors | 0 | -100,00 | 0 | -100,00 | ||||
| 2025-11-06 | 13F | Naviter Wealth, LLC | 0 | -100,00 | 0 | |||||
| 2026-01-07 | 13F | Gilbert & Cook, Inc. | 0 | -100,00 | 0 | |||||
| 2026-04-08 | 13F | Heritage Family Offices, LLP | 21.626 | -32,36 | 110 | -45,27 | ||||
| 2026-01-27 | 13F | Symmetry Partners, LLC | 16.003 | 0,00 | 101 | -9,09 | ||||
| 2026-02-06 | 13F | Larson Financial Group LLC | 8.172 | 73,06 | 51 | 59,38 | ||||
| 2026-01-13 | 13F | Signal Advisors Wealth, LLC | 107.510 | -10,09 | 677 | -18,04 | ||||
| 2026-02-11 | 13F | LPL Financial LLC | 2.546.344 | -2,55 | 16.042 | -11,15 | ||||
| 2026-04-13 | 13F | LexAurum Advisors, LLC | 24.945 | -28,01 | 127 | -46,86 | ||||
| 2026-04-07 | 13F | Farther Finance Advisors, LLC | 21.558 | 125,05 | 111 | 85,00 | ||||
| 2026-01-26 | 13F | BLB&B Advisors, LLC | 15.200 | 0,00 | 96 | -9,52 | ||||
| 2026-02-20 | 13F | Sunbelt Securities, Inc. | 10.000 | 0,00 | 63 | -8,70 | ||||
| 2026-04-10 | 13F | Perigon Wealth Management, LLC | 13.705 | -26,14 | 70 | -40,52 | ||||
| 2026-02-10 | 13F | COFG Advisors, LLC | 68.499 | 432 | ||||||
| 2026-01-16 | 13F | BridgePort Financial Solutions, LLC | 12.237 | 0,00 | 77 | -8,33 | ||||
| 2026-02-03 | 13F | Grimes & Company, Inc. | 12.044 | -85,72 | 76 | -87,11 | ||||
| 2026-04-07 | 13F | CoreCap Advisors, LLC | 10.800 | 2,22 | 55 | -16,67 | ||||
| 2026-04-14 | 13F | Wealthcare Advisory Partners LLC | 107.326 | -0,27 | 547 | -19,20 | ||||
| 2026-01-26 | 13F | AE Wealth Management LLC | 25.941 | -4,95 | 163 | -13,30 | ||||
| 2026-01-20 | 13F | Stratos Wealth Partners, LTD. | 334.302 | -8,57 | 2.106 | -16,63 | ||||
| 2026-01-07 | 13F | Cahaba Wealth Management, Inc. | 28.578 | 3,24 | 180 | -5,76 | ||||
| 2026-01-26 | 13F | PFG Investments, LLC | 93.879 | -31,36 | 591 | -37,46 | ||||
| 2026-01-13 | 13F | Adamsbrown Wealth Consultants Llc | 12.456 | -20,45 | 78 | -27,78 | ||||
| 2026-02-17 | 13F/A | Vance Wealth, Inc. | 21.195 | 0,00 | 134 | -8,90 | ||||
| 2026-01-14 | 13F | Spire Wealth Management | 5.670 | 0,00 | 36 | -10,26 | ||||
| 2026-02-10 | 13F | Envestnet Asset Management Inc | 1.307.424 | 29,75 | 8.237 | 18,30 | ||||
| 2026-02-05 | 13F | WealthPlan Investment Management, LLC | 95.585 | -11,26 | 602 | -19,09 | ||||
| 2026-02-06 | 13F | CWS Financial Advisors, LLC | 15.201 | 0,00 | 96 | -9,52 | ||||
| 2025-11-07 | 13F | Beacon Capital Management, LLC | 0 | -100,00 | 0 | |||||
| 2026-01-26 | 13F | Paradigm Financial Partners, Llc | 145.518 | -0,85 | 917 | -9,66 | ||||
| 2026-02-06 | 13F | Global Retirement Partners, LLC | 7.054 | 0,00 | 44 | -8,33 | ||||
| 2026-01-29 | 13F | Sanctuary Advisors, LLC | 31.873 | -77,10 | 201 | -79,19 | ||||
| 2026-02-13 | 13F | First Trust Advisors Lp | 472.685 | -1,75 | 2.978 | -10,44 | ||||
| 2026-01-23 | 13F | Rsm Us Wealth Management Llc | 127.864 | 71,74 | 801 | 55,84 | ||||
| 2026-02-06 | 13F | Csenge Advisory Group | 55.217 | -0,22 | 348 | -9,16 | ||||
| 2026-02-19 | 13F/A | Axxcess Wealth Management, Llc | 23.668 | -22,50 | 149 | -29,38 | ||||
| 2026-02-12 | 13F | CF Capital LLC | 27.334 | 172 | ||||||
| 2026-02-13 | 13F | Perryman Financial Advisory Inc /ad | 180.485 | 1.137 | ||||||
| 2026-01-21 | 13F | Ergawealth Advisors, Inc. | 0 | -100,00 | 0 | |||||
| 2026-02-17 | 13F | Nomura Holdings Inc | 37.660 | 237 | ||||||
| 2026-01-26 | 13F | Annex Advisory Services, LLC | 38.724 | 244 | ||||||
| 2026-02-17 | 13F | Tower Research Capital LLC (TRC) | 479 | 3 | ||||||
| 2026-01-26 | 13F | Townsend & Associates, Inc | 14.999 | 0,00 | 97 | 1,04 | ||||
| 2025-11-12 | 13F | Kingsview Wealth Management, LLC | 0 | -100,00 | 0 | |||||
| 2026-01-16 | 13F | Catalina Capital Group, LLC | 42.759 | -35,31 | 269 | -41,01 | ||||
| 2026-01-29 | 13F | UBS Group AG | 164.427 | 17,23 | 1.036 | 6,81 | ||||
| 2026-02-09 | 13F | Global Assets Advisory, LLC | 26.650 | 0,00 | 168 | -9,24 | ||||
| 2026-02-13 | 13F | Inspire Advisors, LLC | 37.657 | 0,00 | 237 | -8,85 | ||||
| 2026-02-03 | 13F | Koshinski Asset Management, Inc. | 16.988 | -21,88 | 107 | -28,67 | ||||
| 2026-02-17 | 13F | Perennial Investment Advisors, LLC | 18.069 | 1,17 | 114 | -8,13 | ||||
| 2026-01-15 | 13F | Cannon Advisors, Inc. | 21.061 | 3,21 | 136 | 0,00 | ||||
| 2026-04-07 | 13F | Cooper Financial Group | 10.556 | 0,09 | 54 | -19,70 | ||||
| 2026-04-13 | 13F | IFP Advisors, Inc | 55.975 | 0,12 | 285 | -19,03 | ||||
| 2026-02-11 | 13F | Strategic Advocates LLC | 33.117 | 0,00 | 207 | -9,65 | ||||
| 2026-02-05 | 13F | Intrua Financial, LLC | 27.130 | 0,00 | 171 | -9,09 | ||||
| 2026-02-03 | 13F | Sequoia Financial Advisors, LLC | 67.473 | -8,29 | 425 | -16,34 | ||||
| 2026-01-14 | 13F | Worth Asset Management, LLC | 13.760 | -54,32 | 87 | -58,65 | ||||
| 2026-02-06 | 13F | Pnc Financial Services Group, Inc. | 3.132 | 20 | ||||||
| 2026-01-21 | 13F | Sound Income Strategies, LLC | 1.581 | 0,00 | 10 | -9,09 | ||||
| 2026-02-17 | 13F | Bank Of America Corp /de/ | 983 | 6 | ||||||
| 2026-01-27 | 13F | Steele Capital Management, Inc. | 60.000 | 0,00 | 378 | -8,70 | ||||
| 2026-03-13 | 13F | Fund Advisors of America Inc/FL | 312.684 | 1.970 | ||||||
| 2026-02-12 | 13F | Summit Financial, LLC | 1.067.180 | -2,85 | 6.723 | -11,42 | ||||
| 2026-02-11 | 13F | J.w. Cole Advisors, Inc. | 120.427 | -17,53 | 759 | -24,80 | ||||
| 2026-02-17 | 13F | Quadrature Capital Ltd | 0 | -100,00 | 0 | |||||
| 2026-01-20 | 13F | AdvisorNet Financial, Inc | 15.399 | 6,65 | 97 | -2,02 | ||||
| 2026-02-05 | 13F | Atlas Private Wealth Advisors | 21.343 | -10,50 | 134 | -18,29 | ||||
| 2026-01-23 | 13F | Tyche Wealth Partners LLC | 12.096 | 0,00 | 76 | -8,43 | ||||
| 2026-04-08 | 13F | Presidio Capital Management, LLC | 24.100 | 2,37 | 123 | -17,57 | ||||
| 2026-04-13 | 13F | Creative Financial Designs Inc /adv | 134.124 | -9,04 | 684 | -26,29 | ||||
| 2026-01-14 | 13F | ORG Partners LLC | 34.841 | 0,00 | 219 | -8,75 | ||||
| 2026-01-21 | 13F | Flagship Harbor Advisors, Llc | 4.000 | -81,92 | 25 | -83,55 | ||||
| 2026-02-05 | 13F | Cornerstone Wealth Management, LLC | 339.767 | 10,43 | 2.141 | 0,66 | ||||
| 2026-02-17 | 13F | LaSalle St. Investment Advisors, LLC | 0 | -100,00 | 0 | |||||
| 2026-01-29 | 13F | Kercheville Advisors, LLC | 0 | -100,00 | 0 | |||||
| 2026-02-17 | 13F | Harvest Investment Services, LLC | 74.395 | -15,17 | 469 | -22,77 | ||||
| 2026-02-03 | 13F | Channel Wealth Llc | 42.666 | -4,16 | 269 | -12,70 | ||||
| 2026-02-13 | 13F | Thomas J. Herzfeld Advisors, Inc. | 1.899.781 | 97,17 | 11.969 | 79,78 | ||||
| 2026-02-13 | 13F | Arete Wealth Advisors, LLC | 76.423 | 6,60 | 0 | |||||
| 2026-02-05 | 13F | Allworth Financial LP | 59.327 | 0,40 | 374 | -8,58 | ||||
| 2026-01-30 | 13F | Strategic Blueprint, LLC | 67.273 | -18,00 | 424 | -25,27 | ||||
| 2026-01-26 | 13F | Cwm, Llc | 280.986 | 9,95 | 2 | 0,00 | ||||
| 2026-01-29 | 13F | Matisse Capital | 897.918 | 5.657 | ||||||
| 2026-02-12 | 13F | Walled Lake Planning & Wealth Management, Llc | 45.650 | 0,00 | 288 | -8,89 | ||||
| 2026-02-03 | 13F | Acorn Financial Advisory Services Inc /adv | 17.220 | -59,21 | 108 | -62,89 | ||||
| 2026-02-17 | 13F | Private Advisor Group, LLC | 177.202 | -28,38 | 1.116 | -34,70 | ||||
| 2026-02-18 | 13F | Strong Retirement Solutions LLC | 105.245 | 663 | ||||||
| 2026-02-09 | 13F | Harbour Investments, Inc. | 423.953 | -3,68 | 2.671 | -12,20 | ||||
| 2025-11-14 | 13F | Keystone Financial Group | 11.138 | 0,00 | 81 | 0,00 | ||||
| 2025-11-06 | 13F | Assetmark, Inc | 0 | -100,00 | 0 | |||||
| 2026-02-13 | 13F | McAdam, LLC | 89.768 | -35,02 | 566 | -40,78 | ||||
| 2026-01-28 | 13F | WPG Advisers, LLC | 2.604 | -76,09 | 16 | -78,67 | ||||
| 2026-01-28 | 13F | Diversified Enterprises, LLC | 131.965 | 831 | ||||||
| 2025-10-22 | 13F | Gladstone Institutional Advisory LLC | 0 | -100,00 | 0 | |||||
| 2026-02-17 | 13F | Bramshill Investments, LLC | 102.456 | 0,91 | 645 | -7,99 | ||||
| 2026-01-21 | 13F | Raleigh Capital Management Inc. | 0 | 0 | ||||||
| 2026-02-13 | 13F | Robinson Capital Management, Llc | 40.300 | 254 | ||||||
| 2025-11-12 | 13F | Transce3nd, LLC | 0 | -100,00 | 0 | |||||
| 2026-02-12 | 13F | Wealthspire Advisors, LLC | 0 | -100,00 | 0 | |||||
| 2026-01-13 | 13F | Kathmere Capital Management, LLC | 120.087 | 0,00 | 757 | -8,81 | ||||
| 2026-02-17 | 13F | Second Line Capital, LLC | 11.473 | 0,00 | 72 | -8,86 | ||||
| 2026-02-13 | 13F | Wells Fargo & Company/mn | 709 | -87,10 | 4 | -89,19 | ||||
| 2026-02-03 | 13F | Centerpoint Advisory Group | 62.079 | 3,67 | 391 | -5,33 | ||||
| 2026-02-11 | 13F | Jpmorgan Chase & Co | 6.702 | 0,00 | 42 | -8,70 | ||||
| 2026-01-07 | 13F | Precedent Wealth Partners, Llc | 0 | -100,00 | 0 |