Grundlæggende statistik
| Institutionelle ejere | 221 total, 221 long only, 0 short only, 0 long/short - change of 12,24% MRQ |
| Gennemsnitlig porteføljeallokering | 0.3974 % - change of -3,79% MRQ |
| Institutionelle aktier (lange) | 43.919.239 (ex 13D/G) - change of 3,37MM shares 8,34% MRQ |
| Institutionel værdi (lang) | $ 1.753.027 USD ($1000) |
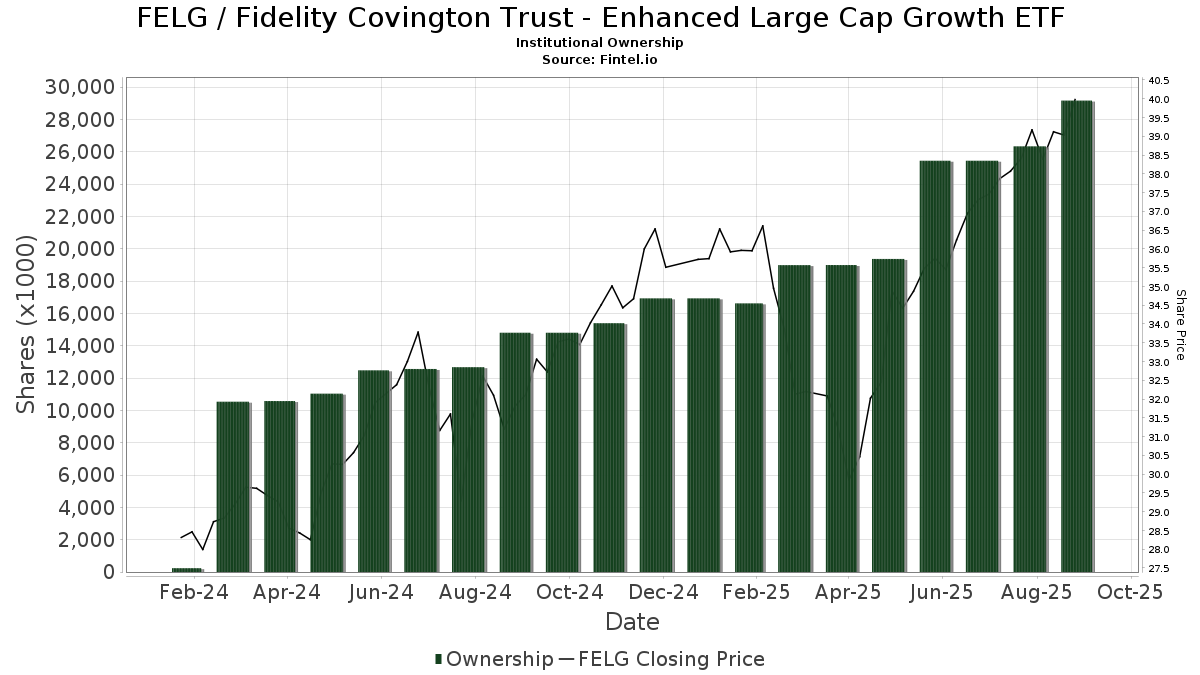
Institutionelt ejerskab og aktionærer
Fidelity Covington Trust - Fidelity Enhanced Large Cap Growth ETF (US:FELG) har 221 institutionelle ejere og aktionærer, der har indsendt 13D/G- eller 13F-formularer til Securities Exchange Commission (SEC). Disse institutioner har i alt 43,919,239 aktier. Største aktionærer omfatter Vantagepoint Investment Advisers Llc, Mml Investors Services, Llc, Envestnet Asset Management Inc, Commonwealth Equity Services, Llc, LPL Financial LLC, Raymond James Financial Inc, Independence Financial Advisors, LLC, Equitable Holdings, Inc., Advisor Group Holdings, Inc., and Northwestern Mutual Wealth Management Co .
Fidelity Covington Trust - Fidelity Enhanced Large Cap Growth ETF (ARCA:FELG) institutionel ejerskabsstruktur viser aktuelle positioner i virksomheden efter institutioner og fonde, samt seneste ændringer i positionsstørrelse. Større aktionærer kan omfatte individuelle investorer, investeringsforeninger, hedgefonde eller institutioner. Skema 13D angiver, at investoren besidder (eller besidder) mere end 5 % af virksomheden og har til hensigt (eller har til hensigt at) aktivt at forfølge en ændring i forretningsstrategi. Skema 13G indikerer en passiv investering på over 5%.
The share price as of April 24, 2026 is 42,18 / share. Previously, on April 28, 2025, the share price was 31,83 / share. This represents an increase of 32,52% over that period.
Fondens stemningsscore
Fund Sentiment Score (fka Ownership Accumulation Score) finder de aktier, der bliver mest købt af fonde. Det er resultatet af en sofistikeret, multi-faktor kvantitativ model, der identificerer virksomheder med de højeste niveauer af institutionel akkumulering. Scoringsmodellen bruger en kombination af den samlede stigning i oplyste ejere, ændringerne i porteføljeallokeringer i disse ejere og andre målinger. Tallet går fra 0 til 100, hvor højere tal indikerer et højere niveau af akkumulering for sine jævnaldrende, og 50 er gennemsnittet.
Opdateringsfrekvens: Dagligt
Se Ownership Explorer, som giver en liste over højest rangerende virksomheder.
AI+ Ask Fintel’s AI assistant about Fidelity Covington Trust - Fidelity Enhanced Large Cap Growth ETF.
Select a question to share a public post with an AI-crafted answer.
Thinking of good questions…
Institutionel Put/Call-forhold
Ud over at indberette standardaktie- og gældsudstedelser skal institutter med mere end 100 mill. aktiver under forvaltning også oplyse deres put- og call-optionsbeholdninger. Da salgsoptioner generelt indikerer negativ stemning, og købsoptioner indikerer positiv stemning, kan vi få en fornemmelse af den overordnede institutionelle stemning ved at plotte forholdet mellem put og kald. Diagrammet til højre viser det historiske put/call-forhold for dette instrument.
Brug af Put/Call Ratio som en indikator for investorernes stemning overvinder en af de vigtigste mangler ved at bruge totalt institutionelt ejerskab, som er, at en betydelig mængde af aktiver under forvaltning investeres passivt for at spore indekser. Passivt forvaltede fonde køber typisk ikke optioner, så indikatoren for put/call-forholdet følger mere nøje følelsen af aktivt forvaltede fonde.
13D/G-arkivering
Vi præsenterer 13D/G ansøgninger separat fra 13F ansøgninger på grund af den forskellige behandling af SEC. 13D/G-ansøgninger kan indgives af grupper af investorer (med én ledende), hvorimod 13F-ansøgninger ikke kan. Dette resulterer i situationer, hvor en investor kan indsende en 13D/G, der rapporterer én værdi for de samlede aktier (der repræsenterer alle de aktier, der ejes af investorgruppen), men derefter indsender en 13F, der rapporterer en anden værdi for de samlede aktier (der udelukkende repræsenterer deres egne) ejendomsret). Det betyder, at aktieejerskab af 13D/G-arkiver og 13F-arkiveringer ofte ikke er direkte sammenlignelige, så vi præsenterer dem separat.
Bemærk: Fra den 16. maj 2021 viser vi ikke længere ejere, der ikke har indsendt en 13D/G inden for det seneste år. Tidligere viste vi den fulde historie af 13D/G-arkiver. Generelt skal enheder, der er forpligtet til at indgive 13D/G-ansøgninger, indgive mindst årligt, før de indsender en afsluttende ansøgning. Dog forlader fonde nogle gange positioner uden at indsende en afsluttende ansøgning (dvs. de afvikler), så visning af den fulde historie resulterede nogle gange i forvirring om det nuværende ejerskab. For at undgå forvirring viser vi nu kun 'aktuelle' ejere - det vil sige - ejere, der har anmeldt inden for det seneste år.
Upgrade to unlock premium data.
| Fil dato | Form | Investor | Forrige Aktier |
Seneste Aktier |
Δ Aktier (Procent) |
Ejendomsret (Procent) |
Δ Ejerskab (Procent) |
|
|---|---|---|---|---|---|---|---|---|
| 2025-10-07 | International City Management Association Retirement Corp | 8,231,070 | 7.60 |
13F og NPORT arkivering
Detaljer om 13F-arkivering er gratis. Detaljer om NP-ansøgninger kræver et premium-medlemskab. Grønne rækker angiver nye positioner. Røde rækker angiver lukkede positioner. Klik på linket ikon for at se den fulde transaktionshistorik.
Opgrader
for at låse premium-data op og eksportere til Excel ![]() .
.
| Fil dato | Kilde | Investor | Type | Gennemsnitlig pris (Øst) |
Aktier | Δ Aktier (%) |
Rapporteret Værdi ($1000) |
Δ Værdi (%) |
Port Alloc (%) |
|
|---|---|---|---|---|---|---|---|---|---|---|
| 2026-01-23 | 13F | Assetmark, Inc | 1.741 | 73 | ||||||
| 2026-02-04 | 13F | Valeo Financial Advisors, LLC | 17.535 | 0,09 | 731 | 1,53 | ||||
| 2026-04-15 | 13F | Regatta Capital Group, Llc | 7.176 | 0,08 | 269 | -9,73 | ||||
| 2026-02-10 | 13F | Hazlett, Burt & Watson, Inc. | 594 | 0,17 | 0 | |||||
| 2026-02-13 | 13F | Pathstone Holdings, LLC | 10.002 | -3,39 | 417 | -1,88 | ||||
| 2026-02-04 | 13F | LRI Investments, LLC | 51 | 0,00 | 2 | 0,00 | ||||
| 2026-01-27 | 13F | Summit Financial Wealth Advisors, LLC | 10.541 | 440 | ||||||
| 2026-02-11 | 13F | O'shaughnessy Asset Management, Llc | 5.089 | 18,05 | 212 | 19,77 | ||||
| 2026-01-20 | 13F | Stratos Wealth Partners, LTD. | 13.401 | 74,58 | 559 | 77,14 | ||||
| 2026-02-12 | 13F | Steward Partners Investment Advisory, Llc | 13.488 | 42,17 | 562 | 44,10 | ||||
| 2025-11-07 | 13F | Salus Financial Advisors, LLC | 0 | -100,00 | 0 | |||||
| 2026-01-30 | 13F | Us Bancorp \de\ | 4.087 | 0,00 | 170 | 1,19 | ||||
| 2026-02-12 | 13F | Colonial Trust Advisors | 1.121 | 0,00 | 47 | 0,00 | ||||
| 2026-02-17 | 13F | Quantinno Capital Management LP | 7.157 | -10,63 | 298 | -9,42 | ||||
| 2026-01-20 | 13F | Family Legacy Financial Solutions, LLC | 0 | -100,00 | 0 | |||||
| 2026-02-05 | 13F | Mission Wealth Management, Lp | 6.614 | 276 | ||||||
| 2026-02-13 | 13F | Maia Wealth LLC | 11.529 | 0,03 | 454 | -6,58 | ||||
| 2026-04-14 | 13F | Drive Wealth Management, Llc | 0 | -100,00 | 0 | |||||
| 2026-04-17 | 13F | Gibson Capital, LLC | 14.121 | 0,00 | 529 | -10,03 | ||||
| 2026-04-08 | 13F | RDA Financial Network | 6.516 | 244 | ||||||
| 2026-02-09 | 13F | Bleakley Financial Group, LLC | 300.801 | 12.543 | ||||||
| 2026-01-29 | 13F | Verdence Capital Advisors LLC | 11.202 | 0,09 | 467 | -1,68 | ||||
| 2026-02-12 | 13F | Great Valley Advisor Group, Inc. | 13.903 | -1,07 | 580 | 0,35 | ||||
| 2026-01-15 | 13F | Clg Llc | 8.619 | 54,85 | 359 | 57,46 | ||||
| 2026-04-17 | 13F | IFC & Insurance Marketing, Inc. | 0 | -100,00 | 0 | |||||
| 2026-04-07 | 13F | CoreCap Advisors, LLC | 3.103 | -5,08 | 116 | -14,71 | ||||
| 2026-02-11 | 13F | Vestor Capital, Llc | 4.329 | -50,29 | 0 | |||||
| 2026-04-27 | 13F | Charter Capital Management, LLC\DE | 15.456 | 6,99 | 579 | -3,82 | ||||
| 2026-02-17 | 13F | Regal Investment Advisors LLC | 11.211 | 0,08 | 468 | 1,52 | ||||
| 2026-04-14 | 13F | FMA Wealth Management, LLC | 11.595 | -4,49 | 435 | -14,23 | ||||
| 2026-02-17 | 13F | Signature Equity Partners, LLC | 4.907 | 205 | ||||||
| 2026-04-24 | 13F | Key FInancial Inc | 23.835 | 0,00 | 894 | -10,07 | ||||
| 2026-04-21 | 13F | Merkkuri Wealth Advisors LLC | 4.470 | 168 | ||||||
| 2026-02-13 | 13F | Cozad Asset Management Inc | 6.942 | 289 | ||||||
| 2026-02-13 | 13F | Smartleaf Asset Management LLC | 0 | -100,00 | 0 | |||||
| 2026-02-18 | 13F | NFP Retirement, Inc. | 5.422 | 0,09 | 226 | 1,80 | ||||
| 2026-02-13 | 13F | B&D White Capital Company, LLC | 275.092 | 273,95 | 11.471 | 279,33 | ||||
| 2026-02-17 | 13F | Royal Bank Of Canada | 50.746 | 34,03 | 2.116 | 35,90 | ||||
| 2026-04-22 | 13F | Bay Capital Advisors, LLC | 19.360 | 1,32 | 726 | -8,92 | ||||
| 2026-01-29 | 13F | Sanctuary Advisors, LLC | 113.462 | 17,28 | 4.731 | 18,93 | ||||
| 2026-04-14 | 13F | Spectrum Investment Advisors, Inc. | 670.802 | 3,72 | 25.148 | -6,76 | ||||
| 2026-02-05 | 13F | Thrivent Financial For Lutherans | 633.346 | 2,71 | 27 | 4,00 | ||||
| 2026-04-16 | 13F | Security National Bank | 11.056 | 0,00 | 414 | -10,20 | ||||
| 2026-04-21 | 13F | McGlone Suttner Wealth Management, Inc. | 257.703 | 9.661 | ||||||
| 2026-02-17 | 13F | Creative Planning | 60.674 | 25,36 | 2.530 | 27,14 | ||||
| 2026-04-16 | 13F | Baron Wealth Management LLC | 41.908 | 9,57 | 1.571 | -1,44 | ||||
| 2026-01-21 | 13F | Flagship Harbor Advisors, Llc | 6.188 | 258 | ||||||
| 2026-04-15 | 13F | Independence Financial Advisors, LLC | 1.273.476 | -2,84 | 47.743 | -12,65 | ||||
| 2026-02-13 | 13F | Cornerstone Financial Management LLC | 247 | 10 | ||||||
| 2026-02-26 | 13F | 46 Peaks LLC | 234.488 | 9.778 | ||||||
| 2026-04-06 | 13F | InTrack Investment Management Inc | 41.008 | -6,87 | 1.537 | -16,29 | ||||
| 2026-02-12 | 13F | Commonwealth Equity Services, Llc | 4.141.753 | 33,18 | 172.711 | 135.892,91 | ||||
| 2026-04-14 | 13F | Nova Wealth Management, Inc. | 51.214 | -2,69 | 1.920 | -12,49 | ||||
| 2026-02-13 | 13F | Element Wealth, LLC | 19.052 | 33,70 | 794 | 35,73 | ||||
| 2026-02-12 | 13F | Empower Advisory Group, LLC | 20.167 | 151,11 | 841 | 154,55 | ||||
| 2026-02-18 | 13F | GWM Advisors LLC | 51.786 | 51,40 | 2.159 | 53,56 | ||||
| 2026-01-26 | 13F | Roman Butler Fullerton & Co | 7.090 | 0,08 | 290 | -5,25 | ||||
| 2026-01-12 | 13F | National Wealth Management Group, LLC | 9.062 | -5,13 | 378 | -3,83 | ||||
| 2026-02-12 | 13F | CIBC Private Wealth Group, LLC | 27 | 0,00 | 1 | 0,00 | ||||
| 2026-02-17 | 13F | Raymond James Financial Inc | 1.335.717 | 47,92 | 55.699 | 50,01 | ||||
| 2026-01-20 | 13F | Savvy Advisors, Inc. | 73.736 | 3.075 | ||||||
| 2026-01-27 | 13F | Cannon Wealth Management Services, LLC | 114.424 | 4.771 | ||||||
| 2025-11-10 | 13F | Thoroughbred Financial Services, Llc | 0 | -100,00 | 0 | |||||
| 2026-02-17 | 13F | Citadel Advisors Llc | 33.375 | 30,93 | 1.392 | 32,73 | ||||
| 2026-02-20 | 13F | Sunbelt Securities, Inc. | 40.505 | 154,59 | 1.689 | 158,26 | ||||
| 2026-04-20 | 13F | LVW Advisors, LLC | 0 | -100,00 | 0 | |||||
| 2026-04-22 | 13F | Formidable Asset Management, LLC | 13.222 | 551 | ||||||
| 2026-01-30 | 13F | Rogco, Lp | 1.521 | 0,00 | 63 | 1,61 | ||||
| 2026-02-17 | 13F | Mercer Global Advisors Inc /adv | 5.460 | 1,02 | 228 | 2,25 | ||||
| 2026-01-23 | 13F | Ball & Co Wealth Management Inc. | 28.580 | 0,28 | 1 | 0,00 | ||||
| 2026-04-22 | 13F | Clear Creek Financial Management, LLC | 11.390 | 0,00 | 427 | -9,92 | ||||
| 2026-01-26 | 13F | AE Wealth Management LLC | 2.455 | -46,54 | 102 | -45,74 | ||||
| 2026-02-18 | 13F | EP Wealth Advisors, Inc. | 5.816 | -4,44 | 243 | 7,56 | ||||
| 2025-11-06 | 13F | Abich Financial Wealth Management LLC | 300 | 0,00 | 12 | 33,33 | ||||
| 2026-02-13 | 13F | SRS Capital Advisors, Inc. | 7.338 | 306 | ||||||
| 2026-02-17 | 13F | Snowden Capital Advisors LLC | 0 | -100,00 | 0 | |||||
| 2026-02-18 | 13F | Garton & Associates Financial Advisors LLC | 365 | 15 | ||||||
| 2026-04-24 | 13F | Private Advisor Group, LLC | 221.019 | 23,43 | 8.286 | 10,97 | ||||
| 2026-01-26 | 13F | Greenwood Capital Associates Llc | 95.010 | 44,81 | 3.962 | 46,87 | ||||
| 2026-01-29 | 13F | Calamos Wealth Management LLC | 6.600 | 0,00 | 275 | 1,48 | ||||
| 2026-02-17 | 13F | Fmr Llc | 476.256 | 0,98 | 19.860 | 2,40 | ||||
| 2026-01-28 | 13F | Investmark Advisory Group LLC | 80.037 | 18,17 | 3.338 | 19,82 | ||||
| 2026-04-10 | 13F | Financial Partners Group, Inc | 20.222 | -2,83 | 758 | -11,03 | ||||
| 2025-11-14 | 13F | Truvestments Capital Llc | 0 | -100,00 | 0 | |||||
| 2026-04-22 | 13F | Rolek Wealth Management LLC | 34.766 | -1,90 | 1.303 | -11,78 | ||||
| 2026-02-10 | 13F | Redwood Financial Network Corp | 25.809 | 3,23 | 1.076 | 4,67 | ||||
| 2026-04-07 | 13F | Farther Finance Advisors, LLC | 128.140 | 18,98 | 4.854 | 8,08 | ||||
| 2026-02-13 | 13F | MAI Capital Management | 1.904 | 5,66 | 79 | 6,76 | ||||
| 2026-02-10 | 13F | Godfrey Financial Associates, Inc. | 17.753 | 740 | ||||||
| 2026-02-10 | 13F | Bnp Paribas Arbitrage, Sa | 6 | 0 | ||||||
| 2026-02-13 | 13F | Heritage Wealth Advisors | 552 | 0,00 | 23 | 4,55 | ||||
| 2026-04-27 | 13F | Truist Financial Corp | 87.962 | -49,40 | 3.298 | -54,51 | ||||
| 2025-11-14 | 13F | D. E. Shaw & Co., Inc. | 0 | -100,00 | 0 | |||||
| 2026-04-22 | 13F | Traphagen Investment Advisors Llc | 17.010 | -6,64 | 638 | -16,07 | ||||
| 2026-02-09 | 13F | Kuhn & Co Investment Counsel | 17.847 | 16,10 | 744 | 17,72 | ||||
| 2026-01-12 | 13F | Castleview Partners, Llc | 58.251 | -9,63 | 2.429 | -8,34 | ||||
| 2026-04-10 | 13F | Pure Financial Advisors, Inc. | 22.591 | 847 | ||||||
| 2026-02-13 | 13F | Stifel Financial Corp | 22.791 | 33,88 | 950 | 35,91 | ||||
| 2026-02-06 | 13F | Larson Financial Group LLC | 687 | 12,44 | 29 | 12,00 | ||||
| 2026-02-11 | 13F | SlateStone Wealth, LLC | 5.574 | 0,11 | 0 | |||||
| 2026-02-17 | 13F | Susquehanna International Group, Llp | 13.977 | -78,74 | 583 | -78,47 | ||||
| 2026-04-14 | 13F | Focus Financial Network, Inc. | 7.253 | 272 | ||||||
| 2026-04-27 | 13F | Soltis Investment Advisors LLC | 28.528 | 1.070 | ||||||
| 2026-02-05 | 13F | Cambridge Investment Research Advisors, Inc. | 461.246 | -24,38 | 19 | -24,00 | ||||
| 2026-04-23 | 13F | Summit Wealth Group Llc / Co | 25.090 | 0,01 | 941 | -10,13 | ||||
| 2026-02-10 | 13F | IFG Advisory, LLC | 22.403 | 934 | ||||||
| 2026-02-05 | 13F | Atria Investments Llc | 78.719 | -2,18 | 3.283 | -0,82 | ||||
| 2026-02-17 | 13F | Equitable Holdings, Inc. | 1.029.490 | 7,59 | 42.930 | 9,10 | ||||
| 2026-04-06 | 13F | Washington Trust Advisors, Inc. | 410 | 0,00 | 15 | -11,76 | ||||
| 2026-02-05 | 13F | Allworth Financial LP | 3.034 | -12,36 | 127 | -11,27 | ||||
| 2026-02-11 | 13F | LPL Financial LLC | 2.767.311 | 45,43 | 115.397 | 47,49 | ||||
| 2026-04-22 | 13F | Janney Montgomery Scott LLC | 12.459 | 0,01 | 0 | |||||
| 2026-02-06 | 13F | Global Retirement Partners, LLC | 39.572 | 74,73 | 1.650 | 77,23 | ||||
| 2026-02-17 | 13F | LaSalle St. Investment Advisors, LLC | 21.495 | 3,70 | 1 | |||||
| 2026-01-29 | 13F | Prepared Retirement Institute LLC | 374.809 | 1,68 | 15.630 | 3,11 | ||||
| 2026-02-17 | 13F | Bank Of America Corp /de/ | 64.061 | -27,41 | 2.671 | -26,38 | ||||
| 2026-02-11 | 13F | J.w. Cole Advisors, Inc. | 0 | -100,00 | 0 | |||||
| 2026-01-26 | 13F | Pennsylvania Capital Management Inc /adv | 12.657 | 0,00 | 528 | 1,35 | ||||
| 2026-04-15 | 13F | Trust Point Inc. | 8.764 | 329 | ||||||
| 2026-02-09 | 13F | Kestra Investment Management, LLC | 0 | -100,00 | 0 | |||||
| 2026-02-12 | 13F | Bradley Foster & Sargent Inc/ct | 6.111 | 255 | ||||||
| 2026-02-13 | 13F | Kestra Advisory Services, LLC | 0 | -100,00 | 0 | |||||
| 2026-02-17 | 13F | Cetera Investment Advisers | 574.516 | 3,81 | 23.957 | 5,28 | ||||
| 2026-04-20 | 13F | Pathfinder Wealth Consulting, Inc. | 117.407 | 16,29 | 4.402 | 4,56 | ||||
| 2026-02-11 | 13F | Gwn Securities Inc. | 10.446 | 0,08 | 436 | 1,40 | ||||
| 2026-02-13 | 13F | Morgan Stanley | 16.969 | 6,34 | 708 | 7,77 | ||||
| 2026-02-11 | 13F | Capital Analysts, Inc. | 5.159 | 38,61 | 0 | |||||
| 2026-04-14 | 13F | Beacon Investment Advisory Services, Inc. | 10.021 | 0,00 | 376 | -10,07 | ||||
| 2026-04-17 | 13F | Halbert Hargrove Global Advisors, Llc | 253 | 0,00 | 9 | -10,00 | ||||
| 2025-11-13 | 13F | RMB Capital Management, LLC | 0 | -100,00 | 0 | |||||
| 2026-01-26 | 13F | Cwm, Llc | 243.039 | 8.623,58 | 10 | |||||
| 2026-04-08 | 13F | Warner Financial, Inc | 8.511 | 26,99 | 319 | |||||
| 2026-04-17 | 13F | CENTRAL TRUST Co | 440 | 0,00 | 16 | -11,11 | ||||
| 2026-02-13 | 13F | Colony Group, LLC | 29.485 | 1.230 | ||||||
| 2026-04-22 | 13F | Goodman Advisory Group, LLC | 656 | -94,12 | 25 | -94,84 | ||||
| 2026-01-28 | 13F | HB Wealth Management, LLC | 5.231 | 0,00 | 218 | 1,40 | ||||
| 2026-04-22 | 13F | Pasadena Private Wealth, LLC | 5.645 | -46,25 | 212 | -51,72 | ||||
| 2026-04-14 | 13F | Madrona Financial Services, LLC | 11.706 | 0,00 | 439 | -10,25 | ||||
| 2026-02-17 | 13F | Opus Financial Solutions LLC | 6.738 | 281 | ||||||
| 2026-04-15 | 13F | Apex Wealth Management, LLC | 0 | -100,00 | 0 | |||||
| 2026-02-17 | 13F | SageView Advisory Group, LLC | 101 | 4 | ||||||
| 2026-02-10 | 13F/A | Northwestern Mutual Wealth Management Co | 679.467 | 12,45 | 28.334 | 14,04 | ||||
| 2026-01-27 | 13F | Vantagepoint Investment Advisers Llc | 8.634.000 | 4,90 | 360.038 | 6,37 | ||||
| 2026-02-10 | 13F | Lido Advisors, LLC | 73.497 | 0,68 | 3.023 | 0,70 | ||||
| 2026-02-13 | 13F | Integrated Wealth Concepts LLC | 160.079 | 3,61 | 6.675 | 5,07 | ||||
| 2026-01-12 | 13F | Traynor Capital Management, Inc. | 4.968 | -1,08 | 207 | 0,49 | ||||
| 2026-02-11 | 13F | Jpmorgan Chase & Co | 504.152 | 0,90 | 21.023 | 2,33 | ||||
| 2026-02-06 | 13F | HighTower Advisors, LLC | 24.597 | -0,86 | 1.026 | 0,49 | ||||
| 2026-02-13 | 13F | Mariner, LLC | 30.432 | 32,40 | 1.269 | 34,29 | ||||
| 2026-02-13 | 13F | Golden State Wealth Management, LLC | 4.079 | 0,00 | 170 | 1,80 | ||||
| 2026-03-04 | 13F | SHP Wealth Management | 14.575 | 608 | ||||||
| 2026-04-10 | 13F | Integrated Financial Solutions, Inc. | 0 | -100,00 | 0 | |||||
| 2026-04-20 | 13F | Sowell Financial Services LLC | 7.677 | -7,47 | 288 | -16,81 | ||||
| 2026-02-11 | 13F | Flagship Wealth Advisors, Llc | 153.304 | 10,44 | 6.393 | 12,00 | ||||
| 2026-02-12 | 13F | Bank Of Montreal /can/ | 300 | -76,80 | 13 | -77,36 | ||||
| 2026-01-30 | 13F | Richardson Capital Management LLC | 5.777 | 0,00 | 241 | 1,27 | ||||
| 2026-02-10 | 13F | Envestnet Asset Management Inc | 6.141.344 | 0,02 | 256.094 | 1,43 | ||||
| 2026-02-06 | 13F | EverSource Wealth Advisors, LLC | 9.387 | 0,71 | 391 | 2,09 | ||||
| 2026-02-17 | 13F | Captrust Financial Advisors | 17.624 | -2,74 | 735 | -1,48 | ||||
| 2026-02-13 | 13F | B & T Capital Management DBA Alpha Capital Management | 5.004 | 0,00 | 209 | 1,46 | ||||
| 2026-01-29 | 13F | UBS Group AG | 7.123 | 9,40 | 297 | 11,24 | ||||
| 2026-04-23 | 13F | Foronjy Financial Llc | 7.582 | 0,18 | 284 | -9,84 | ||||
| 2026-02-26 | 13F | Anchor Investment Management, LLC | 1.451 | 61 | ||||||
| 2025-11-12 | 13F | Fisher Asset Management, LLC | 0 | -100,00 | 0 | |||||
| 2026-02-09 | 13F | Hartland & Co., LLC | 1 | 0,00 | 0 | |||||
| 2026-04-16 | 13F | Sentinel Pension Advisors Inc | 456.159 | 6,78 | 17.101 | -4,00 | ||||
| 2026-04-16 | 13F | Hicks Capital Management Llc | 19.271 | 722 | ||||||
| 2026-02-03 | 13F | Geneva Partners, LLC | 19.366 | 1,04 | 808 | 2,41 | ||||
| 2025-11-12 | 13F | Creekmur Asset Management LLC | 20.848 | -1,06 | 857 | 9,87 | ||||
| 2026-04-20 | 13F | Kestra Private Wealth Services, Llc | 12.827 | 0,06 | 481 | -10,11 | ||||
| 2026-04-15 | 13F | Merit Financial Group, LLC | 129.480 | 198,38 | 4.854 | 168,33 | ||||
| 2026-02-14 | 13F | POM Investment Strategies, LLC | 928 | 39 | ||||||
| 2026-01-29 | 13F | Comerica Bank | 856 | 0,00 | 36 | 0,00 | ||||
| 2025-11-03 | 13F | Cahill Financial Advisors Inc | 0 | -100,00 | 0 | |||||
| 2026-02-17 | 13F | Advisory Services Network, LLC | 11.687 | 18,11 | 487 | 19,95 | ||||
| 2026-02-06 | 13F | First Business Financial Services, Inc. | 5.700 | 0,00 | 238 | 1,28 | ||||
| 2026-02-04 | 13F | Ameritas Advisory Services, LLC | 0 | -100,00 | 0 | |||||
| 2026-01-20 | 13F | Fundamentun, Llc | 15.150 | 10,91 | 632 | 12,48 | ||||
| 2026-02-17 | 13F | Russell Investments Group, Ltd. | 1.082 | 0,00 | 45 | 2,27 | ||||
| 2026-02-13 | 13F | Wells Fargo & Company/mn | 199.611 | 43,58 | 8.324 | 45,61 | ||||
| 2026-02-17 | 13F | Hilltop Holdings Inc. | 38.873 | -2,47 | 1.621 | -1,04 | ||||
| 2026-02-12 | 13F | Wood Tarver Financial Group, LLC | 5.707 | 0,00 | 0 | |||||
| 2026-02-13 | 13F | Mml Investors Services, Llc | 6.343.591 | 4,72 | 264.528 | 6,19 | ||||
| 2026-01-26 | 13F | Private Trust Co Na | 2.029 | 41,39 | 85 | 42,37 | ||||
| 2026-02-17 | 13F | Coastal Bridge Advisors, LLC | 10.812 | 0,09 | 451 | 1,35 | ||||
| 2026-04-10 | 13F | Abound Wealth Management | 1.092 | -74,80 | 41 | -77,78 | ||||
| 2026-04-08 | 13F | Wealth Enhancement Advisory Services, Llc | 15.082 | -39,34 | 570 | -45,14 | ||||
| 2026-02-19 | 13F | CI Private Wealth, LLC | 5.796 | -5,15 | 242 | -3,98 | ||||
| 2026-02-04 | 13F | Bensler, LLC | 7.978 | 0,05 | 333 | 1,53 | ||||
| 2026-02-12 | 13F | Menora Mivtachim Holdings Ltd. | 222.602 | 9,32 | 9.283 | 10,86 | ||||
| 2026-02-17 | 13F | Pacific Financial Group Inc | 6.055 | 0,10 | 252 | 1,61 | ||||
| 2026-04-13 | 13F | IFP Advisors, Inc | 1.861 | -60,00 | 70 | -64,25 | ||||
| 2026-04-14 | 13F | Act Wealth Management, Llc | 10.695 | 0,08 | 401 | -10,11 | ||||
| 2026-04-23 | 13F | Mayflower Financial Advisors, LLC | 6.499 | 244 | ||||||
| 2026-02-06 | 13F | New Millennium Group LLC | 0 | 0 | ||||||
| 2026-02-02 | 13F | Holistic Planning, LLC | 6.029 | 251 | ||||||
| 2026-04-16 | 13F | Triad Wealth Partners, LLC | 20.742 | 778 | ||||||
| 2026-02-06 | 13F | Cullen/frost Bankers, Inc. | 6.572 | 23,70 | 274 | 25,69 | ||||
| 2026-04-17 | 13F | AdvisorNet Financial, Inc | 1.621 | 0,00 | 61 | -10,45 | ||||
| 2026-02-17 | 13F | Ancora Advisors, LLC | 500 | 21 | ||||||
| 2025-11-14 | 13F | Hrt Financial Lp | 0 | -100,00 | 0 | |||||
| 2026-01-30 | 13F | Sigma Planning Corp | 10.602 | -6,91 | 442 | -5,56 | ||||
| 2026-02-02 | 13F | Fifth Third Bancorp | 70 | -69,70 | 3 | -77,78 | ||||
| 2026-04-14 | 13F | Wealthcare Advisory Partners LLC | 7.499 | 0,00 | 281 | -9,94 | ||||
| 2026-01-22 | 13F | Bartlett & Co. Wealth Management Llc | 15 | 1 | ||||||
| 2025-11-13 | 13F | Marshall Wace, Llp | 0 | -100,00 | 0 | |||||
| 2026-02-06 | 13F | Northwest Wealth Advisors, LLC | 168.015 | 7.006 | ||||||
| 2026-04-21 | 13F | Sugar Maple Asset Management, LLC | 37.776 | 1.416 | ||||||
| 2026-02-13 | 13F | Aptus Capital Advisors, LLC | 1.588 | 4,89 | 66 | 6,45 | ||||
| 2026-02-02 | 13F | Qrg Capital Management, Inc. | 5.123 | 214 | ||||||
| 2026-02-09 | 13F | Harbour Investments, Inc. | 38.905 | 13,76 | 1.622 | 15,36 | ||||
| 2026-02-03 | 13F | Costello Asset Management, INC | 1.025 | 51,85 | 43 | 55,56 | ||||
| 2026-02-04 | 13F | Atlantic Union Bankshares Corp | 3.051 | 0,00 | 127 | 1,60 | ||||
| 2026-02-10 | 13F | IAG Wealth Partners, LLC | 663 | 2.267,86 | 28 | 2.600,00 | ||||
| 2026-04-08 | 13F | Infinity Wealth Counsel, LLC | 27.375 | 1,11 | 1.026 | -9,12 | ||||
| 2026-02-13 | 13F | Advyzon Investment Management, LLC | 11.552 | 3,23 | 482 | 4,57 | ||||
| 2026-04-14 | 13F | Portfolio Resources Advisor Group, Inc. | 2.929 | 110 | ||||||
| 2026-01-23 | 13F | Transcend Wealth Collective, Llc | 7.645 | 0,01 | 319 | 1,27 | ||||
| 2026-04-15 | 13F | Nations Financial Group Inc, /ia/ /adv | 12.415 | 7,32 | 465 | -3,53 | ||||
| 2026-02-10 | 13F | Moors & Cabot, Inc. | 6.382 | 29,06 | 266 | 31,03 | ||||
| 2026-02-12 | 13F | Grey Fox Wealth Advisors, LLC | 0 | -100,00 | 0 | |||||
| 2026-01-26 | 13F | Valmark Advisers, Inc. | 211.123 | 49,75 | 8.804 | 51,85 | ||||
| 2026-02-17 | 13F | Qube Research & Technologies Ltd | 207 | -77,86 | 9 | -78,95 | ||||
| 2026-04-15 | 13F | Dedeker Financial LLC | 0 | -100,00 | 0 | |||||
| 2026-04-21 | 13F | Wedbush Securities Inc | 15.554 | -2,89 | 1 | |||||
| 2026-01-21 | 13F | Raleigh Capital Management Inc. | 208 | 9 | ||||||
| 2026-01-28 | 13F | Schmidt P J Investment Management Inc | 4.824 | 201 | ||||||
| 2026-01-29 | 13F | Advisors Capital Management, LLC | 311.137 | 25,63 | 12.974 | 27,40 | ||||
| 2026-02-11 | 13F | Hughes Financial Services, LLC | 0 | -100,00 | 0 | |||||
| 2026-04-13 | 13F | Perennial Advisors, LLC | 12.675 | 0,00 | 475 | -10,04 | ||||
| 2026-02-17 | 13F | Advisor Group Holdings, Inc. | 700.228 | 5,09 | 29.213 | 8,81 | ||||
| 2026-02-10 | 13F | Goldman Sachs Group Inc | 0 | -100,00 | 0 | |||||
| 2026-04-13 | 13F | Creative Financial Designs Inc /adv | 6.768 | 75,52 | 254 | 58,13 | ||||
| 2026-04-14 | 13F | Thurston, Springer, Miller, Herd & Titak, Inc. | 1.385 | 52 | ||||||
| 2026-04-24 | 13F | National Asset Management, Inc. | 168.708 | 6.087 | ||||||
| 2026-02-04 | 13F | Rollins Financial Advisors, LLC | 53.229 | -1,27 | 2.220 | 0,14 | ||||
| 2026-04-15 | 13F | Silverlake Wealth Management Llc | 95.259 | 0,66 | 3.571 | -9,50 | ||||
| 2026-02-11 | 13F | Simplex Trading, Llc | 292 | -2,67 | 12 | |||||
| 2026-02-12 | 13F | Principal Securities, Inc. | 238.138 | 8,16 | 9.930 | 9,69 | ||||
| 2026-04-13 | 13F | Elm3 Financial Group, LLC | 20.830 | 0,58 | 781 | -9,62 | ||||
| 2026-01-20 | 13F | Sovran Advisors, LLC | 40.019 | 7,71 | 1.650 | 4,70 | ||||
| 2026-02-13 | 13F | Arkadios Wealth Advisors | 7.931 | 331 | ||||||
| 2026-01-28 | 13F | Geneos Wealth Management Inc. | 250 | 0,00 | 10 | 0,00 | ||||
| 2026-02-02 | 13F | Cornerstone Planning Group LLC | 1.082 | 0,00 | 45 | -2,22 | ||||
| 2026-04-15 | 13F | Sage Capital Management, LLC | 8.272 | 0,07 | 310 | -9,88 | ||||
| 2026-01-06 | 13F | Investors Research Corp | 0 | -100,00 | 0 | -100,00 | ||||
| 2025-11-14 | 13F | Tower Research Capital LLC (TRC) | 0 | -100,00 | 0 | |||||
| 2025-11-04 | 13F | Guerra Advisors Inc | 1 | 0 |