Grundlæggende statistik
| Institutionelle aktier (lange) | 45.002.646 - 92,57% (ex 13D/G) - change of -15,21MM shares -25,26% MRQ |
| Institutionel værdi (lang) | $ 3.066.661 USD ($1000) |
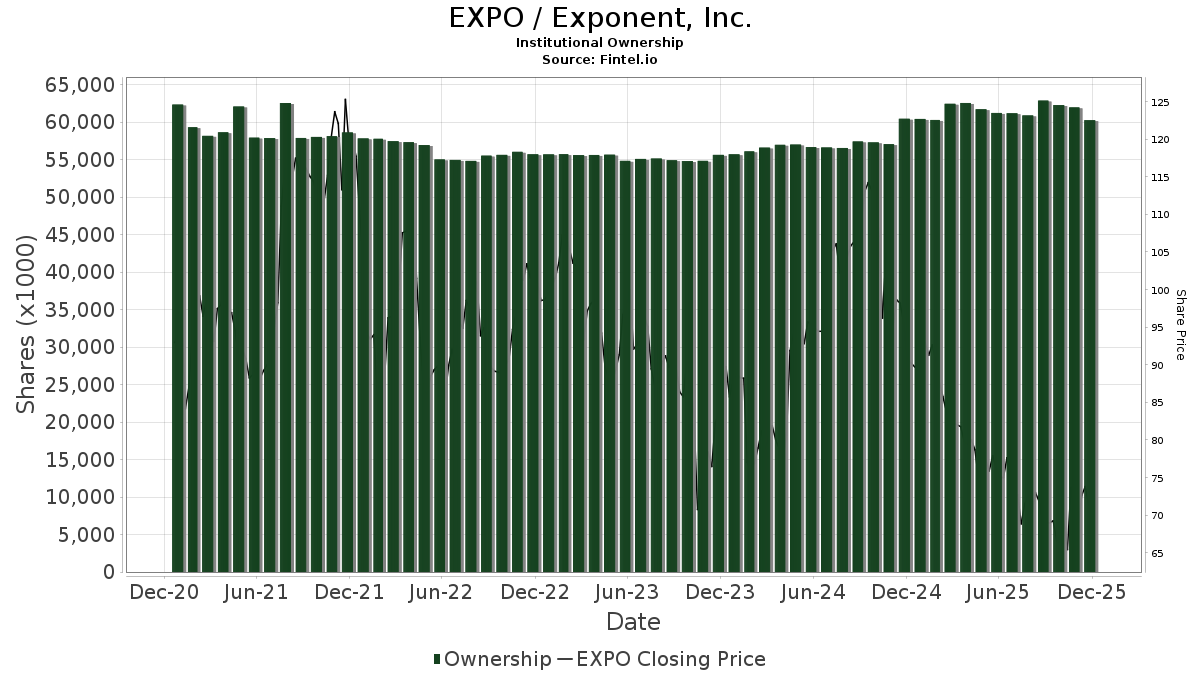
Institutionelt ejerskab og aktionærer
Exponent, Inc. (US:EXPO) har 360 institutionelle ejere og aktionærer, der har indsendt 13D/G- eller 13F-formularer til Securities Exchange Commission (SEC). Disse institutioner har i alt 45,002,646 aktier. Største aktionærer omfatter BlackRock, Inc., Vanguard Group Inc, Kayne Anderson Rudnick Investment Management Llc, Conestoga Capital Advisors, LLC, State Street Corp, Geode Capital Management, Llc, Neuberger Berman Group LLC, Morgan Stanley, Dimensional Fund Advisors Lp, and First Trust Advisors Lp .
Exponent, Inc. (NasdaqGS:EXPO) institutionel ejerskabsstruktur viser aktuelle positioner i virksomheden efter institutioner og fonde, samt seneste ændringer i positionsstørrelse. Større aktionærer kan omfatte individuelle investorer, investeringsforeninger, hedgefonde eller institutioner. Skema 13D angiver, at investoren besidder (eller besidder) mere end 5 % af virksomheden og har til hensigt (eller har til hensigt at) aktivt at forfølge en ændring i forretningsstrategi. Skema 13G indikerer en passiv investering på over 5%.
The share price as of April 24, 2026 is 65,88 / share. Previously, on April 28, 2025, the share price was 78,20 / share. This represents a decline of 15,75% over that period.
Fondens stemningsscore
Fund Sentiment Score (fka Ownership Accumulation Score) finder de aktier, der bliver mest købt af fonde. Det er resultatet af en sofistikeret, multi-faktor kvantitativ model, der identificerer virksomheder med de højeste niveauer af institutionel akkumulering. Scoringsmodellen bruger en kombination af den samlede stigning i oplyste ejere, ændringerne i porteføljeallokeringer i disse ejere og andre målinger. Tallet går fra 0 til 100, hvor højere tal indikerer et højere niveau af akkumulering for sine jævnaldrende, og 50 er gennemsnittet.
Opdateringsfrekvens: Dagligt
Se Ownership Explorer, som giver en liste over højest rangerende virksomheder.
AI+ Ask Fintel’s AI assistant about Exponent, Inc..
Select a question to share a public post with an AI-crafted answer.
Thinking of good questions…
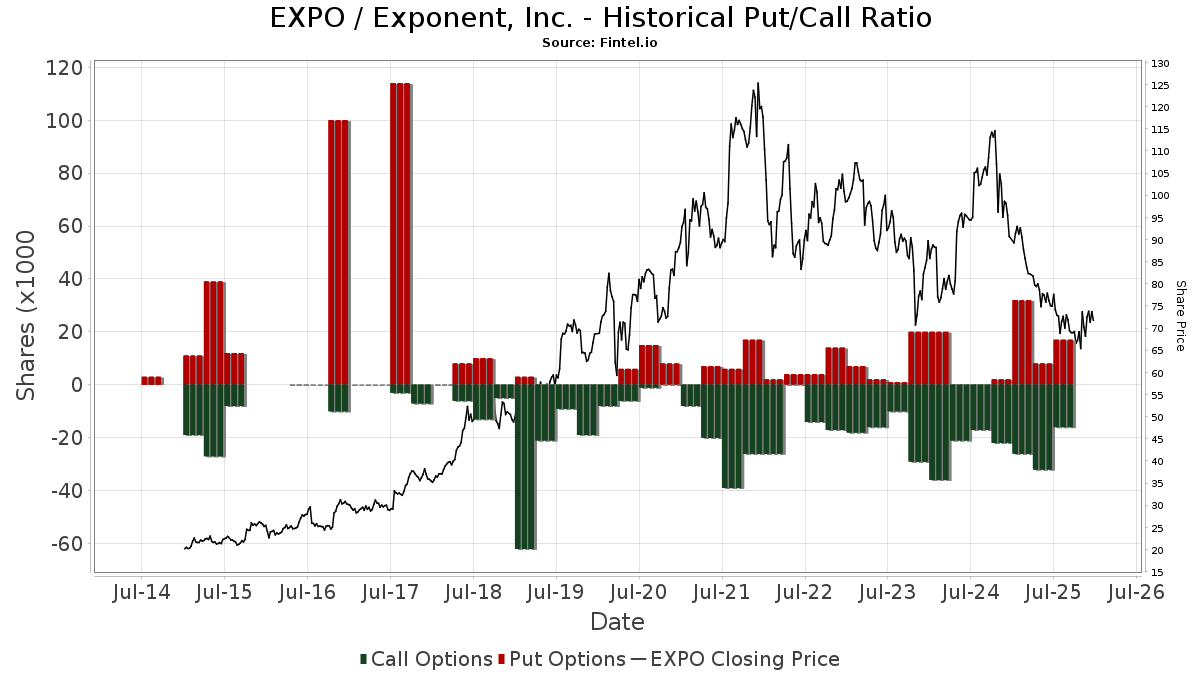
Institutionel Put/Call-forhold
Ud over at indberette standardaktie- og gældsudstedelser skal institutter med mere end 100 mill. aktiver under forvaltning også oplyse deres put- og call-optionsbeholdninger. Da salgsoptioner generelt indikerer negativ stemning, og købsoptioner indikerer positiv stemning, kan vi få en fornemmelse af den overordnede institutionelle stemning ved at plotte forholdet mellem put og kald. Diagrammet til højre viser det historiske put/call-forhold for dette instrument.
Brug af Put/Call Ratio som en indikator for investorernes stemning overvinder en af de vigtigste mangler ved at bruge totalt institutionelt ejerskab, som er, at en betydelig mængde af aktiver under forvaltning investeres passivt for at spore indekser. Passivt forvaltede fonde køber typisk ikke optioner, så indikatoren for put/call-forholdet følger mere nøje følelsen af aktivt forvaltede fonde.
13D/G-arkivering
Vi præsenterer 13D/G ansøgninger separat fra 13F ansøgninger på grund af den forskellige behandling af SEC. 13D/G-ansøgninger kan indgives af grupper af investorer (med én ledende), hvorimod 13F-ansøgninger ikke kan. Dette resulterer i situationer, hvor en investor kan indsende en 13D/G, der rapporterer én værdi for de samlede aktier (der repræsenterer alle de aktier, der ejes af investorgruppen), men derefter indsender en 13F, der rapporterer en anden værdi for de samlede aktier (der udelukkende repræsenterer deres egne) ejendomsret). Det betyder, at aktieejerskab af 13D/G-arkiver og 13F-arkiveringer ofte ikke er direkte sammenlignelige, så vi præsenterer dem separat.
Bemærk: Fra den 16. maj 2021 viser vi ikke længere ejere, der ikke har indsendt en 13D/G inden for det seneste år. Tidligere viste vi den fulde historie af 13D/G-arkiver. Generelt skal enheder, der er forpligtet til at indgive 13D/G-ansøgninger, indgive mindst årligt, før de indsender en afsluttende ansøgning. Dog forlader fonde nogle gange positioner uden at indsende en afsluttende ansøgning (dvs. de afvikler), så visning af den fulde historie resulterede nogle gange i forvirring om det nuværende ejerskab. For at undgå forvirring viser vi nu kun 'aktuelle' ejere - det vil sige - ejere, der har anmeldt inden for det seneste år.
Upgrade to unlock premium data.
| Fil dato | Form | Investor | Forrige Aktier |
Seneste Aktier |
Δ Aktier (Procent) |
Ejendomsret (Procent) |
Δ Ejerskab (Procent) |
|
|---|---|---|---|---|---|---|---|---|
| 2026-03-26 | VANGUARD GROUP INC | 5,286,652 | 0 | -100.00 | 0.00 | -100.00 | ||
| 2026-01-09 | Conestoga Capital Advisors, LLC | 2,978,505 | 2,526,244 | -15.18 | 5.06 | -13.80 |
13F og NPORT arkivering
Detaljer om 13F-arkivering er gratis. Detaljer om NP-ansøgninger kræver et premium-medlemskab. Grønne rækker angiver nye positioner. Røde rækker angiver lukkede positioner. Klik på linket ikon for at se den fulde transaktionshistorik.
Opgrader
for at låse premium-data op og eksportere til Excel ![]() .
.
| Fil dato | Kilde | Investor | Type | Gennemsnitlig pris (Øst) |
Aktier | Δ Aktier (%) |
Rapporteret Værdi ($1000) |
Δ Værdi (%) |
Port Alloc (%) |
|
|---|---|---|---|---|---|---|---|---|---|---|
| 2025-11-12 | 13F | NewSquare Capital LLC | 0 | -100,00 | 0 | |||||
| 2025-11-12 | 13F | Empirical Asset Management, LLC | 0 | -100,00 | 0 | |||||
| 2026-04-02 | 13F | Hilltop National Bank | 2.849 | 20,06 | 186 | 12,80 | ||||
| 2026-04-14 | 13F | West Branch Capital LLC | 0 | -100,00 | 0 | |||||
| 2026-02-18 | 13F | Mackenzie Financial Corp | 3.174 | 0,00 | 223 | 0,91 | ||||
| 2025-11-21 | 13F | Nebula Research & Development LLC | 0 | -100,00 | 0 | -100,00 | ||||
| 2026-02-13 | 13F | Squarepoint Ops LLC | 6.894 | -54,56 | 479 | -54,65 | ||||
| 2026-02-17 | 13F | Silvercrest Asset Management Group Llc | 0 | -100,00 | 0 | |||||
| 2026-04-15 | 13F | Activest Wealth Management | 33 | 2 | ||||||
| 2026-04-23 | 13F | SJS Investment Consulting Inc. | 17 | 466,67 | 1 | |||||
| 2026-02-13 | 13F | Neuberger Berman Group LLC | 1.478.536 | -5,42 | 102.699 | -5,44 | ||||
| 2026-01-30 | 13F | Us Bancorp \de\ | 5.752 | -19,62 | 400 | -19,72 | ||||
| 2025-10-31 | 13F | Whittier Trust Co | 0 | -100,00 | 0 | |||||
| 2026-02-17 | 13F | Redwood Park Advisors LLC | 2.263 | 0,09 | 157 | 0,00 | ||||
| 2026-02-17 | 13F | Tudor Investment Corp Et Al | Put | 15.000 | 1.042 | |||||
| 2026-02-13 | 13F | State Street Corp | 1.855.626 | -0,10 | 128.892 | -0,13 | ||||
| 2026-02-17 | 13F | Tudor Investment Corp Et Al | Call | 100.000 | 6.946 | |||||
| 2026-02-13 | 13F | Walleye Capital LLC | Call | 0 | -100,00 | 0 | ||||
| 2026-02-13 | 13F | Verition Fund Management LLC | 4.091 | -90,72 | 284 | -90,73 | ||||
| 2026-02-10 | 13F | Hazlett, Burt & Watson, Inc. | 63 | 0,00 | 0 | |||||
| 2026-02-13 | 13F | Aigen Investment Management, Lp | 0 | -100,00 | 0 | |||||
| 2026-01-07 | 13F | Retirement Wealth Solutions LLC | 0 | -100,00 | 0 | |||||
| 2026-01-23 | 13F | Avion Wealth | 42 | -25,00 | 0 | |||||
| 2026-02-09 | 13F | Malaga Cove Capital, LLC | 5.484 | -2,49 | 381 | -2,56 | ||||
| 2025-11-14 | 13F | Texas Permanent School Fund | 0 | -100,00 | 0 | -100,00 | ||||
| 2026-02-04 | 13F | Marco Investment Management Llc | 3.075 | 0,00 | 214 | 0,00 | ||||
| 2026-02-10 | 13F | Rothschild Investment Llc | 352 | 467,74 | 24 | 500,00 | ||||
| 2026-02-17 | 13F | Price T Rowe Associates Inc /md/ | 47.525 | 10,59 | 3 | 50,00 | ||||
| 2026-02-13 | 13F | Entropy Technologies, LP | 4.326 | 2,17 | 300 | 2,04 | ||||
| 2026-01-15 | 13F | StonePine Asset Management Inc. | 139.494 | 6,25 | 9.689 | 6,22 | ||||
| 2026-02-13 | 13F | Brown Advisory Inc | 5.130 | -0,12 | 356 | 0,00 | ||||
| 2026-02-17 | 13F | Occudo Quantitative Strategies Lp | 0 | -100,00 | 0 | |||||
| 2026-02-17 | 13F | Creative Planning | 86.123 | 94,18 | 5.982 | 94,16 | ||||
| 2026-02-12 | 13F | Ensign Peak Advisors, Inc | 3.834 | -64,77 | 266 | -64,81 | ||||
| 2026-01-30 | 13F | Bogart Wealth, LLC | 21 | 1 | ||||||
| 2026-02-12 | 13F | New York State Common Retirement Fund | 51.426 | 88,26 | 3.572 | 88,30 | ||||
| 2026-02-23 | 13F | Virtu Financial LLC | 8.665 | 1 | ||||||
| 2026-02-03 | 13F | Mitsubishi UFJ Kokusai Asset Management Co., Ltd. | 67 | 0,00 | 5 | 0,00 | ||||
| 2026-02-11 | 13F | Winton Capital Group Ltd | 5.196 | 361 | ||||||
| 2026-02-17 | 13F | Magnetar Financial LLC | 3.749 | 260 | ||||||
| 2026-02-17 | 13F | Signature Equity Partners, LLC | 10 | 1 | ||||||
| 2026-02-09 | 13F | CBIZ Investment Advisory Services, LLC | 65 | 5 | ||||||
| 2026-02-17 | 13F | Nearwater Capital Markets, Ltd | 95.300 | 0,00 | 6.620 | -0,03 | ||||
| 2026-02-17 | 13F | Advisory Services Network, LLC | 0 | -100,00 | 0 | |||||
| 2026-02-13 | 13F | Financial Network Wealth Advisors LLC | 40 | 0,00 | 3 | 0,00 | ||||
| 2026-02-10 | 13F | Norges Bank | 736.619 | 51.166 | ||||||
| 2026-01-28 | 13F | Laurus Investment Counsel Inc. | 0 | -100,00 | 0 | |||||
| 2026-02-05 | 13F | Amalgamated Bank | 21.037 | -5,11 | 1 | 0,00 | ||||
| 2026-04-17 | 13F | Baker Ellis Asset Management LLC | 5.160 | 0,00 | 337 | -6,15 | ||||
| 2026-04-17 | 13F | Vermillion Wealth Management, Inc. | 4 | 0 | ||||||
| 2026-04-21 | 13F | Capital Investment Counsel, Inc | 3.725 | 0,00 | 243 | -5,81 | ||||
| 2026-02-17 | 13F | Man Group plc | 119.125 | -18,33 | 8.274 | -18,35 | ||||
| 2026-02-04 | 13F | LRI Investments, LLC | 702 | 0,00 | 49 | 0,00 | ||||
| 2026-01-23 | 13F | Assetmark, Inc | 96 | 772,73 | 7 | |||||
| 2025-11-12 | 13F | Advisor OS, LLC | 0 | -100,00 | 0 | |||||
| 2026-01-30 | 13F | New York State Teachers Retirement System | 39.972 | -4,45 | 3 | 0,00 | ||||
| 2026-02-12 | 13F | Steward Partners Investment Advisory, Llc | 695 | -22,43 | 48 | -22,58 | ||||
| 2026-02-17 | 13F | Glenmede Trust Co Na | 10.343 | -13,08 | 718 | -25,52 | ||||
| 2026-02-13 | 13F | Arkadios Wealth Advisors | 23.223 | -0,40 | 1.613 | -0,43 | ||||
| 2026-02-17 | 13F | Aqr Capital Management Llc | 547.737 | 115,08 | 38.046 | 115,17 | ||||
| 2026-04-23 | 13F | CWM Advisors, LLC | 7.896 | 17,69 | 515 | 10,52 | ||||
| 2025-11-14 | 13F | Fundsmith LLP | 0 | -100,00 | 0 | |||||
| 2026-02-17 | 13F | Numerai GP LLC | 7.544 | -67,83 | 524 | -67,83 | ||||
| 2026-02-17 | 13F | Point72 Asset Management, L.P. | 520.453 | 10,49 | 36.151 | 10,46 | ||||
| 2026-02-06 | 13F | Gsa Capital Partners Llp | 17.535 | 4,00 | 1 | 0,00 | ||||
| 2026-01-28 | 13F | SP Asset Management LLC | 4.941 | 0,00 | 343 | 0,00 | ||||
| 2026-02-06 | 13F | Handelsbanken Fonder AB | 12.900 | 0,00 | 1 | |||||
| 2026-02-12 | 13F | Ci Investments Inc. | 0 | -100,00 | 0 | |||||
| 2025-11-07 | 13F | TimesSquare Capital Management, LLC | 0 | -100,00 | 0 | -100,00 | ||||
| 2026-02-13 | 13F | Public Employees Retirement Association Of Colorado | 173.372 | 0,00 | 12 | 0,00 | ||||
| 2025-11-14 | 13F | Fiduciary Trust Co | 0 | -100,00 | 0 | |||||
| 2026-02-18 | 13F | State of Tennessee, Treasury Department | 10.945 | -4,10 | 787 | -0,76 | ||||
| 2026-02-06 | 13F | Legato Capital Management LLC | 6.547 | -39,29 | 455 | -39,39 | ||||
| 2026-02-10 | 13F | Meramec Financial Planners, LLC | 54 | 4 | ||||||
| 2026-02-17 | 13F | Mirabella Financial Services Llp | 0 | -100,00 | 0 | |||||
| 2025-11-14 | 13F | Susquehanna International Group, Llp | 0 | -100,00 | 0 | -100,00 | ||||
| 2026-02-03 | 13F | Crossmark Global Holdings, Inc. | 3.648 | 0,25 | 253 | 0,40 | ||||
| 2026-04-23 | 13F | Private Wealth Management Group, LLC | 44 | -58,10 | 3 | -71,43 | ||||
| 2026-04-13 | 13F | Hm Payson & Co | 589 | 0,00 | 38 | -5,00 | ||||
| 2026-01-29 | 13F | Vanguard Group Inc | 5.143.010 | -2,05 | 357.233 | -2,08 | ||||
| 2026-02-13 | 13F | Mariner, LLC | 17.101 | 13,35 | 1.188 | 13,36 | ||||
| 2026-02-13 | 13F | Stifel Financial Corp | 95.464 | -16,25 | 6.631 | -16,28 | ||||
| 2026-01-28 | 13F | Universal- Beteiligungs- und Servicegesellschaft mbH | 3.369 | -81,17 | 234 | -81,17 | ||||
| 2025-11-05 | 13F | Portside Wealth Group, LLC | 0 | -100,00 | 0 | -100,00 | ||||
| 2026-01-29 | 13F | State Of Michigan Retirement System | 11.800 | -1,67 | 820 | -1,68 | ||||
| 2026-02-05 | 13F | Isthmus Partners, Llc | 3.390 | 235 | ||||||
| 2026-02-10 | 13F | Principia Wealth Advisory, LLC | 1 | -92,86 | 0 | |||||
| 2026-02-17 | 13F | Voleon Capital Management Lp | 45.450 | -23,86 | 3.157 | -23,90 | ||||
| 2026-02-12 | 13F | Grey Fox Wealth Advisors, LLC | 0 | -100,00 | 0 | |||||
| 2026-04-20 | 13F | State of Alaska, Department of Revenue | 7.796 | 0,00 | 1 | |||||
| 2026-02-12 | 13F | Aviva Plc | 6.781 | -0,43 | 471 | -0,42 | ||||
| 2026-02-17 | 13F | Northern Trust Corp | 740.274 | 0,94 | 51.419 | 0,91 | ||||
| 2025-11-14 | 13F | Petrus Trust Company, LTA | 0 | -100,00 | 0 | |||||
| 2026-02-13 | 13F | Palisade Asset Management, LLC | 0 | -100,00 | 0 | |||||
| 2026-03-06 | 13F | Hsbc Holdings Plc | 11.473 | 53,65 | 799 | 55,45 | ||||
| 2026-04-23 | 13F | Farmers & Merchants Investments Inc | 44 | 0,00 | 3 | -33,33 | ||||
| 2026-02-12 | 13F | Granite Investment Partners, LLC | 206.221 | 159,88 | 14.324 | 159,82 | ||||
| 2026-04-24 | 13F | Mitchell & Pahl Private Wealth, Llc | 9.147 | 6,93 | 597 | 0,34 | ||||
| 2026-04-17 | 13F | Certified Advisory Corp | 3.700 | -21,66 | 241 | -26,52 | ||||
| 2026-02-17 | 13F | Two Sigma Investments, Lp | 523.704 | 22,18 | 36.376 | 22,15 | ||||
| 2026-02-17 | 13F | Twinbeech Capital Lp | 18.771 | 1.304 | ||||||
| 2026-04-20 | 13F | Assenagon Asset Management S.A. | 0 | -100,00 | 0 | |||||
| 2026-02-06 | 13F | Leonteq Securities AG | 62 | 0,00 | 4 | 0,00 | ||||
| 2026-02-13 | 13F | Charles Schwab Investment Management Inc | 516.095 | -2,52 | 35.848 | -2,55 | ||||
| 2026-02-05 | 13F | Tucker Asset Management Llc | 16 | 1 | ||||||
| 2026-04-24 | 13F | Strs Ohio | 900 | -55,00 | 59 | -57,97 | ||||
| 2026-02-17 | 13F | Royal Bank Of Canada | 209.135 | -31,53 | 14.526 | -31,55 | ||||
| 2026-01-27 | 13F | Evergreen Capital Management Llc | 11.081 | 770 | ||||||
| 2026-02-13 | 13F | Sei Investments Co | 195.822 | 27,12 | 13.604 | 27,08 | ||||
| 2026-01-29 | 13F | Dunhill Financial, LLC | 1 | 0 | ||||||
| 2026-02-06 | 13F | Larson Financial Group LLC | 0 | -100,00 | 0 | |||||
| 2026-02-11 | 13F | SOUTH STATE Corp | 21 | 50,00 | 1 | |||||
| 2026-02-12 | 13F | Principal Securities, Inc. | 0 | -100,00 | 0 | -100,00 | ||||
| 2026-02-12 | 13F | Callan Family Office, LLC | 8.497 | 590 | ||||||
| 2026-02-13 | 13F | Jacobs Levy Equity Management, Inc | 67.416 | -46,85 | 4.683 | -46,87 | ||||
| 2026-02-06 | 13F | EverSource Wealth Advisors, LLC | 1.589 | -9,82 | 110 | -9,84 | ||||
| 2026-04-15 | 13F | Trust Point Inc. | 5.013 | 12,20 | 327 | 5,48 | ||||
| 2026-02-13 | 13F | Kilter Group LLC | 58 | 4 | ||||||
| 2026-02-17 | 13F | Jones Financial Companies Lllp | 87 | -67,05 | 6 | -66,67 | ||||
| 2025-11-13 | 13F/A | Cynosure Management, Llc | 9.659 | 0,00 | 671 | -6,93 | ||||
| 2026-02-26 | 13F | Anchor Investment Management, LLC | 555 | 0,00 | 39 | 0,00 | ||||
| 2026-04-17 | 13F | Riverbridge Partners Llc | 533.119 | -3,80 | 34.786 | -9,63 | ||||
| 2026-02-10 | 13F | Bnp Paribas Arbitrage, Sa | 156.148 | -21,73 | 10.846 | -21,75 | ||||
| 2026-02-17 | 13F | Engineers Gate Manager LP | 39.750 | 187,61 | 2.761 | 187,60 | ||||
| 2026-02-13 | 13F | Great West Life Assurance Co /can/ | 28.546 | -23,16 | 2 | -50,00 | ||||
| 2026-01-26 | 13F | KBC Group NV | 1.439 | 0,00 | 0 | |||||
| 2025-11-06 | 13F | Ameritas Advisory Services, LLC | 0 | -100,00 | 0 | |||||
| 2026-02-04 | 13F | Clark Wealth Partners | 0 | -100,00 | 0 | -100,00 | ||||
| 2026-02-17 | 13F | Weiss Asset Management LP | 0 | -100,00 | 0 | -100,00 | ||||
| 2026-04-09 | 13F | Park Place Capital Corp | 522 | 29,85 | 34 | 25,93 | ||||
| 2026-02-09 | 13F | Jefferies Financial Group Inc. | 0 | -100,00 | 0 | |||||
| 2026-02-13 | 13F | Quarry LP | 84 | 6 | ||||||
| 2026-04-22 | 13F | Janney Montgomery Scott LLC | 38.791 | 5,05 | 3 | 0,00 | ||||
| 2026-01-28 | 13F | Teacher Retirement System Of Texas | 108.567 | 18,78 | 7.541 | 18,76 | ||||
| 2026-02-05 | 13F | Allworth Financial LP | 469 | 86,11 | 33 | 88,24 | ||||
| 2026-02-10 | 13F | Intech Investment Management Llc | 19.262 | -13,16 | 1.338 | -13,24 | ||||
| 2026-02-06 | 13F | Vestmark Advisory Solutions, Inc. | 29.440 | -9,70 | 2.045 | -9,76 | ||||
| 2026-02-11 | 13F | LPL Financial LLC | 60.592 | -13,35 | 4.209 | -13,38 | ||||
| 2026-02-17 | 13F | Advisor Group Holdings, Inc. | 5.909 | -7,97 | 411 | -8,07 | ||||
| 2026-02-11 | 13F | BLI - Banque de Luxembourg Investments | 162.649 | 1,34 | 11.427 | 2,59 | ||||
| 2026-04-24 | 13F | UMA Financial Services, Inc. | 47 | 34,29 | 3 | 50,00 | ||||
| 2025-11-07 | 13F | Beacon Capital Management, LLC | 0 | -100,00 | 0 | |||||
| 2026-04-24 | 13F | Retirement Systems of Alabama | 90.759 | 1,44 | 5.922 | -4,70 | ||||
| 2026-02-17 | 13F | nVerses Capital, LLC | 3.144 | 218 | ||||||
| 2026-04-23 | 13F | CBOE Vest Financial, LLC | 68.563 | 9,96 | 4.474 | 3,30 | ||||
| 2026-01-30 | 13F | State of New Jersey Common Pension Fund D | 31.368 | 3,94 | 2.179 | 3,91 | ||||
| 2026-02-12 | 13F | MetLife Investment Management, LLC | 51.881 | -5,16 | 3.604 | -5,18 | ||||
| 2026-02-17 | 13F | State Of Wisconsin Investment Board | 0 | -100,00 | 0 | -100,00 | ||||
| 2026-04-17 | 13F | CENTRAL TRUST Co | 27 | 2 | ||||||
| 2026-04-15 | 13F | Fortitude Family Office, LLC | 26 | 420,00 | 2 | |||||
| 2026-02-17 | 13F | Aquatic Capital Management LLC | 3.541 | -88,24 | 246 | -88,28 | ||||
| 2026-04-13 | 13F | Massmutual Trust Co Fsb/adv | 195 | -32,99 | 13 | -40,00 | ||||
| 2025-11-13 | 13F | Glenmede Investment Management, LP | 10.610 | -7,12 | 737 | -13,60 | ||||
| 2026-01-27 | 13F | Zurcher Kantonalbank (Zurich Cantonalbank) | 10.709 | 5,06 | 744 | 4,94 | ||||
| 2026-02-13 | 13F | Bridge City Capital, LLC | 41.435 | 3,85 | 2.878 | 3,82 | ||||
| 2026-02-10 | 13F | Quantbot Technologies LP | 0 | -100,00 | 0 | |||||
| 2026-02-17 | 13F | Canada Pension Plan Investment Board | 168.700 | 81,98 | 11.718 | 81,94 | ||||
| 2026-02-10 | 13F | Natixis Advisors, L.p. | 0 | -100,00 | 0 | |||||
| 2026-04-20 | 13F | Louisiana State Employees Retirement System | 14.500 | 5,07 | 946 | -1,25 | ||||
| 2025-11-12 | 13F | Intellectus Partners, LLC | 0 | -100,00 | 0 | -100,00 | ||||
| 2026-02-05 | 13F | Atria Investments Llc | 19.020 | 1,89 | 1.321 | 1,93 | ||||
| 2026-03-04 | 13F | SHP Wealth Management | 9 | 1 | ||||||
| 2026-02-17 | 13F | Wiley Bros.-aintree Capital, Llc | 17.802 | -0,32 | 1.237 | -0,16 | ||||
| 2026-02-10 | 13F | Axq Capital, Lp | 0 | -100,00 | 0 | |||||
| 2026-02-13 | 13F | Edgestream Partners, L.P. | 42.002 | -4,40 | 2.917 | -4,42 | ||||
| 2026-02-10 | 13F/A | Northwestern Mutual Wealth Management Co | 231 | -12,17 | 16 | -11,11 | ||||
| 2026-01-29 | 13F | Inscription Capital, LLC | 0 | -100,00 | 0 | |||||
| 2026-01-12 | 13F | Rialto Wealth Management, LLC | 19 | 1.800,00 | 1 | |||||
| 2025-12-09 | 13F/A | Tudor Investment Corp Et Al | 0 | -100,00 | 0 | |||||
| 2026-01-23 | 13F | Steigerwald, Gordon & Koch Inc. | 31 | 2 | ||||||
| 2026-02-02 | 13F | Truist Financial Corp | 35.989 | -42,85 | 2.500 | -42,88 | ||||
| 2026-02-17 | 13F | Captrust Financial Advisors | 10.329 | 42,49 | 717 | 42,54 | ||||
| 2026-01-30 | 13F | Urban Wealth Management, LLC | 0 | -100,00 | 0 | -100,00 | ||||
| 2026-04-22 | 13F | Pictet Asset Management Holding SA | 8.004 | -0,58 | 522 | -6,62 | ||||
| 2026-02-03 | 13F | SBI Securities Co., Ltd. | 18 | -5,26 | 1 | 0,00 | ||||
| 2025-11-14 | 13F | Capstone Investment Advisors, Llc | 4.551 | -13,73 | 316 | -19,80 | ||||
| 2026-02-11 | 13F | Franklin Resources Inc | 5.754 | 2,40 | 400 | 2,31 | ||||
| 2026-04-22 | 13F | Sterling Capital Management LLC | 324 | -1,82 | 21 | -4,55 | ||||
| 2026-02-09 | 13F | Summitry Llc | 7.081 | 21,00 | 492 | 20,94 | ||||
| 2026-02-12 | 13F | Bank Of Montreal /can/ | 6.832 | -2,78 | 475 | -2,87 | ||||
| 2026-01-28 | 13F | CAPROCK Group, Inc. | 3.768 | 10,47 | 262 | 7,41 | ||||
| 2026-02-17 | 13F | Jump Financial, LLC | 9.300 | 5,45 | 646 | 5,39 | ||||
| 2026-02-05 | 13F | Elyxium Wealth, LLC | 1 | 0 | ||||||
| 2026-02-13 | 13F | Morgan Stanley | 1.154.210 | 3,58 | 80.172 | 3,55 | ||||
| 2026-01-12 | 13F | CVA Family Office, LLC | 0 | -100,00 | 0 | |||||
| 2026-02-06 | 13F | Resona Asset Management Co.,Ltd. | 668.102 | -5,27 | 46.761 | -4,53 | ||||
| 2026-02-06 | 13F | Aviance Capital Partners, LLC | 7.000 | 0,00 | 486 | 0,00 | ||||
| 2026-02-10 | 13F | Marshall & Sterling Wealth Advisors Inc. | 0 | -100,00 | 0 | |||||
| 2026-02-09 | 13F | Quest Partners LLC | 22.117 | 102,09 | 1.536 | 102,11 | ||||
| 2026-02-17 | 13F | Optiver Holding B.V. | 354 | -22,37 | 25 | -22,58 | ||||
| 2026-02-11 | 13F | Hughes Financial Services, LLC | 1 | -97,14 | 0 | -100,00 | ||||
| 2026-04-15 | 13F | DAVENPORT & Co LLC | 3.239 | 211 | ||||||
| 2026-02-09 | 13F | Keating Financial Advisory Services, Inc. | 17 | 1 | ||||||
| 2026-02-11 | 13F | Los Angeles Capital Management Llc | 260 | 17 | ||||||
| 2026-02-13 | 13F | Manufacturers Life Insurance Company, The | 0 | -100,00 | 0 | |||||
| 2026-02-13 | 13F | Transamerica Financial Advisors, Inc. | 55 | 4 | ||||||
| 2025-11-14 | 13F | Skopos Labs, Inc. | 0 | -100,00 | 0 | |||||
| 2026-02-13 | 13F | Kestra Advisory Services, LLC | 1.128 | 78 | ||||||
| 2026-02-02 | 13F | Fifth Third Bancorp | 6.146 | 130,19 | 427 | 130,27 | ||||
| 2026-04-17 | 13F | Bell Investment Advisors, Inc | 377 | 423,61 | 25 | 380,00 | ||||
| 2026-04-16 | 13F | SG Americas Securities, LLC | 34.365 | -6,13 | 2 | 0,00 | ||||
| 2025-11-03 | 13F | Townsquare Capital Llc | 0 | -100,00 | 0 | |||||
| 2026-04-08 | 13F | DiNuzzo Private Wealth, Inc. | 6 | -25,00 | 0 | |||||
| 2026-02-13 | 13F | Mml Investors Services, Llc | 5.163 | -37,47 | 359 | -37,52 | ||||
| 2026-04-15 | 13F | Third View Private Wealth, LLC | 3.113 | -29,43 | 203 | -33,66 | ||||
| 2026-02-13 | 13F | Pinnacle Wealth Planning Services, Inc. | 120 | 8 | ||||||
| 2026-01-29 | 13F | Comerica Bank | 314.203 | 23,56 | 21.825 | 23,52 | ||||
| 2026-02-17 | 13F | Graham Capital Management, L.P. | 6.581 | 127,87 | 457 | 128,50 | ||||
| 2026-02-06 | 13F | Covestor Ltd | 2.671 | -21,33 | 0 | |||||
| 2026-02-13 | 13F | Nicolet Advisory Services, Llc | 5.952 | -42,53 | 443 | -35,57 | ||||
| 2026-04-13 | 13F | Mather Group, Llc. | 1.307 | 85 | ||||||
| 2026-01-29 | 13F | Teachers Retirement System Of The State Of Kentucky | 16.920 | 0,00 | 1 | 0,00 | ||||
| 2026-04-24 | 13F | Yousif Capital Management, Llc | 14.713 | -5,84 | 960 | -16,23 | ||||
| 2026-02-11 | 13F | Manchester Capital Management LLC | 48 | 3 | ||||||
| 2026-02-02 | 13F | Danske Bank A/s | 300 | 0,00 | 21 | 0,00 | ||||
| 2026-02-06 | 13F | Pnc Financial Services Group, Inc. | 8.660 | 2,86 | 602 | 2,91 | ||||
| 2026-02-04 | 13F | Summit Wealth Group Llc / Co | 0 | -100,00 | 0 | |||||
| 2026-02-11 | 13F | Simplex Trading, Llc | 0 | -100,00 | 0 | |||||
| 2025-11-14 | 13F | Walleye Trading LLC | 0 | -100,00 | 0 | -100,00 | ||||
| 2026-02-17 | 13F | Russell Investments Group, Ltd. | 11.499 | 67,67 | 799 | 67,65 | ||||
| 2025-11-14 | 13F | Walleye Trading LLC | Call | 0 | -100,00 | 0 | -100,00 | |||
| 2026-02-13 | 13F | Police & Firemen's Retirement System of New Jersey | 13.470 | -4,29 | 936 | -4,30 | ||||
| 2026-04-08 | 13F | Wealth Enhancement Advisory Services, Llc | 14.111 | 60,79 | 939 | 45,81 | ||||
| 2026-04-13 | 13F | IFP Advisors, Inc | 89 | -59,36 | 6 | -66,67 | ||||
| 2025-11-06 | 13F | Whipplewood Advisors, LLC | 0 | -100,00 | 0 | |||||
| 2026-02-05 | 13F | Northwestern Mutual Investment Management Company, Llc | 11.162 | -0,84 | 775 | -0,90 | ||||
| 2026-02-17 | 13F | Trexquant Investment LP | 88.255 | 42,10 | 6.130 | 42,06 | ||||
| 2025-11-13 | 13F | Inceptionr Llc | 0 | -100,00 | 0 | |||||
| 2026-02-13 | 13F | BNP Paribas Asset Management Holding S.A. | 520 | 40,92 | 0 | |||||
| 2026-01-15 | 13F | Nisa Investment Advisors, Llc | 636 | -53,98 | 44 | -54,17 | ||||
| 2026-02-06 | 13F | HighTower Advisors, LLC | 0 | -100,00 | 0 | |||||
| 2026-04-14 | 13F | Bay Harbor Wealth Management, LLC | 9 | 50,00 | 1 | |||||
| 2026-01-30 | 13F | Torren Management, LLC | 0 | 0 | ||||||
| 2026-04-10 | 13F | Impact Capital Partners LLC | 3.889 | -11,29 | 254 | -16,78 | ||||
| 2026-02-11 | 13F | Saturna Capital CORP | 4.000 | 0,00 | 278 | 0,00 | ||||
| 2026-04-24 | 13F | BetterWealth, LLC | 4.666 | 0,00 | 304 | -6,17 | ||||
| 2026-02-09 | 13F | Harbour Investments, Inc. | 16 | 77,78 | 1 | |||||
| 2026-01-29 | 13F | UBS Group AG | 176.404 | 29,67 | 12.253 | 29,63 | ||||
| 2026-02-10 | 13F | Argent Trust Co | 2.880 | 200 | ||||||
| 2026-02-12 | 13F | Voya Investment Management Llc | 9.151 | -0,53 | 636 | -0,63 | ||||
| 2025-11-05 | 13F | Koesten, Hirschmann & Crabtree, INC. | 0 | -100,00 | 0 | |||||
| 2026-02-11 | 13F | Simplex Trading, Llc | Put | 500 | 400,00 | 35 | ||||
| 2026-02-11 | 13F | Simplex Trading, Llc | Call | 2.400 | 167 | |||||
| 2026-02-17 | 13F | Df Dent & Co Inc | 0 | -100,00 | 0 | |||||
| 2026-02-17 | 13F | Voloridge Investment Management, Llc | 191.611 | -24,90 | 13.309 | -24,92 | ||||
| 2026-02-14 | 13F | Rockefeller Capital Management L.P. | 3.340 | 331,52 | 232 | 337,74 | ||||
| 2026-02-17 | 13F | Alliancebernstein L.p. | 98.614 | -1,06 | 6.850 | -1,10 | ||||
| 2026-02-04 | 13F | Washington Trust Bank | 9.608 | 667 | ||||||
| 2026-02-06 | 13F | Global Retirement Partners, LLC | 1.972 | 1.001,68 | 137 | 1.033,33 | ||||
| 2026-04-06 | 13F | Versant Capital Management, Inc | 1.226 | 17,43 | 80 | 9,72 | ||||
| 2026-01-29 | 13F | Quent Capital, LLC | 21 | 425,00 | 1 | |||||
| 2026-02-12 | 13F | Hrt Financial Lp | 38.173 | -8,15 | 3 | 0,00 | ||||
| 2025-11-21 | 13F/A | CIBC Bancorp USA Inc. | 5.421 | 377 | ||||||
| 2026-02-09 | 13F | Royce & Associates Lp | 652.109 | 73,79 | 45.295 | 73,74 | ||||
| 2026-01-14 | 13F | Spire Wealth Management | 0 | -100,00 | 0 | |||||
| 2026-02-10 | 13F | Bank of New York Mellon Corp | 462.027 | 12,37 | 32.092 | 12,34 | ||||
| 2026-01-28 | 13F | WPG Advisers, LLC | 26 | -18,75 | 2 | -50,00 | ||||
| 2026-02-13 | 13F | Integrated Wealth Concepts LLC | 0 | -100,00 | 0 | -100,00 | ||||
| 2026-02-17 | 13F | Janus Henderson Group Plc | 22.201 | 9,38 | 1.542 | 9,29 | ||||
| 2026-02-12 | 13F | Dimensional Fund Advisors Lp | 898.615 | 0,30 | 62.419 | 0,27 | ||||
| 2025-10-30 | 13F | Twin Peaks Wealth Advisors, LLC | 0 | -100,00 | 0 | |||||
| 2026-01-28 | 13F | Klp Kapitalforvaltning As | 18.500 | 1,09 | 1.285 | 1,10 | ||||
| 2026-02-13 | 13F | Pathstone Holdings, LLC | 23.413 | 42,15 | 1.626 | 42,13 | ||||
| 2026-02-17 | 13F | Quadrature Capital Ltd | 0 | -100,00 | 0 | |||||
| 2026-03-10 | 13F | Montanaro Asset Management Ltd | 120.500 | -0,90 | 8.370 | -0,94 | ||||
| 2026-02-06 | 13F | Entrust Financial Llc | 129 | 9 | ||||||
| 2025-11-18 | 13F | US Asset Management LLC | 0 | -100,00 | 0 | |||||
| 2026-02-11 | 13F | O'shaughnessy Asset Management, Llc | 5.385 | 15,63 | 374 | 15,79 | ||||
| 2026-01-29 | 13F | Sanctuary Advisors, LLC | 17.490 | -11,43 | 1.215 | -11,52 | ||||
| 2026-02-17 | 13F | PDT Partners, LLC | 4.231 | 294 | ||||||
| 2025-11-14 | 13F | EFG Asset Management (Americas) Corp. | 40.713 | -10,73 | 2.829 | -16,99 | ||||
| 2026-04-07 | 13F | CoreCap Advisors, LLC | 103 | 114,58 | 7 | 100,00 | ||||
| 2026-02-02 | 13F | Fenimore Asset Management Inc | 266.892 | 17,85 | 18.538 | 17,81 | ||||
| 2026-02-17 | 13F | Quantinno Capital Management LP | 17.086 | 91,35 | 1.187 | 91,29 | ||||
| 2026-02-17 | 13F | XTX Topco Ltd | 5.824 | 405 | ||||||
| 2026-04-23 | 13F | MQS Management LLC | 3.290 | 215 | ||||||
| 2026-02-12 | 13F | Renaissance Technologies Llc | 0 | -100,00 | 0 | |||||
| 2026-02-17 | 13F | Schonfeld Strategic Advisors LLC | 5.934 | -92,12 | 412 | -92,12 | ||||
| 2026-02-17 | 13F | Kemnay Advisory Services Inc. | 86 | 6 | ||||||
| 2026-02-12 | 13F | CIBC Private Wealth Group, LLC | 3.801 | -10,37 | 264 | -10,20 | ||||
| 2026-01-23 | 13F | Gibbs Wealth Management | 5.055 | -11,10 | 377 | -4,56 | ||||
| 2026-02-12 | 13F | Jane Street Group, Llc | 125.920 | 65,27 | 8.746 | 65,24 | ||||
| 2026-02-03 | 13F | Pilgrim Partners Asia Pte Ltd | 0 | -100,00 | 0 | -100,00 | ||||
| 2026-02-12 | 13F | Colonial Trust Co / SC | 2 | -94,29 | 0 | -100,00 | ||||
| 2026-02-17 | 13F | Algert Global Llc | 143.440 | 570,28 | 10 | 800,00 | ||||
| 2026-02-04 | 13F | Nicholas Company, Inc. | 91.225 | 0,00 | 6.336 | -0,03 | ||||
| 2026-02-17 | 13F | MIRAE ASSET GLOBAL ETFS HOLDINGS Ltd. | 368.991 | 2,34 | 25.630 | 2,31 | ||||
| 2026-02-13 | 13F | Alberta Investment Management Corp | 20.100 | 1.396 | ||||||
| 2026-02-12 | 13F | Campbell & CO Investment Adviser LLC | 37.297 | 138,53 | 2.591 | 138,49 | ||||
| 2026-02-12 | 13F | Nuveen, LLC | 219.724 | 93,09 | 15.262 | 93,04 | ||||
| 2026-02-12 | 13F | Quadrant Capital Group Llc | 2.650 | -61,60 | 184 | -61,59 | ||||
| 2026-02-13 | 13F/A | Ontario Teachers Pension Plan Board | 0 | -100,00 | 0 | -100,00 | ||||
| 2026-02-11 | 13F | Deutsche Bank Ag\ | 43.157 | -84,38 | 2.998 | -84,39 | ||||
| 2026-02-13 | 13F | Y-Intercept (Hong Kong) Ltd | 30.171 | -25,69 | 2.096 | -25,71 | ||||
| 2026-02-10 | 13F | Commonwealth Of Pennsylvania Public School Empls Retrmt Sys | 12.484 | -3,68 | 867 | -3,67 | ||||
| 2026-02-13 | 13F | Healthcare Of Ontario Pension Plan Trust Fund | 52.115 | 0,00 | 3.620 | -0,03 | ||||
| 2025-12-16 | 13F | Lindenwold Advisors | 2.936 | -7,56 | 204 | -14,35 | ||||
| 2026-02-17 | 13F | Dark Forest Capital Management Lp | 42.823 | -4,92 | 2.974 | -4,95 | ||||
| 2026-02-13 | 13F | Smartleaf Asset Management LLC | 269 | 51,12 | 19 | 50,00 | ||||
| 2026-04-13 | 13F | Wolff Wiese Magana Llc | 33 | 0,00 | 2 | 0,00 | ||||
| 2026-02-10 | 13F | Goldman Sachs Group Inc | 476.974 | 37,06 | 33.131 | 37,02 | ||||
| 2026-02-13 | 13F | SRS Capital Advisors, Inc. | 466 | -83,01 | 32 | -83,16 | ||||
| 2026-02-10 | 13F | New Mexico Educational Retirement Board | 10.300 | 0,00 | 1 | |||||
| 2026-02-05 | 13F | Stephens Inc /ar/ | 3.728 | -1,06 | 259 | -1,15 | ||||
| 2026-02-10 | 13F | Cherry Tree Wealth Management, LLC | 0 | -100,00 | 0 | |||||
| 2026-02-11 | 13F | Ameritas Investment Partners, Inc. | 13.392 | -2,36 | 930 | -2,31 | ||||
| 2026-02-13 | 13F | Prudential Financial Inc | 3.743 | -53,10 | 263 | -52,53 | ||||
| 2026-04-07 | 13F | Signaturefd, Llc | 1.433 | -1,58 | 93 | -7,92 | ||||
| 2026-02-17 | 13F | Raymond James Financial Inc | 392.638 | -23,84 | 27.273 | -23,86 | ||||
| 2026-02-13 | 13F | Walleye Capital LLC | 0 | -100,00 | 0 | |||||
| 2025-11-17 | 13F | Caxton Associates Llp | 0 | -100,00 | 0 | -100,00 | ||||
| 2026-02-12 | 13F | Brown Brothers Harriman & Co | 385 | -44,52 | 27 | -45,83 | ||||
| 2025-11-14 | 13F | Citadel Advisors Llc | Put | 0 | -100,00 | 0 | -100,00 | |||
| 2026-02-05 | 13F | HFM Investment Advisors, LLC | 3 | 200,00 | 0 | |||||
| 2026-02-12 | 13F | Swiss National Bank | 99.600 | 1,22 | 6.918 | 1,20 | ||||
| 2026-04-08 | 13F | Heritage Family Offices, LLP | 0 | -100,00 | 0 | |||||
| 2026-02-13 | 13F | Rhumbline Advisers | 155.391 | -9,12 | 10.793 | -9,15 | ||||
| 2026-02-13 | 13F | Caitong International Asset Management Co., Ltd | 0 | -100,00 | 0 | |||||
| 2026-04-15 | 13F | Bayforest Capital Ltd | 0 | -100,00 | 0 | |||||
| 2026-02-05 | 13F | Thrivent Financial For Lutherans | 11.331 | -3,15 | 1 | |||||
| 2026-04-08 | 13F | Grove Bank & Trust | 34 | 2 | ||||||
| 2026-04-13 | 13F | True Wealth Design, LLC | 44 | 33,33 | 3 | 0,00 | ||||
| 2026-04-23 | 13F | Harbor Investment Advisory, Llc | 260 | -62,15 | 17 | -65,96 | ||||
| 2026-02-17 | 13F | T. Rowe Price Investment Management, Inc. | 0 | -100,00 | 0 | |||||
| 2026-02-10 | 13F | Godfrey Financial Associates, Inc. | 1 | 0 | ||||||
| 2026-02-06 | 13F | Hardy Reed LLC | 3.543 | 11,70 | 246 | 11,82 | ||||
| 2026-02-12 | 13F | Cibc World Markets Corp | 3.365 | -46,30 | 234 | -50,21 | ||||
| 2026-01-14 | 13F | Eastern Bank | 0 | -100,00 | 0 | |||||
| 2026-02-17 | 13F | Millennium Management Llc | 252.143 | 2,08 | 17.514 | 2,05 | ||||
| 2026-02-11 | 13F | EULAV Asset Management | 262.100 | -15,89 | 18.205 | -15,91 | ||||
| 2026-02-17 | 13F | Aster Capital Management (DIFC) Ltd | 263 | -43,80 | 18 | -43,75 | ||||
| 2026-04-07 | 13F | Farther Finance Advisors, LLC | 503 | -54,36 | 33 | -57,89 | ||||
| 2026-02-17 | 13F | California State Teachers Retirement System | 47.777 | 1,89 | 3.319 | 1,87 | ||||
| 2025-11-12 | 13F | Bellwether Advisors, LLC | 0 | -100,00 | 0 | -100,00 | ||||
| 2026-02-13 | 13F | Ubs Asset Management Americas Inc | 137.263 | 39,64 | 9.534 | 39,61 | ||||
| 2025-11-14 | 13F | Cubist Systematic Strategies, LLC | 50.949 | 3.540 | ||||||
| 2026-04-23 | 13F | Oppenheimer Asset Management Inc. | 20.706 | 19,92 | 1.351 | 12,68 | ||||
| 2026-02-13 | 13F | Ieq Capital, Llc | 16.046 | 457,15 | 1.115 | 457,00 | ||||
| 2026-02-12 | 13F | Brinker Capital Investments, LLC | 0 | -100,00 | 0 | |||||
| 2026-02-17 | 13F | Fmr Llc | 28.302 | 79,96 | 1.966 | 79,95 | ||||
| 2026-02-12 | 13F | Geneva Capital Management Llc | 0 | -100,00 | 0 | |||||
| 2026-04-06 | 13F | CX Institutional | 12 | -33,33 | 0 | |||||
| 2025-11-13 | 13F | Arrowstreet Capital, Limited Partnership | 0 | -100,00 | 0 | |||||
| 2025-11-14 | 13F | Lido Advisors, LLC | 0 | -100,00 | 0 | |||||
| 2026-02-12 | 13F | BRYN MAWR TRUST Co | 0 | -100,00 | 0 | -100,00 | ||||
| 2026-02-17 | 13F | Ameriprise Financial Inc | 180.738 | -0,31 | 12.554 | -0,34 | ||||
| 2026-02-12 | 13F | Xponance, Inc. | 6.111 | -14,50 | 424 | -14,52 | ||||
| 2026-02-09 | 13F | Legal & General Group Plc | 80.536 | -3,76 | 5.594 | -3,78 | ||||
| 2026-02-23 | 13F | Mv Capital Management, Inc. | 9 | 1 | ||||||
| 2026-02-17 | 13F | Holocene Advisors, LP | 30.800 | -39,77 | 2.139 | -39,78 | ||||
| 2026-02-09 | 13F | Huntington National Bank | 5.476 | -2,53 | 380 | -2,56 | ||||
| 2026-02-05 | 13F | Bessemer Group Inc | 523 | -54,64 | 0 | |||||
| 2026-01-26 | 13F | AE Wealth Management LLC | 3.435 | 16,13 | 239 | 16,10 | ||||
| 2026-01-27 | 13F | WealthCollab, LLC | 0 | -100,00 | 0 | |||||
| 2026-02-17 | 13F | Citadel Advisors Llc | Call | 4.000 | 11,11 | 278 | 10,80 | |||
| 2025-11-14 | 13F | Centiva Capital, LP | 0 | -100,00 | 0 | -100,00 | ||||
| 2026-02-17 | 13F | Citadel Advisors Llc | 237.120 | -17,10 | 16.470 | -17,13 | ||||
| 2026-02-17 | 13F | ISAM Funds (UK) Ltd | 8.498 | -27,16 | 590 | -27,16 | ||||
| 2026-04-10 | 13F | Quaker Wealth Management, LLC | 0 | -100,00 | 0 | |||||
| 2026-02-13 | 13F | MAI Capital Management | 109 | 5,83 | 8 | 0,00 | ||||
| 2026-02-05 | 13F | Cambridge Investment Research Advisors, Inc. | 4.319 | -31,47 | 0 | |||||
| 2026-02-17 | 13F | SageView Advisory Group, LLC | 405 | 28 | ||||||
| 2026-02-09 | 13F | New Age Alpha Advisors, LLC | 24.775 | 785,77 | 1.721 | 786,60 | ||||
| 2026-02-03 | 13F | Robeco Schweiz AG | 0 | -100,00 | 0 | |||||
| 2026-02-06 | 13F | Bare Financial Services, Inc | 30 | 200,00 | 2 | |||||
| 2026-02-13 | 13F | JustInvest LLC | 20.850 | 45,43 | 1.448 | 45,38 | ||||
| 2026-02-19 | 13F | Invesco Ltd. | 581.878 | 2,73 | 40.417 | 2,70 | ||||
| 2025-11-05 | 13F | Gallacher Capital Management LLC | 0 | -100,00 | 0 | |||||
| 2026-02-17 | 13F | EFG International AG | 83.544 | 5.803 | ||||||
| 2026-02-17 | 13F | Susquehanna International Group, Llp | Call | 31.600 | 177,19 | 2.195 | 177,02 | |||
| 2026-02-17 | 13F | Susquehanna International Group, Llp | Put | 14.600 | -15,61 | 1.014 | -15,64 | |||
| 2026-02-12 | 13F | State Board Of Administration Of Florida Retirement System | 14.409 | 0,00 | 1.001 | -0,10 | ||||
| 2026-02-17 | 13F | Cetera Investment Advisers | 31.927 | -11,49 | 2.218 | -11,53 | ||||
| 2026-02-10 | 13F | Mutual Of America Capital Management Llc | 76.162 | -3,68 | 5.290 | -3,71 | ||||
| 2026-02-17 | 13F | Brevan Howard Capital Management LP | 4.590 | -1,69 | 319 | -1,85 | ||||
| 2026-02-11 | 13F | Barrow Hanley Mewhinney & Strauss Llc | 0 | -100,00 | 0 | |||||
| 2026-01-21 | 13F | Newbridge Financial Services Group, Inc. | 24 | 0,00 | 2 | 0,00 | ||||
| 2026-02-09 | 13F | Hantz Financial Services, Inc. | 907 | 129,04 | 0 | |||||
| 2026-04-20 | 13F | Jfs Wealth Advisors, Llc | 21 | -12,50 | 1 | 0,00 | ||||
| 2026-02-04 | 13F | Swiss Life Asset Management Ltd | 4.852 | 337 | ||||||
| 2026-02-10 | 13F | State of Wyoming | 1.107 | -58,02 | 77 | -58,47 | ||||
| 2026-02-17 | 13F | D. E. Shaw & Co., Inc. | 205.618 | -27,55 | 14.282 | -27,58 | ||||
| 2026-02-17 | 13F | Capital Fund Management S.a. | 84.210 | 32,35 | 5.849 | 32,33 | ||||
| 2026-02-17 | 13F | Mercer Global Advisors Inc /adv | 24.948 | -9,37 | 1.733 | -9,41 | ||||
| 2026-02-04 | 13F | Securian Asset Management, Inc | 3.626 | -2,68 | 252 | -2,71 | ||||
| 2026-02-06 | 13F | ProShare Advisors LLC | 92.167 | -5,86 | 6.402 | -5,90 | ||||
| 2026-02-13 | 13F | Kayne Anderson Rudnick Investment Management Llc | 4.143.107 | -7,72 | 287.780 | -7,75 | ||||
| 2026-01-20 | 13F | Harbor Capital Advisors, Inc. | 90 | -2,17 | 0 | |||||
| 2026-02-12 | 13F | BlackRock, Inc. | 6.164.467 | 1,58 | 428.184 | 1,55 | ||||
| 2026-02-12 | 13F | Alps Advisors Inc | 112.885 | -6,17 | 7.841 | -6,20 | ||||
| 2025-11-14 | 13F | Point72 Asia (Singapore) Pte. Ltd. | 2.335 | 162 | ||||||
| 2026-02-13 | 13F | Dynamic Technology Lab Private Ltd | 5.611 | 390 | ||||||
| 2026-02-10 | 13F | Eurizon Capital SGR S.p.A. | 1.256 | 88 | ||||||
| 2026-02-17 | 13F | Two Sigma Securities, Llc | 7.571 | 526 | ||||||
| 2026-01-26 | 13F | Whittier Trust Co Of Nevada Inc | 504 | -2,33 | 37 | 8,82 | ||||
| 2026-02-04 | 13F | Pacer Advisors, Inc. | 0 | -100,00 | 0 | |||||
| 2026-02-18 | 13F | GWM Advisors LLC | 0 | -100,00 | 0 | |||||
| 2026-01-28 | 13F | Arizona State Retirement System | 14.030 | -6,37 | 975 | -6,44 | ||||
| 2026-02-17 | 13F | Bank Of America Corp /de/ | 537.086 | -13,97 | 37.306 | -13,99 | ||||
| 2026-01-26 | 13F | Private Trust Co Na | 227 | 291,38 | 16 | 275,00 | ||||
| 2026-02-13 | 13F | Wealth Alliance | 4.459 | 310 | ||||||
| 2026-02-11 | 13F | Winnow Wealth Llc | 484 | 0,00 | 34 | 0,00 | ||||
| 2026-04-15 | 13F | Merit Financial Group, LLC | 4.816 | 314 | ||||||
| 2026-02-13 | 13F | Citigroup Inc | 10.515 | 15,59 | 730 | 15,51 | ||||
| 2026-02-12 | 13F | Cloud Capital Management, LLC | 0 | -100,00 | 0 | |||||
| 2026-02-13 | 13F | Marshall Wace, Llp | 100.399 | 6.974 | ||||||
| 2026-02-17 | 13F | Tower Research Capital LLC (TRC) | 2.916 | -53,11 | 203 | -53,24 | ||||
| 2026-02-10 | 13F | Envestnet Asset Management Inc | 260.998 | -35,47 | 18.129 | -35,49 | ||||
| 2026-02-13 | 13F | American Century Companies Inc | 42.708 | 71,75 | 2.967 | 71,74 | ||||
| 2026-02-09 | 13F | Coldstream Capital Management Inc | 3.668 | 255 | ||||||
| 2025-11-13 | 13F | FORA Capital, LLC | 0 | -100,00 | 0 | |||||
| 2026-02-17 | 13F | Freestone Grove Partners LP | 0 | -100,00 | 0 | |||||
| 2026-04-24 | 13F | Root Financial Partners, LLC | 330 | 146,27 | 22 | 133,33 | ||||
| 2026-02-02 | 13F | Principal Financial Group Inc | 149.616 | 7,16 | 10.392 | 7,12 | ||||
| 2026-02-13 | 13F | First Trust Advisors Lp | 898.343 | 54,85 | 62.399 | 54,81 | ||||
| 2026-01-23 | 13F | Westside Investment Management, Inc. | 0 | -100,00 | 0 | -100,00 | ||||
| 2026-02-13 | 13F | Umb Bank N A/mo | 904 | 54,79 | 63 | 55,00 | ||||
| 2026-04-17 | 13F | AdvisorNet Financial, Inc | 27 | 0,00 | 2 | 0,00 | ||||
| 2026-02-03 | 13F | NewEdge Wealth, LLC | 23.384 | -27,02 | 1.624 | -31,19 | ||||
| 2026-02-02 | 13F | Sachetta, LLC | 32 | 2 | ||||||
| 2026-02-17 | 13F | Gotham Asset Management, LLC | 4.256 | -36,52 | 296 | -36,56 | ||||
| 2026-02-04 | 13F | Oregon Public Employees Retirement Fund | 9.925 | -1,98 | 689 | -1,99 | ||||
| 2026-02-09 | 13F | Geode Capital Management, Llc | 1.590.205 | -0,19 | 110.468 | -0,22 | ||||
| 2026-02-05 | 13F | Td Private Client Wealth Llc | 7.248 | -40,79 | 503 | -40,82 | ||||
| 2026-02-06 | 13F | Envestnet Portfolio Solutions, Inc. | 4.885 | -25,64 | 339 | -25,66 | ||||
| 2026-02-13 | 13F | Barclays Plc | 196.995 | 12,58 | 13.683 | 12,55 | ||||
| 2026-02-11 | 13F | Parallel Advisors, LLC | 12.593 | -5,55 | 875 | -5,62 | ||||
| 2026-04-16 | 13F | Capital Advisors, Ltd. LLC | 0 | -100,00 | 0 | |||||
| 2026-04-24 | 13F | Conestoga Capital Advisors, LLC | 1.906.505 | -20,31 | 124.399 | -25,14 | ||||
| 2026-04-06 | 13F | GAMMA Investing LLC | 2.293 | 298,09 | 150 | 272,50 | ||||
| 2025-11-12 | 13F | 111 Capital | 0 | -100,00 | 0 | |||||
| 2026-01-30 | 13F | American Capital Advisory, LLC | 0 | -100,00 | 0 | |||||
| 2026-02-11 | 13F | GW&K Investment Management, LLC | 3.815 | 0 | ||||||
| 2026-02-13 | 13F | S&t Bank/pa | 0 | -100,00 | 0 | |||||
| 2026-02-17 | 13F | Scarborough Advisors, LLC | 0 | -100,00 | 0 | |||||
| 2026-02-12 | 13F | California Public Employees Retirement System | 87.467 | -0,22 | 6.075 | -0,25 | ||||
| 2026-02-19 | 13F | CI Private Wealth, LLC | 6.915 | 43,52 | 480 | 43,71 | ||||
| 2026-04-10 | 13F | AssuredPartners Investment Advisors, LLC | 0 | -100,00 | 0 | |||||
| 2026-04-20 | 13F | LVW Advisors, LLC | 3.418 | -3,58 | 223 | -9,35 | ||||
| 2026-02-11 | 13F | Cerity Partners LLC | 26.211 | 27,82 | 1.821 | 27,81 | ||||
| 2026-01-26 | 13F | Cwm, Llc | 10.727 | 80,92 | 1 | |||||
| 2026-02-09 | 13F | Hartland & Co., LLC | 1.099 | 5,47 | 76 | 5,56 | ||||
| 2026-02-17 | 13F | Bamco Inc /ny/ | 470.868 | -6,29 | 32.706 | -6,31 | ||||
| 2026-02-17 | 13F | Public Employees Retirement System Of Ohio | 17.467 | 0,09 | 1.213 | 0,08 | ||||
| 2025-11-07 | 13F | CenterBook Partners LP | 0 | -100,00 | 0 | |||||
| 2026-02-11 | 13F | Jpmorgan Chase & Co | 368.655 | -23,30 | 25.607 | -23,32 | ||||
| 2026-02-13 | 13F | Victory Capital Management Inc | 48.078 | 15,23 | 3.339 | 15,18 | ||||
| 2026-02-13 | 13F | Wells Fargo & Company/mn | 600.966 | -15,21 | 41.743 | -15,24 | ||||
| 2026-02-02 | 13F | Benjamin Edwards Inc | 2.974 | 207 | ||||||
| 2026-01-27 | 13F | Regions Financial Corp | 0 | -100,00 | 0 | -100,00 | ||||
| 2026-02-11 | 13F | Rise Advisors, LLC | 0 | -100,00 | 0 | |||||
| 2026-02-17 | 13F | Ancora Advisors, LLC | 13 | -27,78 | 1 | -100,00 | ||||
| 2025-11-14 | 13F | Balyasny Asset Management Llc | 0 | -100,00 | 0 | |||||
| 2026-01-23 | 13F | Optima Capital Llc | 7 | 0 | ||||||
| 2026-02-12 | 13F | Federation des caisses Desjardins du Quebec | 138 | 0,00 | 10 | 0,00 | ||||
| 2026-02-02 | 13F | Cornerstone Planning Group LLC | 8 | 1 | ||||||
| 2026-02-12 | 13F | Federated Hermes, Inc. | 2.248 | -50,17 | 156 | -50,16 | ||||
| 2026-02-12 | 13F | Mount Yale Investment Advisors, LLC | 3.368 | 234 | ||||||
| 2026-01-05 | 13F | Park Avenue Securities Llc | 0 | -100,00 | 0 | |||||
| 2026-02-03 | 13F | Sequoia Financial Advisors, LLC | 13.158 | 134,67 | 914 | 134,70 | ||||
| 2026-02-13 | 13F | Mirova | 24.166 | -7,92 | 1.679 | -7,95 | ||||
| 2026-02-12 | 13F | Wealthspire Advisors, LLC | 0 | -100,00 | 0 | |||||
| 2026-02-17 | 13F | Qube Research & Technologies Ltd | 54.581 | -54,06 | 3.791 | -54,08 | ||||
| 2026-02-13 | 13F | Parkside Financial Bank & Trust | 1.493 | -4,05 | 104 | -4,63 | ||||
| 2026-04-14 | 13F | Roffman Miller Associates Inc /pa/ | 289.108 | -2,33 | 18.864 | -8,25 | ||||
| 2026-02-17 | 13F | Two Sigma Advisers, Lp | 377.500 | 14,46 | 26.221 | 14,43 |
Other Listings
| DE:EP5 | 56,12 € |