Grundlæggende statistik
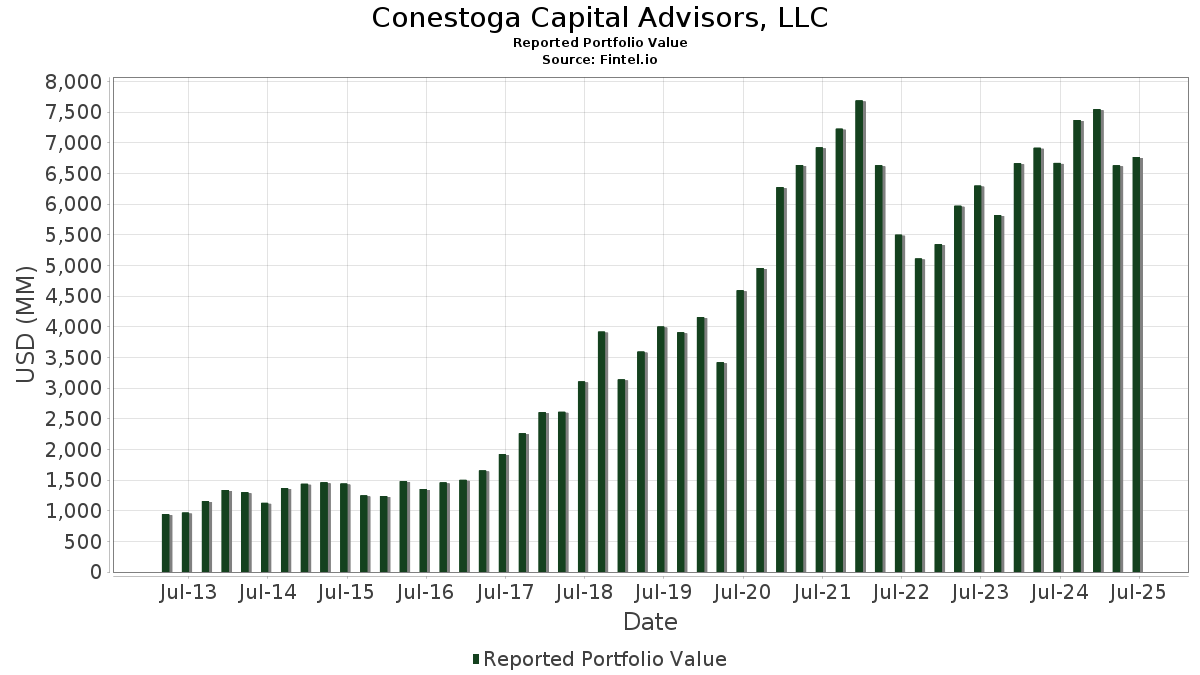
| Porteføljeværdi | $ 6.767.761.959 |
| Nuværende stillinger | 122 |
Seneste beholdninger, ydeevne, AUM (fra 13F, 13D)
Conestoga Capital Advisors, LLC har afsløret 122 samlede besiddelser i deres seneste SEC-arkivering. Den seneste porteføljeværdi er beregnet til at være $ 6.767.761.959 USD. Faktiske aktiver under forvaltning (AUM) er denne værdi plus kontanter (som ikke er oplyst). Conestoga Capital Advisors, LLCs største beholdninger er Casella Waste Systems, Inc. (US:CWST) , Construction Partners, Inc. (US:ROAD) , The Descartes Systems Group Inc. (US:DSGX) , RBC Bearings Incorporated (US:RBC) , and FirstService Corporation (US:FSV) . Conestoga Capital Advisors, LLCs nye stillinger omfatter Cloudflare, Inc. (US:NET) , . Conestoga Capital Advisors, LLCs topbrancher er "Communications" (sic 48) , "Holding And Other Investment Offices" (sic 67) , and "General Merchandise Stores" (sic 53) .
Top øger dette kvartal
Vi bruger ændringen i porteføljeallokeringen, fordi dette er den mest meningsfulde metrik. Ændringer kan skyldes handler eller ændringer i aktiekurser.
| Sikkerhed | Aktier (MM) |
Værdi (MM$) |
Portefølje % | ΔPortefølje % |
|---|---|---|---|---|
| 0,86 | 106,04 | 1,5669 | 0,9603 | |
| 1,17 | 85,19 | 1,2588 | 0,6546 | |
| 1,35 | 144,03 | 2,1282 | 0,5990 | |
| 2,56 | 137,82 | 2,0365 | 0,5689 | |
| 0,73 | 83,95 | 1,2404 | 0,4406 | |
| 0,80 | 133,34 | 1,9702 | 0,4179 | |
| 8,12 | 198,49 | 2,9328 | 0,4105 | |
| 2,63 | 279,89 | 4,1357 | 0,3912 | |
| 1,02 | 195,14 | 2,8833 | 0,3783 | |
| 1,58 | 203,66 | 3,0093 | 0,3762 |
Top falder i dette kvartal
Vi bruger ændringen i porteføljeallokeringen, fordi dette er den mest meningsfulde metrik. Ændringer kan skyldes handler eller ændringer i aktiekurser.
| Sikkerhed | Aktier (MM) |
Værdi (MM$) |
Portefølje % | ΔPortefølje % |
|---|---|---|---|---|
| 0,17 | 20,75 | 0,3065 | -1,4575 | |
| 1,28 | 22,37 | 0,3306 | -0,6344 | |
| 2,21 | 206,74 | 3,0548 | -0,5568 | |
| 6,69 | 146,73 | 2,1680 | -0,5493 | |
| 2,71 | 202,15 | 2,9870 | -0,4070 | |
| 2,68 | 309,23 | 4,5692 | -0,2736 | |
| 0,00 | 0,37 | 0,0054 | -0,2353 | |
| 0,57 | 53,34 | 0,7882 | -0,2344 | |
| 1,15 | 182,66 | 2,6990 | -0,2213 | |
| 7,36 | 52,53 | 0,7762 | -0,2031 |
13D/G-arkivering
Dette er en liste over 13D- og 13G-arkiveringer lavet i det sidste år (hvis nogen). Klik på linkikonet for at se den fulde transaktionshistorik. Grønne rækker angiver nye positioner. Røde rækker angiver lukkede positioner.
| Fil dato | Form | Sikkerhed | Forrige Aktier |
Nuværende Aktier |
Δandele % | % Ejerskab |
% ΔEjerskab | |
|---|---|---|---|---|---|---|---|---|
| 2025-01-10 | TRNS / Transcat, Inc. | 949.059 | 972.464 | 2,47 | 10,57 | 1,83 | ||
| 2025-01-10 | / (T9SS4W109) | 4.830.398 | 8.614.215 | 17,37 | ||||
| 2025-01-10 | DGII / Digi International Inc. | 3.838.105 | 3.859.786 | 0,56 | 10,55 | -0,75 | ||
| 2025-01-10 | HLIO / Helios Technologies, Inc. | 2.144.989 | 2.140.634 | -0,20 | 6,44 | -0,77 | ||
| 2025-01-10 | CWST / Casella Waste Systems, Inc. | 3.224.881 | 3.432.843 | 6,45 | 5,51 | -2,65 | ||
| 2025-01-10 | MLAB / Mesa Laboratories, Inc. | 617.612 | 618.111 | 0,08 | 11,38 | -0,61 | ||
| 2025-01-10 | SLP / Simulations Plus, Inc. | 2.412.465 | 2.398.875 | -0,56 | 11,95 | -1,24 | ||
| 2025-01-10 | ROAD / Construction Partners, Inc. | 4.798.691 | 3.727.296 | -22,33 | 7,94 | -27,69 | ||
| 2025-01-10 | EXPO / Exponent, Inc. | 2.596.177 | 2.978.505 | 14,73 | 5,87 | 14,42 | ||
| 2025-01-10 | EVI / EVI Industries, Inc. | 677.391 | 788.616 | 16,42 | 6,19 | 14,63 | ||
| 2025-01-10 | LMAT / LeMaitre Vascular, Inc. | 2.061.262 | 1.825.724 | -11,43 | 8,12 | -12,31 |
13F og Fondsarkivering
Denne formular blev indsendt den 2025-07-30 for rapporteringsperioden 2025-06-30. Klik på linkikonet for at se den fulde transaktionshistorik.
Opgrader for at låse op for premium-data og eksportere til Excel ![]() .
.
| Sikkerhed | Type | Gennemsnitlig aktiekurs | Aktier (MM) |
Δ Aktier (%) |
Δ Aktier (%) |
Værdi ($MM) |
Portefølje (%) |
ΔPortefølje (%) |
|
|---|---|---|---|---|---|---|---|---|---|
| CWST / Casella Waste Systems, Inc. | 2,68 | -6,92 | 309,23 | -3,69 | 4,5692 | -0,2736 | |||
| ROAD / Construction Partners, Inc. | 2,63 | -23,76 | 279,89 | 12,74 | 4,1357 | 0,3912 | |||
| DSGX / The Descartes Systems Group Inc. | 2,69 | -3,29 | 273,22 | -2,51 | 4,0370 | -0,1899 | |||
| RBC / RBC Bearings Incorporated | 0,64 | -12,70 | 245,40 | 4,41 | 3,6261 | 0,0809 | |||
| FSV / FirstService Corporation | 1,40 | -2,85 | 244,91 | 2,23 | 3,6188 | 0,0055 | |||
| MMSI / Merit Medical Systems, Inc. | 2,21 | -2,37 | 206,74 | -13,66 | 3,0548 | -0,5568 | |||
| GSIG / Goldman Sachs ETF Trust - Goldman Sachs Access Investment Grade Corporate 1-5 Year Bond ETF | 1,58 | 15,70 | 203,66 | 16,66 | 3,0093 | 0,3762 | |||
| EXPO / Exponent, Inc. | 2,71 | -2,53 | 202,15 | -10,16 | 2,9870 | -0,4070 | |||
| STVN / Stevanato Group S.p.A. | 8,12 | -0,80 | 198,49 | 18,69 | 2,9328 | 0,4105 | |||
| ESE / ESCO Technologies Inc. | 1,02 | -2,57 | 195,14 | 17,49 | 2,8833 | 0,3783 | |||
| BCPC / Balchem Corporation | 1,15 | -1,63 | 182,66 | -5,66 | 2,6990 | -0,2213 | |||
| QTWO / Q2 Holdings, Inc. | 1,93 | -1,51 | 180,48 | 15,21 | 2,6667 | 0,3040 | |||
| SSD / Simpson Manufacturing Co., Inc. | 1,10 | -2,53 | 171,33 | -3,62 | 2,5316 | -0,1497 | |||
| SPSC / SPS Commerce, Inc. | 1,25 | -0,75 | 170,21 | 1,76 | 2,5151 | -0,0077 | |||
| CSW / CSW Industrials, Inc. | 0,59 | -1,74 | 170,02 | -3,32 | 2,5123 | -0,1403 | |||
| CWAN / Clearwater Analytics Holdings, Inc. | 6,69 | -0,47 | 146,73 | -18,56 | 2,1680 | -0,5493 | |||
| FSS / Federal Signal Corporation | 1,35 | -1,82 | 144,03 | 42,06 | 2,1282 | 0,5990 | |||
| SITE / SiteOne Landscape Supply, Inc. | 1,16 | -1,98 | 140,31 | -2,38 | 2,0733 | -0,0946 | |||
| MRCY / Mercury Systems, Inc. | 2,56 | 13,32 | 137,82 | 41,64 | 2,0365 | 0,5689 | |||
| AAON / AAON, Inc. | 1,86 | -1,58 | 137,11 | -7,10 | 2,0259 | -0,2000 | |||
| CCCS / CCC Intelligent Solutions Holdings Inc. | 14,52 | 16,73 | 136,64 | 21,64 | 2,0190 | 0,3248 | |||
| SPXC / SPX Technologies, Inc. | 0,80 | -0,50 | 133,34 | 29,55 | 1,9702 | 0,4179 | |||
| LMAT / LeMaitre Vascular, Inc. | 1,60 | -2,30 | 133,17 | -3,29 | 1,9678 | -0,1092 | |||
| MSA / MSA Safety Incorporated | 0,78 | -0,76 | 131,50 | 13,34 | 1,9430 | 0,1931 | |||
| DGII / Digi International Inc. | 3,55 | -0,74 | 123,71 | 24,33 | 1,8280 | 0,3272 | |||
| RGEN / Repligen Corporation | 0,98 | -0,34 | 121,51 | -2,58 | 1,7954 | -0,0858 | |||
| VERX / Vertex, Inc. | 3,40 | 15,29 | 120,08 | 16,36 | 1,7743 | 0,2178 | |||
| BL / BlackLine, Inc. | 2,08 | -1,47 | 117,75 | 15,22 | 1,7399 | 0,1985 | |||
| TREX / Trex Company, Inc. | 2,00 | -0,30 | 108,57 | -6,68 | 1,6042 | -0,1505 | |||
| BFAM / Bright Horizons Family Solutions Inc. | 0,86 | 171,03 | 106,04 | 163,67 | 1,5669 | 0,9603 | |||
| VCEL / Vericel Corporation | 2,46 | 19,50 | 104,83 | 13,96 | 1,5489 | 0,1615 | |||
| TRNS / Transcat, Inc. | 1,09 | 13,71 | 93,56 | 31,29 | 1,3825 | 0,3076 | |||
| ULS / UL Solutions Inc. | 1,17 | 64,62 | 85,19 | 112,66 | 1,2588 | 0,6546 | |||
| AGYS / Agilysys, Inc. | 0,73 | 0,17 | 83,95 | 58,30 | 1,2404 | 0,4406 | |||
| WK / Workiva Inc. | 1,17 | -0,75 | 80,11 | -10,51 | 1,1837 | -0,1664 | |||
| NCNO / nCino, Inc. | 2,67 | 23,99 | 74,68 | 26,25 | 1,1034 | 0,2113 | |||
| WDFC / WD-40 Company | 0,32 | -0,20 | 72,79 | -6,71 | 1,0756 | -0,1013 | |||
| KAI / Kadant Inc. | 0,22 | 0,38 | 70,49 | -5,42 | 1,0416 | -0,0825 | |||
| HLIO / Helios Technologies, Inc. | 1,95 | -0,87 | 65,22 | 3,09 | 0,9637 | 0,0095 | |||
| ROL / Rollins, Inc. | 1,08 | -1,87 | 61,03 | 2,47 | 0,9017 | 0,0035 | |||
| HEIA / Heico Corp. - Class A | 0,23 | -1,45 | 59,18 | 20,87 | 0,8744 | 0,1360 | |||
| AZTA / Azenta, Inc. | 1,92 | 0,15 | 59,05 | -11,01 | 0,8725 | -0,1283 | |||
| GWRE / Guidewire Software, Inc. | 0,25 | -2,86 | 58,54 | 22,07 | 0,8650 | 0,1417 | |||
| TYL / Tyler Technologies, Inc. | 0,09 | -1,41 | 55,98 | 0,53 | 0,8271 | -0,0127 | |||
| CXT / Crane NXT, Co. | 0,99 | 0,14 | 53,61 | 5,01 | 0,7921 | 0,0222 | |||
| MLAB / Mesa Laboratories, Inc. | 0,57 | -0,91 | 53,34 | -21,32 | 0,7882 | -0,2344 | |||
| HLMN / Hillman Solutions Corp. | 7,36 | -0,40 | 52,53 | -19,10 | 0,7762 | -0,2031 | |||
| WSO / Watsco, Inc. | 0,11 | 0,48 | 46,68 | -12,71 | 0,6897 | -0,1168 | |||
| GGG / Graco Inc. | 0,47 | 0,73 | 39,99 | 3,70 | 0,5909 | 0,0092 | |||
| POOL / Pool Corporation | 0,13 | -0,09 | 38,99 | -8,52 | 0,5761 | -0,0667 | |||
| JKHY / Jack Henry & Associates, Inc. | 0,20 | 0,22 | 36,32 | -1,11 | 0,5366 | -0,0173 | |||
| WST / West Pharmaceutical Services, Inc. | 0,11 | 49,86 | 23,61 | 46,46 | 0,3489 | 0,1057 | |||
| PCOR / Procore Technologies, Inc. | 0,34 | 51,35 | 23,09 | 56,85 | 0,3411 | 0,1191 | |||
| GNRC / Generac Holdings Inc. | 0,16 | -3,08 | 22,98 | 9,59 | 0,3396 | 0,0233 | |||
| PCTY / Paylocity Holding Corporation | 0,12 | 16,46 | 22,65 | 12,64 | 0,3346 | 0,0314 | |||
| SLP / Simulations Plus, Inc. | 1,28 | -50,86 | 22,37 | -65,03 | 0,3306 | -0,6344 | |||
| JBTM / JBT Marel Corporation | 0,17 | -81,98 | 20,75 | -82,26 | 0,3065 | -1,4575 | |||
| EVI / EVI Industries, Inc. | 0,83 | 2,70 | 18,20 | 33,61 | 0,2689 | 0,0634 | |||
| TECH / Bio-Techne Corporation | 0,33 | 0,84 | 17,08 | -11,51 | 0,2523 | -0,0387 | |||
| LCII / LCI Industries | 0,18 | -1,19 | 16,01 | 3,06 | 0,2366 | 0,0023 | |||
| WLDN / Willdan Group, Inc. | 0,04 | 0,00 | 2,76 | 53,54 | 0,0407 | 0,0136 | |||
| PL / Planet Labs PBC | 0,43 | 13,13 | 2,61 | 104,23 | 0,0385 | 0,0193 | |||
| UTI / Universal Technical Institute, Inc. | 0,07 | -19,03 | 2,33 | 6,88 | 0,0344 | 0,0015 | |||
| PHR / Phreesia, Inc. | 0,08 | 0,00 | 2,20 | 11,37 | 0,0326 | 0,0027 | |||
| MEG / Montrose Environmental Group, Inc. | 0,09 | 25,42 | 1,93 | 92,51 | 0,0285 | 0,0134 | |||
| IIIV / i3 Verticals, Inc. | 0,07 | 0,00 | 1,92 | 11,39 | 0,0283 | 0,0024 | |||
| MAMA / Mama's Creations, Inc. | 0,23 | 0,00 | 1,90 | 27,50 | 0,0281 | 0,0056 | |||
| TCYSF / Tecsys Inc. | 0,06 | 0,00 | 1,80 | -0,61 | 0,0267 | -0,0007 | |||
| OLO / Olo Inc. | 0,20 | -25,49 | 1,76 | 9,84 | 0,0261 | 0,0018 | |||
| NVEE / NV5 Global, Inc. | 0,07 | 0,00 | 1,71 | 19,82 | 0,0252 | 0,0037 | |||
| VRSK / Verisk Analytics, Inc. | 0,01 | -0,27 | 1,70 | 4,36 | 0,0251 | 0,0006 | |||
| PLMR / Palomar Holdings, Inc. | 0,01 | -22,47 | 1,66 | -12,80 | 0,0246 | -0,0042 | |||
| COCO / The Vita Coco Company, Inc. | 0,05 | 28,12 | 1,64 | 50,96 | 0,0243 | 0,0079 | |||
| IRMD / IRADIMED CORPORATION | 0,03 | 0,00 | 1,64 | 13,96 | 0,0243 | 0,0025 | |||
| BWMN / Bowman Consulting Group Ltd. | 0,06 | 0,00 | 1,63 | 31,72 | 0,0241 | 0,0054 | |||
| NABL / N-able, Inc. | 0,18 | 33,49 | 1,46 | 52,50 | 0,0216 | 0,0072 | |||
| ERII / Energy Recovery, Inc. | 0,11 | 25,57 | 1,44 | 0,98 | 0,0212 | -0,0002 | |||
| KIDS / OrthoPediatrics Corp. | 0,07 | 23,79 | 1,43 | 8,01 | 0,0211 | 0,0012 | |||
| BLFS / BioLife Solutions, Inc. | 0,07 | 0,00 | 1,40 | -5,66 | 0,0207 | -0,0017 | |||
| MSFT / Microsoft Corporation | 0,00 | -0,18 | 1,35 | 32,22 | 0,0199 | 0,0045 | |||
| CSGP / CoStar Group, Inc. | 0,02 | -0,03 | 1,25 | 1,47 | 0,0184 | -0,0001 | |||
| WCN / Waste Connections, Inc. | 0,01 | -0,31 | 1,21 | -4,66 | 0,0178 | -0,0013 | |||
| USPH / U.S. Physical Therapy, Inc. | 0,01 | 0,00 | 1,17 | 8,13 | 0,0173 | 0,0010 | |||
| COST / Costco Wholesale Corporation | 0,00 | -0,47 | 1,05 | 4,17 | 0,0155 | 0,0003 | |||
| TWST / Twist Bioscience Corporation | 0,03 | 1,04 | 0,0154 | 0,0154 | |||||
| THBRF / Thunderbird Entertainment Group Inc. | 0,84 | 0,00 | 1,04 | 7,98 | 0,0154 | 0,0009 | |||
| ROP / Roper Technologies, Inc. | 0,00 | -0,86 | 0,99 | -4,74 | 0,0146 | -0,0010 | |||
| SSTI / SoundThinking, Inc. | 0,08 | 0,00 | 0,98 | -23,02 | 0,0145 | -0,0047 | |||
| TKNO / Alpha Teknova, Inc. | 0,19 | 0,00 | 0,94 | -5,32 | 0,0139 | -0,0011 | |||
| CPRT / Copart, Inc. | 0,02 | 0,11 | 0,93 | -13,28 | 0,0137 | -0,0024 | |||
| IDXX / IDEXX Laboratories, Inc. | 0,00 | -0,59 | 0,90 | 27,00 | 0,0133 | 0,0026 | |||
| VEEV / Veeva Systems Inc. | 0,00 | -0,49 | 0,88 | 23,60 | 0,0130 | 0,0023 | |||
| CYRX / Cryoport, Inc. | 0,11 | 55,90 | 0,82 | 91,18 | 0,0122 | 0,0057 | |||
| SPGI / S&P Global Inc. | 0,00 | 0,00 | 0,79 | 3,68 | 0,0117 | 0,0002 | |||
| FAST / Fastenal Company | 0,02 | 99,03 | 0,78 | 7,78 | 0,0115 | 0,0006 | |||
| ANSS / ANSYS, Inc. | 0,00 | -15,56 | 0,76 | -6,26 | 0,0113 | -0,0010 | |||
| FTNT / Fortinet, Inc. | 0,01 | -30,08 | 0,76 | -23,20 | 0,0112 | -0,0037 | |||
| IT / Gartner, Inc. | 0,00 | -0,27 | 0,74 | -3,89 | 0,0110 | -0,0007 | |||
| TSCO / Tractor Supply Company | 0,01 | 0,34 | 0,69 | -3,88 | 0,0102 | -0,0006 | |||
| XYL / Xylem Inc. | 0,00 | 1,05 | 0,62 | 9,47 | 0,0092 | 0,0006 | |||
| INTU / Intuit Inc. | 0,00 | -0,64 | 0,61 | 27,62 | 0,0090 | 0,0018 | |||
| STE / STERIS plc | 0,00 | -0,20 | 0,61 | 5,76 | 0,0090 | 0,0003 | |||
| MA / Mastercard Incorporated | 0,00 | 0,00 | 0,59 | 2,42 | 0,0088 | 0,0000 | |||
| BRK.B / Berkshire Hathaway Inc. | 0,00 | 0,00 | 0,57 | -8,76 | 0,0085 | -0,0010 | |||
| GOOGL / Alphabet Inc. | 0,00 | -0,34 | 0,52 | 13,48 | 0,0077 | 0,0008 | |||
| FICO / Fair Isaac Corporation | 0,00 | -93,09 | 0,49 | -93,15 | 0,0072 | -0,1002 | |||
| LIN / Linde plc | 0,00 | -1,46 | 0,47 | -0,84 | 0,0070 | -0,0002 | |||
| BSY / Bentley Systems, Incorporated | 0,01 | 0,12 | 0,45 | 37,69 | 0,0067 | 0,0017 | |||
| FDS / FactSet Research Systems Inc. | 0,00 | -35,84 | 0,41 | -36,91 | 0,0061 | -0,0038 | |||
| GOOG / Alphabet Inc. | 0,00 | -0,45 | 0,39 | 13,04 | 0,0058 | 0,0006 | |||
| AXON / Axon Enterprise, Inc. | 0,00 | -98,53 | 0,37 | -97,69 | 0,0054 | -0,2353 | |||
| ODFL / Old Dominion Freight Line, Inc. | 0,00 | 41,13 | 0,35 | 38,43 | 0,0052 | 0,0014 | |||
| NET / Cloudflare, Inc. | 0,00 | 0,34 | 0,0050 | 0,0050 | |||||
| JNJ / Johnson & Johnson | 0,00 | 0,00 | 0,31 | -7,81 | 0,0045 | -0,0005 | |||
| MKL / Markel Group Inc. | 0,00 | 0,00 | 0,29 | 6,64 | 0,0043 | 0,0002 | |||
| AAPL / Apple Inc. | 0,00 | 0,00 | 0,28 | -7,52 | 0,0042 | -0,0004 | |||
| XOM / Exxon Mobil Corporation | 0,00 | 0,00 | 0,26 | -9,28 | 0,0039 | -0,0005 | |||
| GRMN / Garmin Ltd. | 0,00 | 0,00 | 0,25 | -3,79 | 0,0038 | -0,0002 | |||
| HD / The Home Depot, Inc. | 0,00 | 0,00 | 0,24 | 0,00 | 0,0035 | -0,0001 | |||
| NVDA / NVIDIA Corporation | 0,00 | 0,24 | 0,0035 | 0,0035 | |||||
| ITW / Illinois Tool Works Inc. | 0,00 | 0,00 | 0,22 | -0,44 | 0,0033 | -0,0001 | |||
| DHR / Danaher Corporation | 0,00 | 0,00 | 0,20 | -3,79 | 0,0030 | -0,0002 | |||
| SJM / The J. M. Smucker Company | 0,00 | -100,00 | 0,00 | 0,0000 | |||||
| NEOG / Neogen Corporation | 0,00 | -100,00 | 0,00 | 0,0000 | |||||
| PYCR / Paycor HCM, Inc. | 0,00 | -100,00 | 0,00 | 0,0000 | |||||
| MTD / Mettler-Toledo International Inc. | 0,00 | -100,00 | 0,00 | 0,0000 |