Grundlæggende statistik
| Institutionelle aktier (lange) | 175.921.220 - 51,83% (ex 13D/G) - change of 10,96MM shares 6,64% MRQ |
| Institutionel værdi (lang) | $ 1.944.221 USD ($1000) |
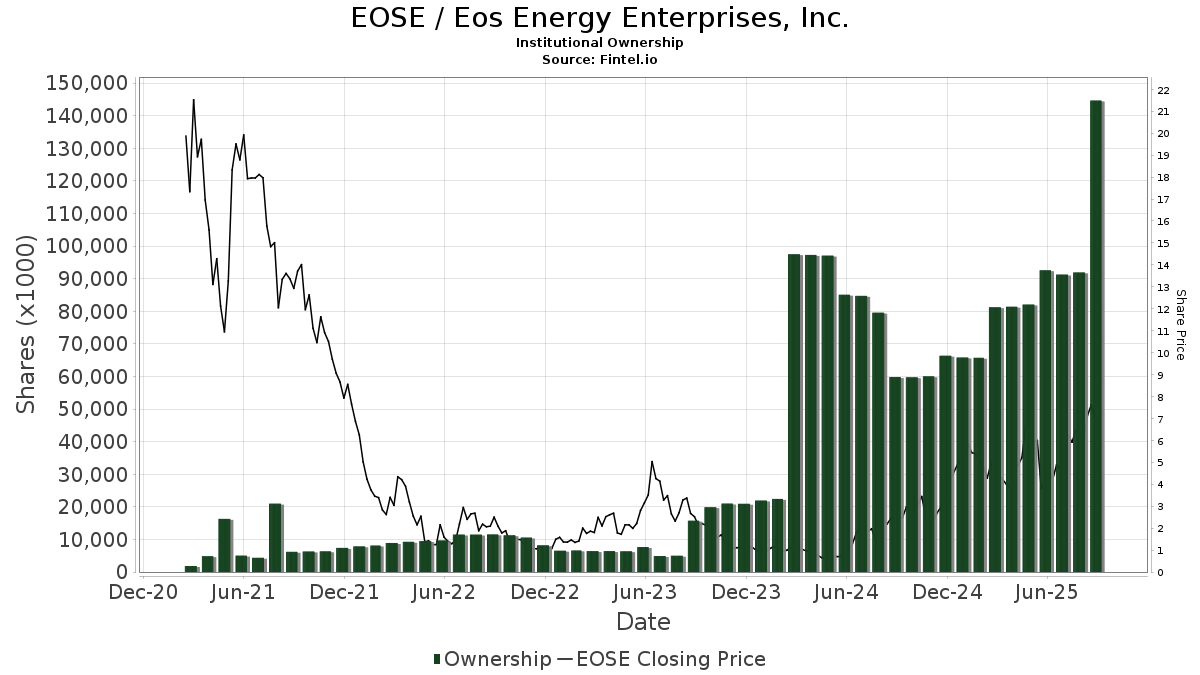
Institutionelt ejerskab og aktionærer
Eos Energy Enterprises, Inc. (US:EOSE) har 370 institutionelle ejere og aktionærer, der har indsendt 13D/G- eller 13F-formularer til Securities Exchange Commission (SEC). Disse institutioner har i alt 175,922,498 aktier. Største aktionærer omfatter BlackRock, Inc., Vanguard Group Inc, Driehaus Capital Management Llc, Citadel Advisors Llc, Susquehanna International Group, Llp, State Street Corp, Geode Capital Management, Llc, Susquehanna International Group, Llp, Jane Street Group, Llc, and Susquehanna International Group, Llp .
Eos Energy Enterprises, Inc. (NasdaqCM:EOSE) institutionel ejerskabsstruktur viser aktuelle positioner i virksomheden efter institutioner og fonde, samt seneste ændringer i positionsstørrelse. Større aktionærer kan omfatte individuelle investorer, investeringsforeninger, hedgefonde eller institutioner. Skema 13D angiver, at investoren besidder (eller besidder) mere end 5 % af virksomheden og har til hensigt (eller har til hensigt at) aktivt at forfølge en ændring i forretningsstrategi. Skema 13G indikerer en passiv investering på over 5%.
The share price as of March 19, 2026 is 5,52 / share. Previously, on March 20, 2025, the share price was 4,26 / share. This represents an increase of 29,58% over that period.
Fondens stemningsscore
Fund Sentiment Score (fka Ownership Accumulation Score) finder de aktier, der bliver mest købt af fonde. Det er resultatet af en sofistikeret, multi-faktor kvantitativ model, der identificerer virksomheder med de højeste niveauer af institutionel akkumulering. Scoringsmodellen bruger en kombination af den samlede stigning i oplyste ejere, ændringerne i porteføljeallokeringer i disse ejere og andre målinger. Tallet går fra 0 til 100, hvor højere tal indikerer et højere niveau af akkumulering for sine jævnaldrende, og 50 er gennemsnittet.
Opdateringsfrekvens: Dagligt
Se Ownership Explorer, som giver en liste over højest rangerende virksomheder.
AI+ Ask Fintel’s AI assistant about Eos Energy Enterprises, Inc..
Select a question to share a public post with an AI-crafted answer.
Thinking of good questions…
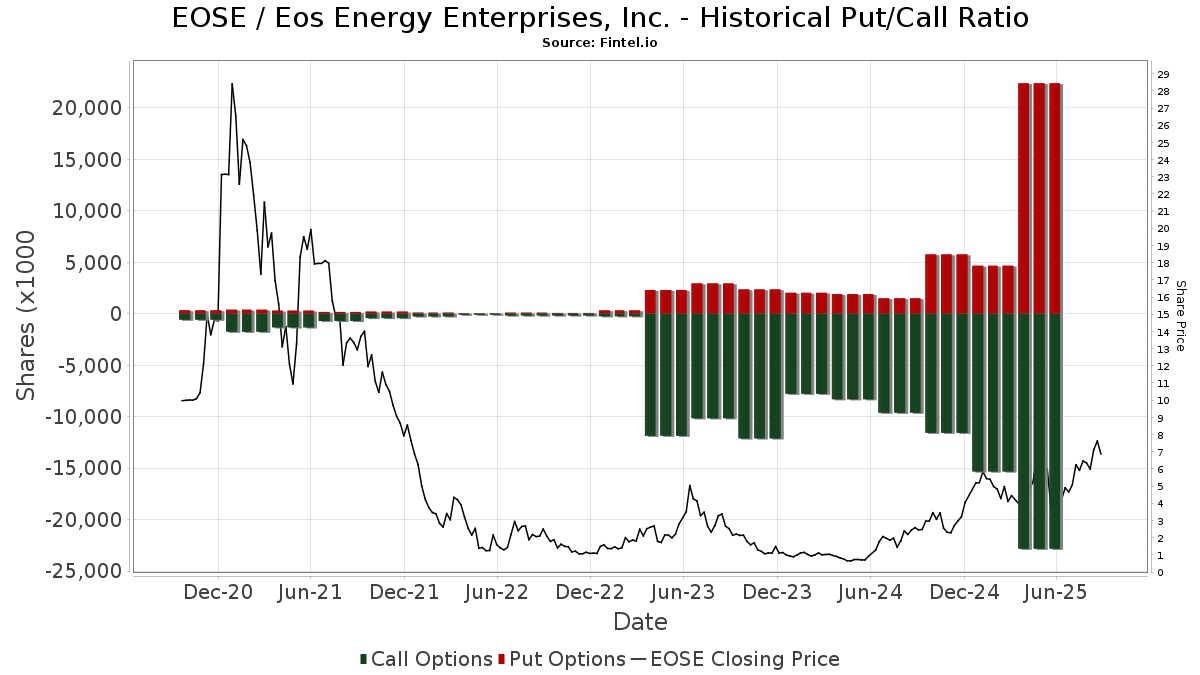
Institutionel Put/Call-forhold
Ud over at indberette standardaktie- og gældsudstedelser skal institutter med mere end 100 mill. aktiver under forvaltning også oplyse deres put- og call-optionsbeholdninger. Da salgsoptioner generelt indikerer negativ stemning, og købsoptioner indikerer positiv stemning, kan vi få en fornemmelse af den overordnede institutionelle stemning ved at plotte forholdet mellem put og kald. Diagrammet til højre viser det historiske put/call-forhold for dette instrument.
Brug af Put/Call Ratio som en indikator for investorernes stemning overvinder en af de vigtigste mangler ved at bruge totalt institutionelt ejerskab, som er, at en betydelig mængde af aktiver under forvaltning investeres passivt for at spore indekser. Passivt forvaltede fonde køber typisk ikke optioner, så indikatoren for put/call-forholdet følger mere nøje følelsen af aktivt forvaltede fonde.
13D/G-arkivering
Vi præsenterer 13D/G ansøgninger separat fra 13F ansøgninger på grund af den forskellige behandling af SEC. 13D/G-ansøgninger kan indgives af grupper af investorer (med én ledende), hvorimod 13F-ansøgninger ikke kan. Dette resulterer i situationer, hvor en investor kan indsende en 13D/G, der rapporterer én værdi for de samlede aktier (der repræsenterer alle de aktier, der ejes af investorgruppen), men derefter indsender en 13F, der rapporterer en anden værdi for de samlede aktier (der udelukkende repræsenterer deres egne) ejendomsret). Det betyder, at aktieejerskab af 13D/G-arkiver og 13F-arkiveringer ofte ikke er direkte sammenlignelige, så vi præsenterer dem separat.
Bemærk: Fra den 16. maj 2021 viser vi ikke længere ejere, der ikke har indsendt en 13D/G inden for det seneste år. Tidligere viste vi den fulde historie af 13D/G-arkiver. Generelt skal enheder, der er forpligtet til at indgive 13D/G-ansøgninger, indgive mindst årligt, før de indsender en afsluttende ansøgning. Dog forlader fonde nogle gange positioner uden at indsende en afsluttende ansøgning (dvs. de afvikler), så visning af den fulde historie resulterede nogle gange i forvirring om det nuværende ejerskab. For at undgå forvirring viser vi nu kun 'aktuelle' ejere - det vil sige - ejere, der har anmeldt inden for det seneste år.
Upgrade to unlock premium data.
| Fil dato | Form | Investor | Forrige Aktier |
Seneste Aktier |
Δ Aktier (Procent) |
Ejendomsret (Procent) |
Δ Ejerskab (Procent) |
|
|---|---|---|---|---|---|---|---|---|
| 2026-02-13 | SUSQUEHANNA SECURITIES, LLC | 15,168,902 | 14,340,893 | -5.46 | 4.50 | -22.41 | ||
| 2025-07-29 | VANGUARD GROUP INC | 13,318,787 | 5.40 | |||||
| 2025-07-17 | BlackRock, Inc. | 16,043,211 | 6.50 | |||||
| 2025-07-08 | Legal & General Investment Management Ltd | 0 | 2,899,961 | 5.40 | ||||
| 2025-03-17 | Cerberus Capital Management II, L.P. | 158,433,112 | 158,433,112 | 0.00 | 41.20 | -0.48 |
13F og NPORT arkivering
Detaljer om 13F-arkivering er gratis. Detaljer om NP-ansøgninger kræver et premium-medlemskab. Grønne rækker angiver nye positioner. Røde rækker angiver lukkede positioner. Klik på linket ikon for at se den fulde transaktionshistorik.
Opgrader
for at låse premium-data op og eksportere til Excel ![]() .
.
| Fil dato | Kilde | Investor | Type | Gennemsnitlig pris (Øst) |
Aktier | Δ Aktier (%) |
Rapporteret Værdi ($1000) |
Δ Værdi (%) |
Port Alloc (%) |
|
|---|---|---|---|---|---|---|---|---|---|---|
| 2026-01-16 | 13F | FNY Investment Advisers, LLC | 3.857 | 27.450,00 | 0 | |||||
| 2026-01-29 | 13F | UMA Financial Services, Inc. | 38 | 0 | ||||||
| 2026-01-09 | 13F | SG Americas Securities, LLC | 8.835 | -14,54 | 0 | |||||
| 2026-02-13 | 13F | Quarry LP | 0 | -100,00 | 0 | |||||
| 2025-11-03 | 13F | J. Safra Sarasin Holding AG | 0 | -100,00 | 0 | -100,00 | ||||
| 2026-02-18 | 13F | Mackenzie Financial Corp | 18.166 | 29,76 | 206 | 28,93 | ||||
| 2026-02-17 | 13F | SummitTX Capital, L.P. | 77.256 | 885 | ||||||
| 2026-02-17 | 13F | Nomura Holdings Inc | Call | 0 | -100,00 | 0 | ||||
| 2026-02-26 | 13F | Anchor Investment Management, LLC | 450 | 350,00 | 5 | 400,00 | ||||
| 2025-11-12 | 13F | Barclays Plc | Put | 0 | -100,00 | 0 | -100,00 | |||
| 2026-01-15 | 13F | Nisa Investment Advisors, Llc | 2.872 | 8,21 | 33 | 6,67 | ||||
| 2026-01-29 | 13F | Concurrent Investment Advisors, LLC | 30.098 | 345 | ||||||
| 2026-02-13 | 13F | Verition Fund Management LLC | 434.418 | -40,98 | 4.978 | -40,62 | ||||
| 2026-01-29 | 13F | Pictet Asset Management Holding SA | 48.553 | 17,08 | 556 | 17,80 | ||||
| 2026-02-13 | 13F | Toroso Investments, LLC | 175.080 | 316,29 | 2.006 | 318,79 | ||||
| 2026-02-17 | 13F | Polymer Capital Management (US) LLC | 0 | -100,00 | 0 | |||||
| 2026-01-30 | 13F | Wealthfront Advisers Llc | 31.047 | 76,29 | 356 | 77,50 | ||||
| 2026-02-13 | 13F | Verition Fund Management LLC | Call | 15.000 | -85,00 | 172 | -84,99 | |||
| 2026-02-13 | 13F | Neuberger Berman Group LLC | 15.846 | 2,82 | 182 | 3,43 | ||||
| 2025-11-14 | 13F | Sassicaia Capital Advisers Llc | 0 | -100,00 | 0 | |||||
| 2026-01-16 | 13F | Perigon Wealth Management, LLC | 19.300 | 221 | ||||||
| 2026-02-17 | 13F | Advisor Group Holdings, Inc. | 123.543 | 31,09 | 1.416 | 49,42 | ||||
| 2026-02-06 | 13F | FourThought Financial Partners, LLC | 179.588 | -5,11 | 2.058 | -4,50 | ||||
| 2026-02-13 | 13F | Squarepoint Ops LLC | Put | 141.400 | 237,47 | 1.620 | 239,62 | |||
| 2026-02-13 | 13F | State Street Corp | 7.689.841 | 6,12 | 88.126 | 6,78 | ||||
| 2026-02-13 | 13F | Squarepoint Ops LLC | Call | 176.800 | -9,43 | 2.026 | -8,86 | |||
| 2026-02-12 | 13F | Steward Partners Investment Advisory, Llc | 3.705 | -40,93 | 42 | -40,85 | ||||
| 2026-02-17 | 13F | Paloma Partners Management Co | 0 | -100,00 | 0 | |||||
| 2026-02-17 | 13F | Tudor Investment Corp Et Al | Put | 233.200 | 2.672 | |||||
| 2025-09-29 | NP | KCXIX - Knights of Columbus U.S. All Cap Index Fund I Shares | 990 | 11,74 | 6 | 25,00 | ||||
| 2026-02-03 | 13F | International Assets Investment Management, Llc | 10.800 | 124 | ||||||
| 2026-02-06 | 13F | Handelsbanken Fonder AB | 100.800 | 1 | ||||||
| 2026-02-17 | 13F | Tudor Investment Corp Et Al | 144.619 | -87,11 | 1.657 | -87,03 | ||||
| 2026-02-11 | 13F | Winton Capital Group Ltd | 76.671 | 879 | ||||||
| 2025-09-23 | NP | GSAOX - Goldman Sachs Small Cap Growth Insights Fund Class A | 12.226 | 70 | ||||||
| 2026-02-17 | 13F | Price T Rowe Associates Inc /md/ | 979.739 | -56,41 | 11 | -56,00 | ||||
| 2026-01-30 | 13F | Us Bancorp \de\ | 3.863 | 444,85 | 44 | 450,00 | ||||
| 2026-02-17 | 13F | Tudor Investment Corp Et Al | Call | 623.200 | 512,78 | 7.142 | 516,67 | |||
| 2026-02-12 | 13F | Ensign Peak Advisors, Inc | 24.150 | -54,82 | 277 | -54,61 | ||||
| 2026-02-17 | 13F | Numerai GP LLC | 29.265 | 5,18 | 335 | 6,01 | ||||
| 2026-02-17 | 13F | Creative Planning | 46.024 | 178,58 | 527 | 180,32 | ||||
| 2025-09-25 | NP | ISCB - iShares Morningstar Small-Cap ETF | 10.469 | 0,70 | 60 | 9,26 | ||||
| 2026-02-04 | 13F | Virginia Retirement Systems Et Al | 14.900 | 171 | ||||||
| 2026-02-17 | 13F | Parallax Volatility Advisers, L.P. | Put | 0 | -100,00 | 0 | -100,00 | |||
| 2026-02-17 | 13F | Interval Partners, LP | 33.244 | 381 | ||||||
| 2026-02-17 | 13F | Parallax Volatility Advisers, L.P. | 0 | -100,00 | 0 | |||||
| 2026-01-14 | 13F | ORG Partners LLC | 2.130 | 89,33 | 24 | 100,00 | ||||
| 2026-02-23 | 13F | Virtu Financial LLC | 118.200 | -27,22 | 1 | 0,00 | ||||
| 2026-02-06 | 13F | Mach-1 Financial Group, Inc. | 0 | -100,00 | 0 | -100,00 | ||||
| 2025-09-26 | NP | PBD - Invesco Global Clean Energy ETF This fund is a listed as child fund of Invesco Ltd. and if that institution has disclosed ownership in this security, then these positions will not be double counted when calculating total shares and total value | 88.549 | -27,17 | 505 | -20,50 | ||||
| 2026-01-14 | 13F | WESPAC Advisors, LLC | 16.978 | 30,82 | 195 | 31,97 | ||||
| 2025-11-14 | 13F | Black Maple Capital Management LP | 0 | -100,00 | 0 | -100,00 | ||||
| 2025-11-14 | 13F | Black Maple Capital Management LP | Call | 0 | -100,00 | 0 | -100,00 | |||
| 2026-02-12 | 13F | Polen Capital Management Llc | 21.080 | 0,00 | 242 | 0,42 | ||||
| 2026-02-13 | 13F | Atika Capital Management LLC | Call | 3.720 | 4.263 | |||||
| 2026-02-17 | 13F | Clearline Capital LP | 156.811 | 1.797 | ||||||
| 2026-02-06 | 13F | Gsa Capital Partners Llp | 71.439 | 158,56 | 1 | |||||
| 2026-02-13 | 13F | Squarepoint Ops LLC | 0 | -100,00 | 0 | -100,00 | ||||
| 2026-01-29 | 13F | UBS Group AG | Call | 13.500 | 155 | |||||
| 2026-01-29 | 13F | UBS Group AG | 847.826 | -74,14 | 9.716 | -73,98 | ||||
| 2026-02-13 | 13F | Stifel Financial Corp | 4.235.823 | -8,40 | 48.543 | -7,84 | ||||
| 2026-02-13 | 13F | Williams Jones Wealth Management, LLC. | 49.980 | -39,42 | 573 | -39,08 | ||||
| 2026-02-13 | 13F | Public Employees Retirement Association Of Colorado | 32.060 | 0 | ||||||
| 2026-02-11 | 13F | Los Angeles Capital Management Llc | 8.205 | 117 | ||||||
| 2026-02-02 | 13F | CENTRAL TRUST Co | 1.628 | 0,00 | 19 | 0,00 | ||||
| 2026-02-11 | 13F | Mirae Asset Securities (usa) Inc. | 0 | -100,00 | 0 | -100,00 | ||||
| 2026-02-27 | 13F | Strategic Investment Solutions, Inc. /IL | 1.940 | 25,97 | 22 | 29,41 | ||||
| 2026-02-11 | 13F | Mirae Asset Securities (usa) Inc. | Put | 0 | -100,00 | 0 | -100,00 | |||
| 2026-02-13 | 13F | Brown Advisory Inc | 20.000 | -66,61 | 229 | -66,42 | ||||
| 2026-02-13 | 13F | Alyeska Investment Group, L.P. | 0 | -100,00 | 0 | -100,00 | ||||
| 2026-02-04 | 13F | MONECO Advisors, LLC | 13.300 | -0,19 | 152 | 0,66 | ||||
| 2026-02-17 | 13F | Quadrature Capital Ltd | 0 | -100,00 | 0 | |||||
| 2026-01-16 | 13F | Ledgewood Wealth Advisors, LLC | 15.000 | 0,00 | 172 | 0,59 | ||||
| 2026-01-20 | 13F | Signaturefd, Llc | 130 | -74,00 | 1 | -80,00 | ||||
| 2025-10-28 | 13F | Copperleaf Capital, LLC | 320.200 | 0,00 | 3.647 | 122,51 | ||||
| 2026-02-12 | 13F | Rossby Financial, LCC | 50 | 0,00 | 1 | |||||
| 2026-02-17 | 13F | Aqr Capital Management Llc | 45.108 | -11,66 | 517 | -11,19 | ||||
| 2026-02-10 | 13F | Zweig-DiMenna Associates LLC | 993.988 | -2,65 | 11.391 | -2,05 | ||||
| 2026-02-12 | 13F | Federation des caisses Desjardins du Quebec | 4.185 | 3,98 | 48 | 4,44 | ||||
| 2026-02-17 | 13F | Amundi | 10.101 | 116 | ||||||
| 2026-02-13 | 13F | Cornerstone Financial Management LLC | 211 | 2 | ||||||
| 2026-02-03 | 13F | Mitsubishi UFJ Kokusai Asset Management Co., Ltd. | 44.104 | -32,06 | 572 | -22,60 | ||||
| 2026-02-13 | 13F | Sterling Capital Management LLC | 2.017 | 226,90 | 23 | 228,57 | ||||
| 2026-02-14 | 13F | Berkshire Asset Management Llc/pa | 0 | -100,00 | 0 | |||||
| 2026-02-17 | 13F | Point72 Asset Management, L.P. | Put | 151.600 | 211,29 | 1.737 | 213,54 | |||
| 2026-02-11 | 13F | Group One Trading, L.p. | 1.256.795 | -9,96 | 14.403 | -9,40 | ||||
| 2026-02-17 | 13F | Point72 Asset Management, L.P. | Call | 597.100 | 2.288,40 | 6.843 | 2.309,15 | |||
| 2026-02-17 | 13F | Point72 Asset Management, L.P. | 238.594 | -67,28 | 2.734 | -67,08 | ||||
| 2025-11-12 | 13F | Accredited Wealth Management, LLC | 29 | -94,20 | 6 | 150,00 | ||||
| 2026-02-12 | 13F | New York State Common Retirement Fund | 92.700 | 14,44 | 1.062 | 15,18 | ||||
| 2026-01-30 | 13F | Delta Investment Management, LLC | 93.764 | 1.075 | ||||||
| 2026-02-13 | 13F | Towarzystwo Funduszy Inwestycyjnych Pzu Sa | 2.700 | 58,82 | 31 | 57,89 | ||||
| 2026-02-10 | 13F | IFG Advisory, LLC | 12.100 | 139 | ||||||
| 2026-02-17 | 13F | Northern Trust Corp | 2.359.506 | 12,42 | 27.040 | 13,11 | ||||
| 2026-01-29 | 13F | Vanguard Group Inc | 18.616.874 | 19,82 | 213.349 | 20,56 | ||||
| 2026-02-13 | 13F | Y-Intercept (Hong Kong) Ltd | 0 | -100,00 | 0 | |||||
| 2026-02-17 | 13F | Caption Management, LLC | Put | 2.079.300 | 13,43 | 23.829 | 14,12 | |||
| 2026-02-17 | 13F | Caption Management, LLC | Call | 5.188.400 | 40,97 | 59.459 | 41,84 | |||
| 2026-02-10 | 13F | CIBC World Markets Inc. | 10.500 | 120 | ||||||
| 2026-02-13 | 13F | FORA Capital, LLC | 29.060 | 511 | ||||||
| 2026-02-17 | 13F | Caption Management, LLC | 914.727 | 47,37 | 10.483 | 48,26 | ||||
| 2026-03-06 | 13F | Hsbc Holdings Plc | 98.064 | -24,26 | 1.124 | -23,81 | ||||
| 2026-02-13 | 13F | Change Path, LLC | 11.000 | 126 | ||||||
| 2026-02-17 | 13F | Strive Financial Group ,LLC | 575 | 7 | ||||||
| 2026-02-02 | 13F | KPP Advisory Services LLC | 14.185 | 163 | ||||||
| 2026-02-12 | 13F | EAM Investors, LLC | 117.425 | 1.346 | ||||||
| 2025-09-26 | NP | SLPIX - Small-cap Profund Investor Class | 200 | 1 | ||||||
| 2026-02-12 | 13F | CoreCommodity Management, LLC | 161.649 | -23,62 | 1.852 | -23,15 | ||||
| 2025-10-17 | 13F | Zazove Associates Llc | 0 | -100,00 | 0 | -100,00 | ||||
| 2026-02-12 | 13F | Brinker Capital Investments, LLC | 64.143 | 735 | ||||||
| 2026-01-28 | 13F | Universal- Beteiligungs- und Servicegesellschaft mbH | 845.314 | 2.431,49 | 9.687 | 2.449,21 | ||||
| 2026-01-26 | 13F | KBC Group NV | 10.014 | 0,00 | 0 | |||||
| 2026-02-13 | 13F | Sei Investments Co | 44.054 | 86,42 | 505 | 87,36 | ||||
| 2026-02-17 | 13F | XTX Topco Ltd | 0 | -100,00 | 0 | |||||
| 2026-02-13 | 13F | Peak6 Llc | Call | 352.800 | -86,46 | 4.043 | -86,37 | |||
| 2026-02-06 | 13F | Harvest Portfolios Group Inc. | 49.461 | -4,68 | 567 | -4,23 | ||||
| 2026-02-17 | 13F | Scientech Research LLC | 0 | -100,00 | 0 | |||||
| 2025-11-12 | 13F | Aster Capital Management (DIFC) Ltd | 0 | -100,00 | 0 | -100,00 | ||||
| 2025-09-26 | NP | FSSNX - Fidelity Small Cap Index Fund This fund is a listed as child fund of Fmr Llc and if that institution has disclosed ownership in this security, then these positions will not be double counted when calculating total shares and total value | 2.235.905 | 12.745 | ||||||
| 2026-02-12 | 13F | Jane Street Group, Llc | 1.921.948 | 163,14 | 22.026 | 164,76 | ||||
| 2026-02-12 | 13F | Counterpoint Mutual Funds LLC | 254.192 | 464,19 | 2.913 | 467,84 | ||||
| 2026-02-10 | 13F | Goldman Sachs Group Inc | 1.210.636 | -57,12 | 13.874 | -56,86 | ||||
| 2026-02-13 | 13F | Rubric Capital Management LP | 6.500.000 | -36,89 | 74.490 | -36,51 | ||||
| 2026-01-22 | 13F | Fiduciary Planning LLC | 137.044 | 13,92 | 1.571 | 14,60 | ||||
| 2026-02-18 | 13F | Beacon Pointe Advisors, LLC | 97.862 | 49,41 | 1.121 | 50,27 | ||||
| 2026-01-23 | 13F | Farther Finance Advisors, LLC | 3.896 | 17,17 | 45 | 18,92 | ||||
| 2026-02-06 | 13F | Vestmark Advisory Solutions, Inc. | 118.831 | 1.362 | ||||||
| 2026-02-13 | 13F | Rhumbline Advisers | 362.255 | 1,89 | 4.151 | 2,52 | ||||
| 2026-02-13 | 13F | Ubs Asset Management Americas Inc | 570.139 | 16,56 | 6.534 | 17,27 | ||||
| 2026-01-20 | 13F/A | Miller Wealth Advisors, Llc | 170 | 2 | ||||||
| 2025-11-13 | 13F | Powell Investment Advisors, LLC | 0 | -100,00 | 0 | |||||
| 2026-02-09 | 13F | Legal & General Group Plc | 1.071.635 | -52,75 | 12.281 | -52,47 | ||||
| 2026-02-17 | 13F | Nissay Asset Management Corp /japan/ /adv | 168.720 | 154,23 | 1.932 | 155,76 | ||||
| 2026-02-04 | 13F | Ameritas Advisory Services, LLC | 0 | -100,00 | 0 | -100,00 | ||||
| 2026-02-17 | 13F | Millennium Management Llc | Put | 600.000 | 6.876 | |||||
| 2026-01-14 | 13F | Jfs Wealth Advisors, Llc | 66 | 1 | ||||||
| 2026-02-17 | 13F | Millennium Management Llc | Call | 50.000 | -73,68 | 573 | -73,52 | |||
| 2026-02-17 | 13F | Millennium Management Llc | 1.243.136 | 126,81 | 14.246 | 128,23 | ||||
| 2026-01-12 | 13F | Kempner Capital Management Inc. | 102.500 | -41,43 | 1.397 | -29,90 | ||||
| 2025-09-29 | NP | ZAP - Global X U.S. Electrification ETF | 32.465 | 33,45 | 185 | 46,83 | ||||
| 2026-02-13 | 13F | MAI Capital Management | 7.415 | 517,92 | 85 | 546,15 | ||||
| 2026-01-26 | 13F | Shelton Wealth Management, Llc | 24.328 | 16,53 | 279 | 17,30 | ||||
| 2026-02-10 | 13F | Goldman Sachs Group Inc | Put | 156.500 | -37,40 | 1.793 | -37,02 | |||
| 2026-02-17 | 13F | Fmr Llc | 1.675.135 | 772,15 | 19.197 | 777,78 | ||||
| 2026-02-17 | 13F | Boothbay Fund Management, Llc | 87.086 | 30,49 | 998 | 31,32 | ||||
| 2026-02-12 | 13F | Jane Street Group, Llc | Put | 3.145.300 | 70,38 | 36.045 | 71,44 | |||
| 2026-01-26 | 13F | Shelton Wealth Management, Llc | Call | 1.000 | -80,00 | 11 | -80,36 | |||
| 2026-02-12 | 13F | Jane Street Group, Llc | Call | 6.634.600 | 82,19 | 76.033 | 83,31 | |||
| 2026-02-17 | 13F | Aquatic Capital Management LLC | 0 | -100,00 | 0 | |||||
| 2025-09-25 | NP | TILT - FlexShares Morningstar US Market Factor Tilt Index Fund | 2.156 | -1,91 | 12 | 9,09 | ||||
| 2025-09-24 | NP | SWSSX - Schwab Small-Cap Index Fund This fund is a listed as child fund of Charles Schwab Investment Management Inc and if that institution has disclosed ownership in this security, then these positions will not be double counted when calculating total shares and total value | 566.820 | 3.231 | ||||||
| 2026-02-06 | 13F | HighTower Advisors, LLC | 29.469 | 0,11 | 338 | 0,60 | ||||
| 2026-02-17 | 13F | Wiley Bros.-aintree Capital, Llc | 429.227 | -6,49 | 4.919 | -5,93 | ||||
| 2026-02-17 | 13F | VARCOV Co. | 23.171 | 266 | ||||||
| 2026-02-13 | 13F | Brightline Capital Management, Llc | 0 | -100,00 | 0 | -100,00 | ||||
| 2026-02-10 | 13F | Lido Advisors, LLC | 241.092 | 0,00 | 2.746 | 0,00 | ||||
| 2026-02-10 | 13F | Lido Advisors, LLC | Call | 10.000 | 0,00 | 115 | 0,88 | |||
| 2026-02-17 | 13F | Dark Forest Capital Management Lp | 97.555 | 297,18 | 1.118 | 300,36 | ||||
| 2026-02-17 | 13F | Royal Bank Of Canada | 851.593 | -15,81 | 9.760 | -15,29 | ||||
| 2026-02-12 | 13F | MetLife Investment Management, LLC | 170.662 | 14,42 | 1.956 | 15,14 | ||||
| 2026-01-12 | 13F | Lauer Wealth, LLC | Call | 128.400 | -7,76 | 1.119 | -36,31 | |||
| 2026-02-10 | 13F | Skaana Management L.P. | Call | 0 | -100,00 | 0 | -100,00 | |||
| 2026-01-12 | 13F | Lauer Wealth, LLC | 320.110 | -1,94 | 4.488 | -24,80 | ||||
| 2025-11-14 | 13F | Sig Brokerage, Lp | 0 | -100,00 | 0 | |||||
| 2026-01-21 | 13F | Heritage Oak Wealth Advisors Llc | 0 | -100,00 | 0 | |||||
| 2026-01-27 | 13F | Zurcher Kantonalbank (Zurich Cantonalbank) | 70.511 | 11,74 | 808 | 12,53 | ||||
| 2026-01-30 | 13F | State of New Jersey Common Pension Fund D | 160.004 | 1.834 | ||||||
| 2026-02-13 | 13F | Ostrum Asset Management | 54.410 | 624 | ||||||
| 2026-02-13 | 13F | Headlands Technologies LLC | 123.155 | 1.411 | ||||||
| 2025-09-26 | NP | UAPIX - Ultrasmall-cap Profund Investor Class | 2.465 | 14 | ||||||
| 2026-01-15 | 13F | Victory Financial Group, Llc | 18.228 | 209 | ||||||
| 2026-02-17 | 13F | Captrust Financial Advisors | 41.237 | 473 | ||||||
| 2026-02-10 | 13F | Skaana Management L.P. | Put | 922.100 | -16,77 | 10.567 | -16,25 | |||
| 2026-02-13 | 13F | SRS Capital Advisors, Inc. | 26 | -72,63 | 0 | -100,00 | ||||
| 2026-01-05 | 13F | Park Avenue Securities Llc | 375.870 | 4 | ||||||
| 2026-02-10 | 13F | Skaana Management L.P. | 46.546 | -89,23 | 533 | -89,17 | ||||
| 2026-02-10 | 13F | Axq Capital, Lp | 28.454 | 326 | ||||||
| 2026-02-02 | 13F | Truist Financial Corp | 12.577 | 144 | ||||||
| 2026-01-08 | 13F | Financial Management Network Inc | 18.075 | 0,42 | 234 | -6,02 | ||||
| 2026-02-17 | 13F | Jump Financial, LLC | 1.102.546 | 12.635 | ||||||
| 2026-01-14 | 13F | Embree Financial Group | 12.000 | 20,00 | 138 | 21,24 | ||||
| 2026-01-14 | 13F | Embree Financial Group | Call | 7.600 | 33,33 | 87 | 35,94 | |||
| 2026-01-15 | 13F | Allspring Global Investments Holdings, LLC | 14.554 | -8,11 | 189 | 184,85 | ||||
| 2026-02-06 | 13F | Jag Capital Management, Llc | Call | 4.500 | 52 | |||||
| 2026-02-10 | 13F/A | Northwestern Mutual Wealth Management Co | 3.481 | -15,65 | 40 | -17,02 | ||||
| 2025-09-24 | NP | Innovator ETFs Trust - Innovator U.S. Small Cap Managed Floor ETF | 1.814 | 6,21 | 10 | 25,00 | ||||
| 2026-02-06 | 13F | Jag Capital Management, Llc | 88.825 | 2,45 | 1.018 | 3,04 | ||||
| 2026-02-02 | 13F | Danske Bank A/s | 2.900 | 33 | ||||||
| 2026-02-11 | 13F | Parallel Advisors, LLC | 6.170 | -3,34 | 71 | -2,78 | ||||
| 2026-02-10 | 13F | Rothschild Investment Llc | 445 | 0,00 | 5 | 0,00 | ||||
| 2026-01-12 | 13F | Rialto Wealth Management, LLC | 7 | 0 | ||||||
| 2026-01-21 | 13F | SJS Investment Consulting Inc. | 155 | -28,90 | 2 | -50,00 | ||||
| 2026-02-17 | 13F | Trexquant Investment LP | 0 | -100,00 | 0 | |||||
| 2026-02-12 | 13F | Bank Of Montreal /can/ | Call | 65.100 | 746 | |||||
| 2026-02-18 | 13F | Vident Advisory, LLC | 21.874 | -52,06 | 251 | -51,83 | ||||
| 2026-02-09 | 13F | Quest Partners LLC | 41.800 | 1,39 | 479 | 2,13 | ||||
| 2026-02-12 | 13F | Bank Of Montreal /can/ | Put | 400.000 | 0,00 | 4.584 | 0,61 | |||
| 2026-02-12 | 13F | Bank Of Montreal /can/ | 389.717 | -2,72 | 4.466 | -2,13 | ||||
| 2026-02-11 | 13F | LPL Financial LLC | 505.873 | 5,25 | 5.797 | 5,90 | ||||
| 2026-01-13 | 13F | CoreCap Advisors, LLC | 1.731 | 1.631,00 | 20 | 1.800,00 | ||||
| 2025-11-14 | 13F | Gotham Asset Management, LLC | 0 | -100,00 | 0 | -100,00 | ||||
| 2026-02-05 | 13F | Allworth Financial LP | 1.126 | 8,37 | 13 | 9,09 | ||||
| 2025-10-27 | 13F | PBMares Wealth Management LLC | 10.000 | 114 | ||||||
| 2025-09-26 | NP | FZIPX - Fidelity ZERO Extended Market Index Fund This fund is a listed as child fund of Fmr Llc and if that institution has disclosed ownership in this security, then these positions will not be double counted when calculating total shares and total value | 67.964 | 4,82 | 387 | 14,50 | ||||
| 2026-02-13 | 13F | Manufacturers Life Insurance Company, The | 0 | -100,00 | 0 | |||||
| 2026-02-13 | 13F | Commerce Bank | 0 | -100,00 | 0 | -100,00 | ||||
| 2026-01-29 | 13F | Focused Wealth Management, Inc | Call | 1.500 | 17 | |||||
| 2026-02-05 | 13F | DnB Asset Management AS | 530.534 | -48,70 | 6.080 | -48,39 | ||||
| 2026-02-13 | 13F | Mariner, LLC | 74.627 | 12,58 | 856 | 13,38 | ||||
| 2026-01-29 | 13F | Focused Wealth Management, Inc | 13.215 | 151 | ||||||
| 2026-02-10 | 13F | Intech Investment Management Llc | 102.729 | 85,84 | 1.177 | 87,12 | ||||
| 2026-01-29 | 13F | James Investment Research Inc | 91.484 | -10,00 | 1.048 | -9,42 | ||||
| 2025-11-14 | 13F | Balyasny Asset Management Llc | Call | 0 | -100,00 | 0 | -100,00 | |||
| 2026-02-03 | 13F | SBI Securities Co., Ltd. | 26.341 | -22,98 | 302 | -22,62 | ||||
| 2026-02-17 | 13F | Elequin Capital Lp | 723 | 8 | ||||||
| 2026-02-13 | 13F | Police & Firemen's Retirement System of New Jersey | 83.060 | 18,07 | 952 | 18,73 | ||||
| 2025-09-24 | NP | IBAT - iShares Energy Storage & Materials ETF | 9.192 | 52 | ||||||
| 2026-02-17 | 13F | Advisory Services Network, LLC | 0 | -100,00 | 0 | |||||
| 2025-11-14 | 13F | Two Sigma Securities, Llc | 0 | -100,00 | 0 | |||||
| 2026-02-06 | 13F | Bare Financial Services, Inc | 83 | 1 | ||||||
| 2026-02-13 | 13F | Quattro Advisors LLC | 30 | 0 | ||||||
| 2026-02-17 | 13F | Shay Capital LLC | Call | 481.000 | 74,91 | 5.512 | 75,99 | |||
| 2026-02-17 | 13F | Graham Capital Management, L.P. | Put | 2.655.100 | -65,71 | 30.427 | -65,50 | |||
| 2026-02-17 | 13F | Graham Capital Management, L.P. | 1.791.515 | 20.531 | ||||||
| 2026-01-23 | 13F | Legacy Bridge, LLC | 1.300 | 85,71 | 15 | 100,00 | ||||
| 2026-02-13 | 13F | FirstWave Capital Management LLC | 97.326 | 1.115 | ||||||
| 2026-02-17 | 13F | Shay Capital LLC | 376.000 | 164,79 | 4.309 | 166,42 | ||||
| 2026-02-06 | 13F | Cullen/frost Bankers, Inc. | 130.000 | 85,71 | 1.490 | 86,83 | ||||
| 2026-01-30 | 13F | R Squared Ltd | 16.234 | -10,54 | 186 | -9,71 | ||||
| 2026-02-17 | 13F | Citadel Advisors Llc | Put | 6.056.400 | 13,27 | 69.406 | 13,97 | |||
| 2026-02-17 | 13F | Russell Investments Group, Ltd. | 34.708 | 28,74 | 398 | 29,32 | ||||
| 2026-02-09 | 13F | Keating Financial Advisory Services, Inc. | 47 | 1 | ||||||
| 2026-02-17 | 13F | Citadel Advisors Llc | Call | 9.388.300 | 99,60 | 107.590 | 100,83 | |||
| 2025-09-26 | NP | ISCG - iShares Morningstar Small-Cap Growth ETF | 60.735 | 1,48 | 346 | 10,90 | ||||
| 2026-02-12 | 13F | Barings Llc | 1.204.430 | 0,00 | 13.803 | 0,61 | ||||
| 2026-02-17 | 13F | Citadel Advisors Llc | 2.461.988 | -11,53 | 28.214 | -10,99 | ||||
| 2026-02-04 | 13F | Atlantic Union Bankshares Corp | 50 | 1 | ||||||
| 2026-02-13 | 13F | Greenline Wealth Management LLC | 102 | 1 | ||||||
| 2026-01-29 | 13F | Comerica Bank | 24.032 | -3,10 | 275 | -2,48 | ||||
| 2025-09-24 | NP | SWTSX - Schwab Total Stock Market Index Fund This fund is a listed as child fund of Charles Schwab Investment Management Inc and if that institution has disclosed ownership in this security, then these positions will not be double counted when calculating total shares and total value | 118.278 | 0,00 | 674 | 9,24 | ||||
| 2026-02-06 | 13F | Pnc Financial Services Group, Inc. | 2.524 | 3.843,75 | 29 | |||||
| 2025-09-24 | NP | FYC - First Trust Small Cap Growth AlphaDEX Fund This fund is a listed as child fund of First Trust Advisors Lp and if that institution has disclosed ownership in this security, then these positions will not be double counted when calculating total shares and total value | 568.007 | 111,84 | 3.238 | 131,38 | ||||
| 2026-01-16 | 13F | DiNuzzo Private Wealth, Inc. | 40 | 0 | ||||||
| 2026-01-28 | 13F | Klp Kapitalforvaltning As | 83.200 | 12,89 | 953 | 13,59 | ||||
| 2025-11-12 | 13F | HAP Trading, LLC | Call | 222.500 | 1.341 | |||||
| 2026-02-17 | 13F | Voloridge Investment Management, Llc | 222.074 | 2.545 | ||||||
| 2026-02-11 | 13F | Erste Asset Management GmbH | 0 | -100,00 | 0 | -100,00 | ||||
| 2026-02-17 | 13F | Two Sigma Advisers, Lp | 3.211.785 | 36.807 | ||||||
| 2025-09-24 | NP | FAD - First Trust Multi Cap Growth AlphaDEX Fund This fund is a listed as child fund of First Trust Advisors Lp and if that institution has disclosed ownership in this security, then these positions will not be double counted when calculating total shares and total value | 73.289 | 120,70 | 418 | 141,04 | ||||
| 2026-02-17 | 13F | Driehaus Capital Management Llc | 14.270.294 | 117,35 | 163.538 | 118,69 | ||||
| 2026-02-06 | 13F | Global Retirement Partners, LLC | 9.130 | 52,17 | 105 | 52,94 | ||||
| 2026-02-02 | 13F | Montag A & Associates Inc | 16.559 | -9,80 | 190 | -9,57 | ||||
| 2026-02-17 | 13F | Susquehanna International Group, Llp | Call | 6.782.000 | -18,10 | 77.722 | -17,60 | |||
| 2026-02-17 | 13F | Equitable Holdings, Inc. | 0 | -100,00 | 0 | -100,00 | ||||
| 2026-02-17 | 13F | Susquehanna International Group, Llp | 6.578.167 | 766,99 | 75.386 | 772,31 | ||||
| 2026-02-17 | 13F | Susquehanna International Group, Llp | Put | 9.282.700 | 69,01 | 106.380 | 70,05 | |||
| 2026-01-08 | 13F | Wealth Enhancement Advisory Services, Llc | 35.454 | -29,08 | 502 | -26,54 | ||||
| 2026-01-27 | 13F | TD Waterhouse Canada Inc. | 3.119 | 178,73 | 36 | 169,23 | ||||
| 2026-02-11 | 13F | Empery Asset Management, LP | 249.726 | 2.862 | ||||||
| 2026-02-17 | 13F | Alliancebernstein L.p. | 313.900 | -16,91 | 3.597 | -16,41 | ||||
| 2026-01-16 | 13F | Udine Wealth Management, Inc. | 151.006 | -14,63 | 2 | -99,95 | ||||
| 2026-02-17 | 13F | Wellington Management Group Llp | 506.573 | 5.805 | ||||||
| 2025-11-13 | 13F | Jefferies Financial Group Inc. | Put | 0 | -100,00 | 0 | -100,00 | |||
| 2026-02-11 | 13F | Jpmorgan Chase & Co | 295.390 | -73,88 | 3.385 | -73,72 | ||||
| 2025-09-26 | NP | FZROX - Fidelity ZERO Total Market Index Fund This fund is a listed as child fund of Fmr Llc and if that institution has disclosed ownership in this security, then these positions will not be double counted when calculating total shares and total value | 108.787 | 9,38 | 620 | 19,46 | ||||
| 2026-02-03 | 13F/A | Bank Of America Corp /de/ | Put | 0 | -100,00 | 0 | -100,00 | |||
| 2026-02-03 | 13F/A | Bank Of America Corp /de/ | Call | 0 | -100,00 | 0 | -100,00 | |||
| 2025-09-25 | NP | CCNR - ALPS | CoreCommodity Natural Resources ETF | 141.937 | -14,68 | 809 | -6,80 | ||||
| 2026-02-13 | 13F | Walleye Trading LLC | 738.663 | 92,53 | 8.465 | 93,75 | ||||
| 2026-02-13 | 13F | Zuckerman Investment Group, LLC | 0 | -100,00 | 0 | |||||
| 2026-02-13 | 13F | Walleye Trading LLC | Put | 2.449.400 | 38,71 | 28.070 | 39,57 | |||
| 2026-02-13 | 13F | Capital Square, LLC | 13.106 | 9,22 | 150 | 10,29 | ||||
| 2026-02-13 | 13F | Walleye Trading LLC | Call | 2.926.400 | 15,34 | 33.537 | 16,05 | |||
| 2026-02-13 | 13F | Wells Fargo & Company/mn | 500.184 | 72,74 | 5.732 | 73,80 | ||||
| 2026-02-12 | 13F | Hrt Financial Lp | 1.974.160 | 246,68 | 23 | 266,67 | ||||
| 2026-02-13 | 13F | Hudson Bay Capital Management LP | 0 | -100,00 | 0 | |||||
| 2026-02-12 | 13F | Dimensional Fund Advisors Lp | 11.179 | 128 | ||||||
| 2026-02-17 | 13F | Janus Henderson Group Plc | 254.165 | 150,66 | 2.911 | 152,60 | ||||
| 2026-02-17 | 13F | Symmetry Peak Management Llc | Call | 0 | -100,00 | 0 | -100,00 | |||
| 2026-01-29 | 13F | IMC-Chicago, LLC | 559.820 | 49,11 | 6.416 | 50,02 | ||||
| 2026-02-04 | 13F | Meridian Wealth Management, LLC | 63.077 | -19,18 | 723 | -18,69 | ||||
| 2026-02-17 | 13F | Concentric Capital Strategies, LP | 0 | -100,00 | 0 | |||||
| 2026-02-13 | 13F | Parkside Financial Bank & Trust | 1.585 | 0,00 | 18 | 0,00 | ||||
| 2026-02-17 | 13F | Kemnay Advisory Services Inc. | 773 | 9 | ||||||
| 2026-02-05 | 13F | Amalgamated Bank | 9.703 | 27,65 | 0 | |||||
| 2025-11-14 | 13F | Point72 Europe (London) LLP | 17.084 | 195 | ||||||
| 2026-02-10 | 13F | Root Financial Partners, LLC | 230 | 3 | ||||||
| 2026-01-28 | 13F | Chicago Partners Investment Group LLC | 10.050 | 172 | ||||||
| 2025-10-14 | 13F | Baxter Bros Inc | 0 | -100,00 | 0 | |||||
| 2026-01-29 | 13F | Carmel Capital Partners, LLC | 16.100 | -33,20 | 185 | -32,85 | ||||
| 2025-11-14 | 13F | Wolverine Trading, Llc | 0 | -100,00 | 0 | |||||
| 2025-09-29 | NP | PBW - Invesco WilderHill Clean Energy ETF This fund is a listed as child fund of Invesco Ltd. and if that institution has disclosed ownership in this security, then these positions will not be double counted when calculating total shares and total value | 937.879 | -9,72 | 5.346 | -1,44 | ||||
| 2026-02-10 | 13F | Daiwa Securities Group Inc. | Put | 400.000 | 5 | |||||
| 2026-02-12 | 13F | Voya Investment Management Llc | 54.722 | 19,81 | 627 | 20,58 | ||||
| 2026-01-05 | 13F | GAMMA Investing LLC | 3.270 | 46,37 | 37 | 48,00 | ||||
| 2026-02-10 | 13F | Bank of New York Mellon Corp | 895.829 | 26,58 | 10.266 | 27,37 | ||||
| 2026-02-17 | 13F | Concentric Capital Strategies, LP | Call | 0 | -100,00 | 0 | ||||
| 2026-01-27 | 13F | GHP Investment Advisors, Inc. | 0 | -100,00 | 0 | |||||
| 2026-01-07 | 13F | Lake Street Financial Llc | 12.550 | 18,96 | 144 | 19,17 | ||||
| 2026-02-17 | 13F | Polar Asset Management Partners Inc. | Call | 0 | -100,00 | 0 | -100,00 | |||
| 2025-09-24 | NP | PPNMX - SmallCap Growth Fund I R-3 | 11.880 | 68 | ||||||
| 2026-02-17 | 13F | State Of Wisconsin Investment Board | 52.490 | 130,21 | 602 | 132,05 | ||||
| 2026-02-10 | 13F | Daiwa Securities Group Inc. | 104.530 | 550,55 | 1 | |||||
| 2025-11-13 | 13F | Beaird Harris Wealth Management, LLC | 0 | -100,00 | 0 | -100,00 | ||||
| 2025-11-21 | 13F/A | CIBC Bancorp USA Inc. | 27.151 | 309 | ||||||
| 2026-02-13 | 13F | Maven Securities LTD | 43.341 | 497 | ||||||
| 2026-02-12 | 13F | Skandinaviska Enskilda Banken AB (publ) | 0 | -100,00 | 0 | |||||
| 2025-11-14 | 13F | Cubist Systematic Strategies, LLC | Put | 352.400 | 619,18 | 4.014 | 1.505,20 | |||
| 2025-11-14 | 13F | Cubist Systematic Strategies, LLC | Call | 350.700 | 153,76 | 3.994 | 464,92 | |||
| 2026-02-12 | 13F | American Financial Group Inc | 971.928 | -0,99 | 11.138 | -0,38 | ||||
| 2026-02-17 | 13F | MIRAE ASSET GLOBAL ETFS HOLDINGS Ltd. | 833.866 | -48,50 | 9.499 | -47,64 | ||||
| 2026-02-17 | 13F | Algert Global Llc | 313.387 | 103,12 | 4 | 200,00 | ||||
| 2026-02-10 | 13F | Bnp Paribas Arbitrage, Sa | Call | 0 | -100,00 | 0 | -100,00 | |||
| 2026-02-12 | 13F | CIBC Private Wealth Group, LLC | 4.200 | -16,00 | 48 | -14,29 | ||||
| 2026-02-10 | 13F | Godfrey Financial Associates, Inc. | 11 | 0 | ||||||
| 2026-02-05 | 13F | Staley Capital Advisers Inc | 20.000 | 0,00 | 229 | 0,88 | ||||
| 2026-02-13 | 13F | Adams Natural Resources Fund, Inc. | 62.600 | 717 | ||||||
| 2026-02-04 | 13F | Flagship Private Wealth, LLC | 103.606 | 6,86 | 1.187 | 7,52 | ||||
| 2026-02-17 | 13F | Quantinno Capital Management LP | 12.655 | 145 | ||||||
| 2026-02-02 | 13F | Strs Ohio | 15.400 | 176 | ||||||
| 2026-02-06 | 13F | Granite FO LLC | 0 | -100,00 | 0 | -100,00 | ||||
| 2026-02-12 | 13F | Cibc World Markets Corp | 20.431 | -25,49 | 234 | 67,14 | ||||
| 2026-02-17 | 13F | Eddie Patel Inc | 49.589 | 568 | ||||||
| 2026-02-13 | 13F | Baird Financial Group, Inc. | 580.810 | -24,06 | 6.656 | -23,59 | ||||
| 2026-01-29 | 13F | Sanctuary Advisors, LLC | 24.467 | 51,55 | 280 | 53,01 | ||||
| 2026-02-11 | 13F | Havemeyer Place LP | 16.162 | 185 | ||||||
| 2026-01-30 | 13F | Citizens Financial Group Inc/ri | 162.000 | -32,25 | 1.857 | -31,84 | ||||
| 2026-02-12 | 13F | Nuveen, LLC | 752.185 | 33,40 | 8.620 | 34,23 | ||||
| 2025-09-24 | NP | BLACKROCK FUNDS - iShares Russell Small/Mid-Cap Index Fund Investor A | 34.669 | 198 | ||||||
| 2026-02-17 | 13F | Capital Fund Management S.a. | Put | 392.300 | 145,80 | 4.496 | 147,39 | |||
| 2026-02-17 | 13F | Capital Fund Management S.a. | Call | 748.600 | 512,10 | 8.579 | 516,24 | |||
| 2026-02-06 | 13F | Larson Financial Group LLC | 793 | 15,77 | 9 | 28,57 | ||||
| 2026-02-13 | 13F | Prudential Financial Inc | 26.495 | -15,27 | 304 | -14,89 | ||||
| 2026-02-17 | 13F | Voleon Capital Management Lp | 0 | -100,00 | 0 | -100,00 | ||||
| 2026-02-11 | 13F | O'shaughnessy Asset Management, Llc | 14.056 | 161 | ||||||
| 2026-02-11 | 13F | CenterBook Partners LP | 77.827 | 892 | ||||||
| 2026-02-17 | 13F | Capital Fund Management S.a. | 0 | -100,00 | 0 | -100,00 | ||||
| 2026-02-11 | 13F | BI Asset Management Fondsmaeglerselskab A/S | 257.219 | 3 | ||||||
| 2026-02-11 | 13F | Deutsche Bank Ag\ | 251.764 | 26,30 | 2.885 | 27,09 | ||||
| 2026-01-21 | 13F | Apella Capital, LLC | 10.122 | -8,81 | 116 | -32,75 | ||||
| 2026-02-17 | 13F | Private Advisor Group, LLC | 411.850 | 4.720 | ||||||
| 2026-02-17 | 13F | First Manhattan Co | 23.000 | 264 | ||||||
| 2026-02-12 | 13F | Swiss National Bank | 639.000 | 32,27 | 7.323 | 33,08 | ||||
| 2026-02-18 | 13F | GWM Advisors LLC | 1.865.543 | -13,04 | 21.034 | -13,92 | ||||
| 2026-02-12 | 13F | Xponance, Inc. | 24.256 | 22,51 | 278 | 23,11 | ||||
| 2026-02-13 | 13F | Kestra Advisory Services, LLC | 0 | -100,00 | 0 | |||||
| 2026-02-09 | 13F | Integrity Advisory Solutions, LLC | 16.464 | 53,80 | 189 | 55,37 | ||||
| 2025-09-24 | NP | BLACKROCK FUNDS - iShares Total U.S. Stock Market Index Fund Investor A | 16.374 | 93 | ||||||
| 2026-01-23 | 13F | Bouvel Investment Partners, LLC | 108.226 | -2,34 | 1.240 | -1,74 | ||||
| 2026-02-05 | 13F | Bessemer Group Inc | 5.108 | 0,00 | 0 | |||||
| 2026-02-17 | 13F | Jain Global LLC | 24.523 | 281 | ||||||
| 2026-02-17 | 13F | Saba Capital Management, L.P. | Put | 0 | -100,00 | 0 | -100,00 | |||
| 2026-02-17 | 13F | Saba Capital Management, L.P. | 0 | -100,00 | 0 | -100,00 | ||||
| 2026-02-12 | 13F | Hollencrest Capital Management | 13.000 | 5,26 | 149 | 5,71 | ||||
| 2026-02-12 | 13F | Renaissance Technologies Llc | 0 | -100,00 | 0 | -100,00 | ||||
| 2025-11-13 | 13F | EVR Research LP | 0 | -100,00 | 0 | -100,00 | ||||
| 2026-02-13 | 13F | Caxton Associates Llp | 144.541 | -53,25 | 1.656 | -52,97 | ||||
| 2025-09-26 | NP | USMIX - Extended Market Index Fund | 28.267 | 8,23 | 161 | 18,38 | ||||
| 2026-02-05 | 13F | HFM Investment Advisors, LLC | 14 | 0 | ||||||
| 2025-09-26 | NP | ETTOX - E*TRADE No Fee Total Market Index Fund | 89 | 0,00 | 1 | |||||
| 2026-02-13 | 13F | Charles Schwab Investment Management Inc | 2.462.575 | 13,90 | 28.221 | 14,61 | ||||
| 2026-02-17 | 13F | Arosa Capital Management LP | 292.113 | 3.348 | ||||||
| 2026-02-04 | 13F | Ground Swell Capital, LLC | 0 | -100,00 | 0 | -100,00 | ||||
| 2026-02-13 | 13F | Kayne Anderson Capital Advisors Lp | 0 | -100,00 | 0 | -100,00 | ||||
| 2026-02-17 | 13F | Arosa Capital Management LP | Call | 1.650.000 | 312,50 | 18.909 | 315,04 | |||
| 2026-02-17 | 13F | Raymond James Financial Inc | 521.177 | 99,15 | 5.973 | 100,40 | ||||
| 2026-01-23 | 13F | Diversify Advisory Services, LLC | 19.028 | 11,12 | 332 | 24,34 | ||||
| 2026-02-04 | 13F | Rinkey Investments | 44.877 | -13,58 | 514 | -13,03 | ||||
| 2026-02-10 | 13F | Sfmg, Llc | 0 | -100,00 | 0 | |||||
| 2026-02-11 | 13F | Ameritas Investment Partners, Inc. | 25.500 | 292 | ||||||
| 2026-02-11 | 13F | Simplex Trading, Llc | 2.248.934 | 86,85 | 25.773 | 198.146,15 | ||||
| 2026-02-13 | 13F | Ieq Capital, Llc | 78.574 | 138,21 | 900 | 140,00 | ||||
| 2026-02-17 | 13F | Css Llc/il | Put | 20.000 | 229 | |||||
| 2026-02-17 | 13F | Cresset Asset Management, LLC | 10.530 | 0,00 | 121 | 0,84 | ||||
| 2026-02-13 | 13F | Walleye Capital LLC | Put | 433.800 | 34,05 | 4.971 | 34,90 | |||
| 2026-02-17 | 13F | Cannell Capital Llc | Put | 13.083 | 14.993 | |||||
| 2026-02-13 | 13F | Walleye Capital LLC | 822.762 | 117,42 | 9.429 | 118,75 | ||||
| 2026-02-12 | 13F | Commonwealth Equity Services, Llc | 82.444 | -22,13 | 945 | 94.300,00 | ||||
| 2026-02-13 | 13F | Walleye Capital LLC | Call | 204.100 | -18,49 | 2.339 | -18,02 | |||
| 2025-09-26 | NP | FLXSX - Fidelity Flex Small Cap Index Fund This fund is a listed as child fund of Fmr Llc and if that institution has disclosed ownership in this security, then these positions will not be double counted when calculating total shares and total value | 48.920 | 279 | ||||||
| 2026-01-22 | 13F | Vision Financial Markets Llc | 100 | 0,00 | 1 | 0,00 | ||||
| 2025-09-26 | NP | TIEIX - TIAA-CREF Equity Index Fund Institutional Class | 189.927 | 1.083 | ||||||
| 2026-02-17 | 13F | Nokomis Capital, L.L.C. | Put | 439.800 | -7,49 | 5.040 | -6,91 | |||
| 2026-02-17 | 13F | California State Teachers Retirement System | 310.885 | 31,66 | 3.563 | 32,47 | ||||
| 2026-02-13 | 13F | BNP Paribas Asset Management Holding S.A. | 1.135.687 | 13 | ||||||
| 2026-01-28 | 13F | Joseph P. Lucia & Associates, LLC | 13.747 | 35,77 | 158 | 36,52 | ||||
| 2026-01-23 | 13F | Investment Advisory Group, LLC | 23.287 | 1,25 | 267 | 1,92 | ||||
| 2026-02-17 | 13F | Engineers Gate Manager LP | 317.625 | -42,75 | 3.640 | -42,41 | ||||
| 2025-11-12 | 13F | Gabelli Funds Llc | 0 | -100,00 | 0 | |||||
| 2026-02-09 | 13F | Putnam Fl Investment Management Co | 49.386 | -61,78 | 566 | -61,59 | ||||
| 2026-02-14 | 13F | Rockefeller Capital Management L.P. | 16.265 | 272,79 | 186 | 279,59 | ||||
| 2026-02-04 | 13F | Swiss Life Asset Management Ltd | 14.796 | 31,25 | 170 | 32,03 | ||||
| 2026-02-12 | 13F | Wealthspire Advisors, LLC | 0 | -100,00 | 0 | -100,00 | ||||
| 2026-02-17 | 13F | Polar Capital Holdings Plc | 878.000 | 10.062 | ||||||
| 2026-02-17 | 13F | CWM Advisors, LLC | 41.442 | 2,17 | 475 | 2,82 | ||||
| 2026-02-17 | 13F | Bayesian Capital Management, LP | 12.100 | 139 | ||||||
| 2025-11-07 | 13F | SCP Investment, LP | 0 | -100,00 | 0 | |||||
| 2026-02-04 | 13F | Summit Wealth Group Llc / Co | 0 | -100,00 | 0 | -100,00 | ||||
| 2025-09-26 | NP | PASIX - PACE Alternative Strategies Investments Class A | Short | -1.278 | -7 | |||||
| 2026-02-13 | 13F | JustInvest LLC | 20.998 | 2,61 | 241 | 3,00 | ||||
| 2025-11-06 | 13F | Prospera Financial Services Inc | 0 | -100,00 | 0 | -100,00 | ||||
| 2026-01-21 | 13F | Newbridge Financial Services Group, Inc. | 300 | 3 | ||||||
| 2026-01-15 | 13F | Fortitude Family Office, LLC | 166 | 12,16 | 2 | 0,00 | ||||
| 2026-01-26 | 13F | Cwm, Llc | 3.175 | -20,51 | 0 | |||||
| 2026-02-02 | 13F | Chung Wu Investment Group, LLC | 230 | -91,30 | 3 | -93,33 | ||||
| 2026-02-17 | 13F | Two Sigma Investments, Lp | Put | 900.700 | 0,77 | 10.322 | 1,39 | |||
| 2026-02-17 | 13F | Oxford Asset Management Llp | 10.094 | 116 | ||||||
| 2026-02-17 | 13F | Two Sigma Investments, Lp | 5.349.993 | 238,15 | 61.311 | 240,23 | ||||
| 2026-02-11 | 13F | Rise Advisors, LLC | 0 | -100,00 | 0 | |||||
| 2026-02-10 | 13F | Bnp Paribas Arbitrage, Sa | 70.132 | -97,89 | 804 | -97,87 | ||||
| 2026-02-17 | 13F | Jones Financial Companies Lllp | 23.134 | 72,06 | 265 | 94,85 | ||||
| 2026-02-17 | 13F | Brevan Howard Capital Management LP | 105.856 | -36,76 | 1.213 | -36,36 | ||||
| 2025-10-27 | 13F | Kiker Wealth Management, LLC | 0 | -100,00 | 0 | |||||
| 2026-01-28 | 13F | Teacher Retirement System Of Texas | 0 | -100,00 | 0 | |||||
| 2026-02-17 | 13F | Parallax Volatility Advisers, L.P. | Call | 25.000 | 286 | |||||
| 2026-02-06 | 13F | L.K. Benson & Company, P.C. | 71.990 | -7,57 | 825 | -6,99 | ||||
| 2026-02-02 | 13F | Principal Financial Group Inc | 18.232 | -6,47 | 209 | -6,31 | ||||
| 2026-02-17 | 13F | SageView Advisory Group, LLC | 50 | 1 | ||||||
| 2026-01-15 | 13F | Vaughan Nelson Investment Management, L.p. | 1.948.500 | 22.330 | ||||||
| 2026-02-12 | 13F | Alps Advisors Inc | 369.015 | -11,28 | 4.229 | -10,75 | ||||
| 2026-02-05 | 13F | Macroview Investment Management Llc | 46.000 | 0,00 | 527 | 0,76 | ||||
| 2026-02-19 | 13F | Invesco Ltd. | 1.182.863 | 7,81 | 13.556 | 8,47 | ||||
| 2026-01-27 | 13F | WealthCollab, LLC | 6.073 | -13,69 | 70 | -13,75 | ||||
| 2026-02-17 | 13F | Cetera Investment Advisers | 78.792 | -21,43 | 903 | -21,02 | ||||
| 2026-02-05 | 13F | Cambridge Investment Research Advisors, Inc. | 31.710 | 60,89 | 0 | |||||
| 2025-11-03 | 13F | Stonegate Investment Group, LLC | 30.850 | 105,67 | 351 | 361,84 | ||||
| 2025-09-26 | NP | TISBX - TIAA-CREF Small-Cap Blend Index Fund Institutional Class | 288.953 | 1.647 | ||||||
| 2026-02-10 | 13F | Baker Avenue Asset Management, LP | 1.007.183 | 11.542 | ||||||
| 2026-02-13 | 13F | Verition Fund Management LLC | Put | 0 | -100,00 | 0 | -100,00 | |||
| 2026-02-13 | 13F | Resources Investment Advisors, LLC. | 24.907 | 18,35 | 285 | 19,25 | ||||
| 2025-09-26 | NP | FXSCX - Fidelity Flex Small Cap Focused Index Fund | 1.075 | 6 | ||||||
| 2026-02-02 | 13F | Bay Harbor Wealth Management, LLC | 2 | 0 | ||||||
| 2026-02-17 | 13F | Ardsley Advisory Partners Lp | 555.000 | -65,31 | 6.360 | -64,95 | ||||
| 2025-11-14 | 13F | Integrity Alliance, Llc. | 0 | -100,00 | 0 | -100,00 | ||||
| 2026-01-15 | 13F | Lodestone Wealth Management LLC | 5.908 | 68 | ||||||
| 2026-02-03 | 13F | NewEdge Wealth, LLC | 17.187 | 197 | ||||||
| 2026-02-17 | 13F | D. E. Shaw & Co., Inc. | Call | 4.186.000 | 275,93 | 47.972 | 278,26 | |||
| 2026-02-17 | 13F | Limestone Investment Advisors LP | 0 | -100,00 | 0 | -100,00 | ||||
| 2026-01-14 | 13F | Spire Wealth Management | 0 | -100,00 | 0 | |||||
| 2026-02-17 | 13F | D. E. Shaw & Co., Inc. | Put | 1.148.600 | 10,06 | 13.163 | 10,74 | |||
| 2025-11-14 | 13F | J. Goldman & Co LP | 0 | -100,00 | 0 | |||||
| 2026-02-09 | 13F | Global Assets Advisory, LLC | 32.155 | 368 | ||||||
| 2026-02-13 | 13F | DLD Asset Management, LP | Put | 600.000 | 6.867 | |||||
| 2026-02-06 | 13F | ProShare Advisors LLC | 68.410 | 37,01 | 784 | 37,85 | ||||
| 2026-02-17 | 13F | D. E. Shaw & Co., Inc. | 27.293 | 313 | ||||||
| 2026-01-23 | 13F | Gainplan LLC | 27.731 | 318 | ||||||
| 2026-02-17 | 13F | Balyasny Asset Management Llc | 0 | -100,00 | 0 | |||||
| 2026-02-13 | 13F | First Trust Advisors Lp | 1.482.461 | -20,48 | 16.989 | -19,99 | ||||
| 2026-02-17 | 13F | Tower Research Capital LLC (TRC) | 8.761 | -50,09 | 100 | -49,75 | ||||
| 2026-01-28 | 13F | Arizona State Retirement System | 89.506 | 21,58 | 1.026 | 22,32 | ||||
| 2026-02-02 | 13F | Wolverine Asset Management Llc | 124 | 1 | ||||||
| 2026-02-17 | 13F | Bank Of America Corp /de/ | 659.796 | -78,52 | 7.561 | -78,39 | ||||
| 2025-09-29 | NP | CCSO - Carbon Collective Climate Solutions U.S. Equity ETF | 8.015 | 0,00 | 46 | 9,76 | ||||
| 2026-02-13 | 13F | Marshall Wace, Llp | 182.167 | 2.088 | ||||||
| 2025-09-24 | NP | FIDU - Fidelity MSCI Industrials Index ETF This fund is a listed as child fund of Fmr Llc and if that institution has disclosed ownership in this security, then these positions will not be double counted when calculating total shares and total value | 56.005 | 7,07 | 319 | 16,85 | ||||
| 2026-02-13 | 13F | Morgan Stanley | 3.269.699 | -23,98 | 37.471 | -23,52 | ||||
| 2026-02-11 | 13F | MCF Advisors LLC | 1.500 | 2.105,88 | 17 | |||||
| 2025-09-29 | NP | SUNAMERICA SERIES TRUST - SA Small Cap Index Portfolio Class 1 | 25.302 | 144 | ||||||
| 2026-01-23 | 13F | Westside Investment Management, Inc. | 500 | 0,00 | 6 | 0,00 | ||||
| 2025-09-29 | NP | RSSL - Global X Russell 2000 ETF | 113.868 | 649 | ||||||
| 2026-02-06 | 13F | EverSource Wealth Advisors, LLC | 795 | -18,29 | 9 | -18,18 | ||||
| 2026-02-10 | 13F | Envestnet Asset Management Inc | 20.449 | -54,10 | 234 | -53,85 | ||||
| 2026-02-10 | 13F | Natixis Advisors, L.p. | 144.586 | 2 | ||||||
| 2026-02-10 | 13F | Quantbot Technologies LP | 244.302 | 1.501,56 | 2.800 | 1.517,92 | ||||
| 2026-02-13 | 13F | Warberg Asset Management LLC | 11.218 | 128 | ||||||
| 2026-01-14 | 13F | Elevatus Welath Management | 62.093 | -65,71 | 712 | -65,52 | ||||
| 2026-02-02 | 13F | Souders Financial Advisors | 62.507 | -23,31 | 716 | -22,84 | ||||
| 2026-02-13 | 13F | Caitong International Asset Management Co., Ltd | 5.732 | 33,09 | 66 | 32,65 | ||||
| 2026-02-13 | 13F | Victory Capital Management Inc | 36.286 | 17,27 | 416 | 17,90 | ||||
| 2026-02-13 | 13F | Citigroup Inc | 10.369 | -73,41 | 119 | -73,42 | ||||
| 2026-02-09 | 13F | Fedenia Advisers LLC | 0 | -100,00 | 0 | |||||
| 2026-02-13 | 13F | Citigroup Inc | Call | 249.600 | 35,43 | 2.860 | 36,26 | |||
| 2026-01-27 | 13F | Friedenthal Financial | 1 | 0 | ||||||
| 2026-02-09 | 13F | Geode Capital Management, Llc | 7.205.507 | 16,08 | 82.587 | 16,80 | ||||
| 2026-01-29 | 13F | Teachers Retirement System Of The State Of Kentucky | 38.654 | 0 | ||||||
| 2025-09-24 | NP | FYX - First Trust Small Cap Core AlphaDEX Fund This fund is a listed as child fund of First Trust Advisors Lp and if that institution has disclosed ownership in this security, then these positions will not be double counted when calculating total shares and total value | 497.996 | 266,95 | 2.839 | 300,85 | ||||
| 2026-01-27 | 13F | Richards, Merrill & Peterson, Inc. | 48.945 | -28,31 | 561 | -27,93 | ||||
| 2026-02-06 | 13F | Van Hulzen Asset Management, LLC | 0 | -100,00 | 0 | |||||
| 2025-11-14 | 13F | Sabby Management, Llc | 0 | -100,00 | 0 | |||||
| 2026-02-11 | 13F | Janney Montgomery Scott LLC | 23.725 | 31,88 | 0 | |||||
| 2026-02-12 | 13F | BlackRock, Inc. | 23.426.616 | 27,24 | 268.469 | 28,02 | ||||
| 2026-02-06 | 13F | IFP Advisors, Inc | 1.055 | 21,13 | 12 | 33,33 | ||||
| 2026-02-12 | 13F | Federated Hermes, Inc. | 237.952 | 2.727 | ||||||
| 2026-02-17 | 13F | Electron Capital Partners, LLC | 6.121.896 | -7,17 | 70.157 | -6,60 | ||||
| 2026-02-10 | 13F | Florida Financial Advisors, Llc | 41.139 | 471 | ||||||
| 2025-11-14 | 13F | Wolverine Trading, Llc | Put | 0 | -100,00 | 0 | ||||
| 2026-02-13 | 13F | Barclays Plc | 1.408.419 | 279,36 | 16.140 | 281,74 | ||||
| 2026-02-13 | 13F | Barclays Plc | Call | 75.000 | -80,00 | 860 | -79,89 | |||
| 2026-02-11 | 13F | 111 Capital | 0 | -100,00 | 0 | -100,00 | ||||
| 2025-11-14 | 13F | Wolverine Trading, Llc | Call | 0 | -100,00 | 0 | ||||
| 2026-02-13 | 13F | Centiva Capital, LP | 15.313 | 175 | ||||||
| 2026-02-17 | 13F | Sender Co & Partners, Inc. | 24.143 | 277 | ||||||
| 2026-02-05 | 13F | Duncan Williams Asset Management, LLC | 29.740 | -4,19 | 369 | 4,25 | ||||
| 2026-02-06 | 13F | Copia Wealth Management | 4.808 | 0,25 | 55 | 1,85 | ||||
| 2026-02-13 | 13F | Level Four Advisory Services, Llc | 0 | -100,00 | 0 | -100,00 |