Grundlæggende statistik
| Institutionelle ejere | 105 total, 105 long only, 0 short only, 0 long/short - change of -1,87% MRQ |
| Gennemsnitlig porteføljeallokering | 0.1254 % - change of -10,93% MRQ |
| Institutionelle aktier (lange) | 5.123.673 (ex 13D/G) - change of 0,12MM shares 2,45% MRQ |
| Institutionel værdi (lang) | $ 159.262 USD ($1000) |
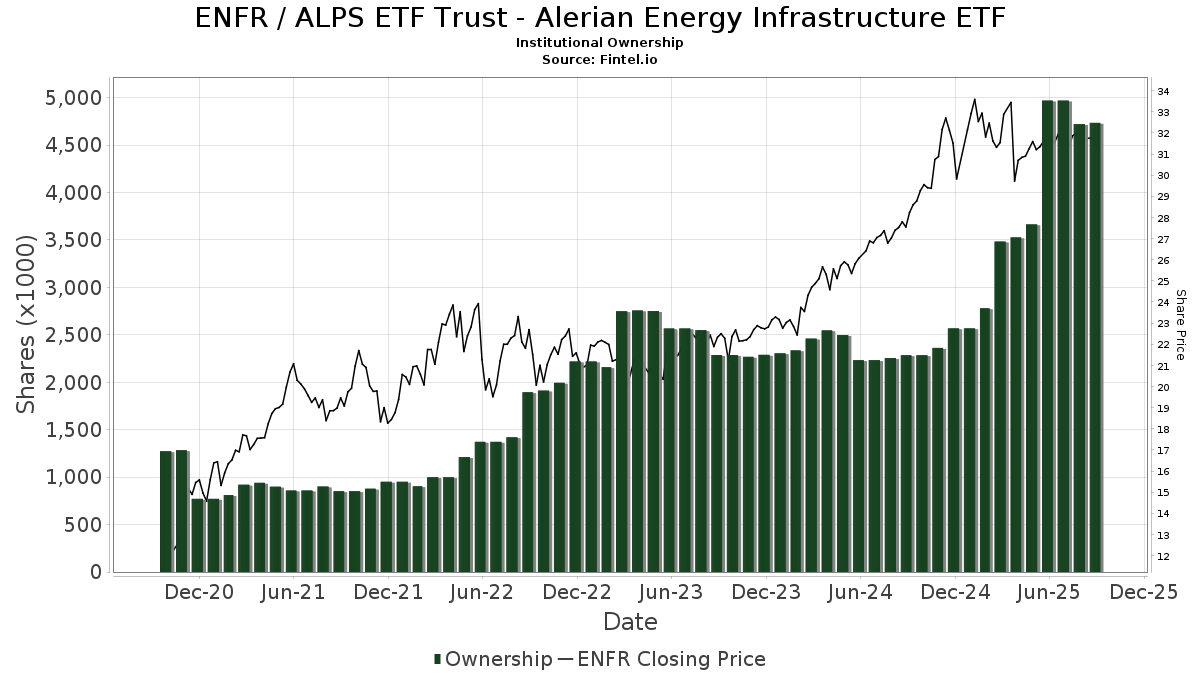
Institutionelt ejerskab og aktionærer
ALPS ETF Trust - Alerian Energy Infrastructure ETF (US:ENFR) har 105 institutionelle ejere og aktionærer, der har indsendt 13D/G- eller 13F-formularer til Securities Exchange Commission (SEC). Disse institutioner har i alt 5,123,673 aktier. Største aktionærer omfatter Raymond James Financial Inc, Wells Fargo & Company/mn, Morgan Stanley, LPL Financial LLC, Advisors Asset Management, Inc., Miller Howard Investments Inc /ny, Goldman Sachs Group Inc, WT Wealth Management, Bank Of America Corp /de/, and Mariner, LLC .
ALPS ETF Trust - Alerian Energy Infrastructure ETF (ARCA:ENFR) institutionel ejerskabsstruktur viser aktuelle positioner i virksomheden efter institutioner og fonde, samt seneste ændringer i positionsstørrelse. Større aktionærer kan omfatte individuelle investorer, investeringsforeninger, hedgefonde eller institutioner. Skema 13D angiver, at investoren besidder (eller besidder) mere end 5 % af virksomheden og har til hensigt (eller har til hensigt at) aktivt at forfølge en ændring i forretningsstrategi. Skema 13G indikerer en passiv investering på over 5%.
The share price as of March 27, 2026 is 39,01 / share. Previously, on March 28, 2025, the share price was 32,83 / share. This represents an increase of 18,82% over that period.
Fondens stemningsscore
Fund Sentiment Score (fka Ownership Accumulation Score) finder de aktier, der bliver mest købt af fonde. Det er resultatet af en sofistikeret, multi-faktor kvantitativ model, der identificerer virksomheder med de højeste niveauer af institutionel akkumulering. Scoringsmodellen bruger en kombination af den samlede stigning i oplyste ejere, ændringerne i porteføljeallokeringer i disse ejere og andre målinger. Tallet går fra 0 til 100, hvor højere tal indikerer et højere niveau af akkumulering for sine jævnaldrende, og 50 er gennemsnittet.
Opdateringsfrekvens: Dagligt
Se Ownership Explorer, som giver en liste over højest rangerende virksomheder.
AI+ Ask Fintel’s AI assistant about ALPS ETF Trust - Alerian Energy Infrastructure ETF.
Select a question to share a public post with an AI-crafted answer.
Thinking of good questions…
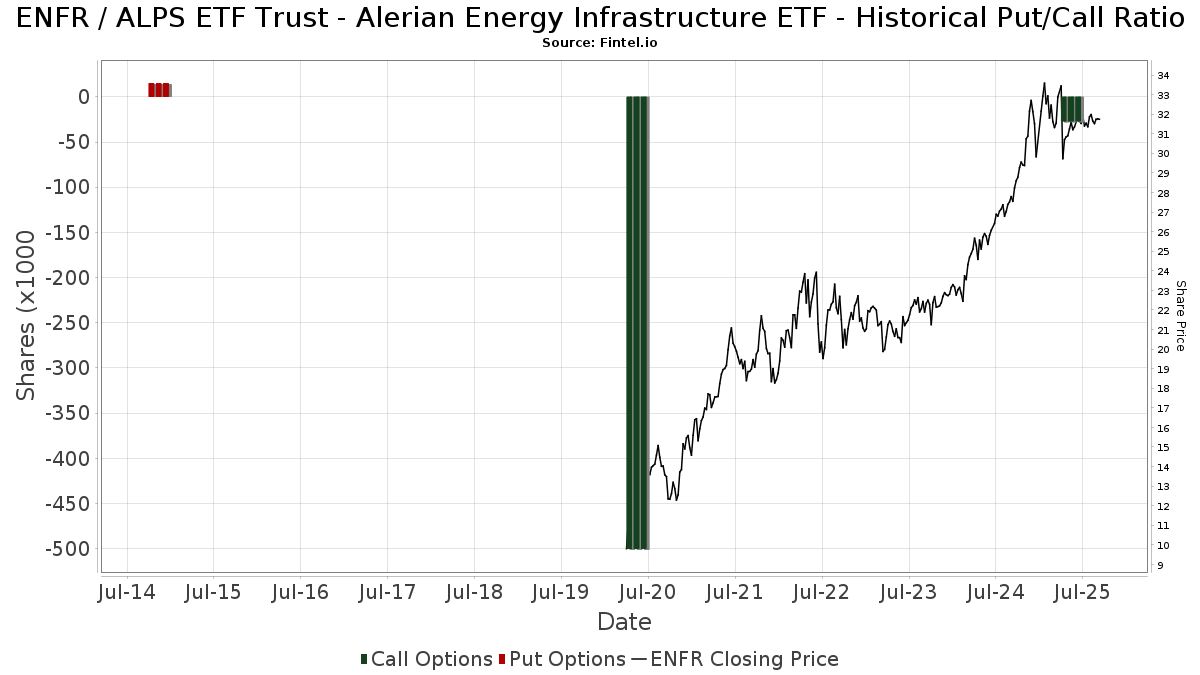
Institutionel Put/Call-forhold
Ud over at indberette standardaktie- og gældsudstedelser skal institutter med mere end 100 mill. aktiver under forvaltning også oplyse deres put- og call-optionsbeholdninger. Da salgsoptioner generelt indikerer negativ stemning, og købsoptioner indikerer positiv stemning, kan vi få en fornemmelse af den overordnede institutionelle stemning ved at plotte forholdet mellem put og kald. Diagrammet til højre viser det historiske put/call-forhold for dette instrument.
Brug af Put/Call Ratio som en indikator for investorernes stemning overvinder en af de vigtigste mangler ved at bruge totalt institutionelt ejerskab, som er, at en betydelig mængde af aktiver under forvaltning investeres passivt for at spore indekser. Passivt forvaltede fonde køber typisk ikke optioner, så indikatoren for put/call-forholdet følger mere nøje følelsen af aktivt forvaltede fonde.
13F og NPORT arkivering
Detaljer om 13F-arkivering er gratis. Detaljer om NP-ansøgninger kræver et premium-medlemskab. Grønne rækker angiver nye positioner. Røde rækker angiver lukkede positioner. Klik på linket ikon for at se den fulde transaktionshistorik.
Opgrader
for at låse premium-data op og eksportere til Excel ![]() .
.
| Fil dato | Kilde | Investor | Type | Gennemsnitlig pris (Øst) |
Aktier | Δ Aktier (%) |
Rapporteret Værdi ($1000) |
Δ Værdi (%) |
Port Alloc (%) |
|
|---|---|---|---|---|---|---|---|---|---|---|
| 2026-02-05 | 13F | Tfo-tdc, Llc | 51.121 | 0,00 | 1.608 | -2,90 | ||||
| 2026-02-12 | 13F | IFC & Insurance Marketing, Inc. | 314 | 0 | ||||||
| 2025-11-12 | 13F | Per Stirling Capital Management, LLC. | 0 | -100,00 | 0 | |||||
| 2026-02-10 | 13F | Fielder Capital Group LLC | 20.416 | 0,00 | 642 | -2,87 | ||||
| 2025-11-13 | 13F | Lavaca Capital Llc | Call | 0 | -100,00 | 0 | ||||
| 2026-02-23 | 13F | Virtu Financial LLC | 11.086 | 0 | ||||||
| 2026-02-10 | 13F | Envestnet Asset Management Inc | 53.402 | -7,55 | 1.680 | -10,31 | ||||
| 2026-02-17 | 13F | Fmr Llc | 1.709 | 18,85 | 54 | 15,22 | ||||
| 2026-01-14 | 13F | Northwest Wealth Management, Llc | 8.768 | -8,80 | 276 | -11,58 | ||||
| 2026-01-16 | 13F | Keystone Financial Group, Inc. | 6.266 | 419,14 | 197 | 405,13 | ||||
| 2026-02-24 | 13F | Astoria Portfolio Advisors LLC. | 21.016 | 763 | ||||||
| 2026-02-13 | 13F | Tcfg Wealth Management, Llc | 14.858 | 467 | ||||||
| 2026-01-28 | 13F | Milestone Asset Management, Llc | 0 | -100,00 | 0 | |||||
| 2026-02-12 | 13F | Summit Financial, LLC | 18.944 | -40,68 | 596 | -42,51 | ||||
| 2026-01-14 | 13F | Wolff Wiese Magana Llc | 118 | 0,00 | 4 | 0,00 | ||||
| 2026-01-28 | 13F | EPG Wealth Management LLC | 1.684 | 0,00 | 53 | -3,70 | ||||
| 2026-01-23 | 13F | Guidance Capital, Inc | 31.627 | 23,55 | 1.038 | 33,46 | ||||
| 2026-02-17 | 13F | Cetera Investment Advisers | 90.873 | -16,80 | 2.858 | -19,24 | ||||
| 2026-01-28 | 13F | Geneos Wealth Management Inc. | 818 | 0,00 | 26 | -3,85 | ||||
| 2026-01-21 | 13F | Capital Advisory Group Advisory Services, LLC | 43.788 | 0,26 | 1.377 | -2,69 | ||||
| 2026-01-29 | 13F | Comerica Bank | 12.653 | 133,28 | 398 | 127,43 | ||||
| 2026-01-27 | 13F | Miller Howard Investments Inc /ny | 217.385 | -0,30 | 6.838 | -3,24 | ||||
| 2026-02-17 | 13F | Greenline Partners, LLC | 43.866 | 1.380 | ||||||
| 2026-01-05 | 13F | GoalVest Advisory LLC | 230 | 0,00 | 7 | 0,00 | ||||
| 2026-02-12 | 13F | Triumph Capital Management | 431 | 0,00 | 14 | 0,00 | ||||
| 2026-02-06 | 13F | Pnc Financial Services Group, Inc. | 3.100 | 98 | ||||||
| 2026-02-17 | 13F | Raymond James Financial Inc | 538.799 | 19,56 | 16.948 | 16,03 | ||||
| 2026-02-12 | 13F | Commonwealth Equity Services, Llc | 8.621 | -17,02 | 271 | |||||
| 2026-02-13 | 13F | Tenzing Financial LLC | 54.816 | 1.724 | ||||||
| 2026-02-19 | 13F | Mcguire Capital Advisors Inc | 3.214 | 101 | ||||||
| 2026-01-28 | 13F | Fischer Investment Strategies, Llc | 0 | -100,00 | 0 | |||||
| 2026-02-13 | 13F | MAI Capital Management | 10.979 | -5,25 | 345 | -8,00 | ||||
| 2026-02-02 | 13F | WT Wealth Management | 199.315 | 4,61 | 6.269 | 1,52 | ||||
| 2026-02-17 | 13F | Jones Financial Companies Lllp | 796 | 104,10 | 25 | 108,33 | ||||
| 2026-02-12 | 13F | Steward Partners Investment Advisory, Llc | 1.777 | 0,00 | 56 | -3,51 | ||||
| 2026-01-08 | 13F | Wealth Enhancement Advisory Services, Llc | 73.091 | 5,12 | 2.250 | 0,72 | ||||
| 2026-01-27 | 13F | Rainey & Randall Investment Management Inc. | 28.654 | -1,21 | 901 | -4,15 | ||||
| 2026-01-09 | 13F | Dynamic Advisor Solutions LLC | 22.663 | -2,54 | 713 | -5,44 | ||||
| 2026-01-21 | 13F | Capital Advisors, Ltd. LLC | 1.030 | 0,00 | 0 | |||||
| 2026-01-23 | 13F | Gilliland Jeter Wealth Management LLC | 37.151 | -14,79 | 1.169 | -17,34 | ||||
| 2026-01-29 | 13F | Sanctuary Advisors, LLC | 85.587 | -33,68 | 2.692 | -35,63 | ||||
| 2026-02-20 | 13F | Sunbelt Securities, Inc. | 1.514 | 0,60 | 48 | -2,08 | ||||
| 2026-02-18 | 13F | Beacon Pointe Advisors, LLC | 28.104 | 28,43 | 884 | 24,54 | ||||
| 2026-02-12 | 13F | BlackRock, Inc. | 3.600 | 113 | ||||||
| 2026-01-21 | 13F | Sowell Financial Services LLC | 11.192 | -10,61 | 352 | -13,09 | ||||
| 2026-02-18 | 13F | Onyx Bridge Wealth Group LLC | 15.435 | 8,72 | 486 | 5,43 | ||||
| 2026-02-13 | 13F | Brasada Capital Management, Lp | 118.459 | -13,06 | 3.756 | -14,11 | ||||
| 2026-02-19 | 13F | CI Private Wealth, LLC | 82.923 | -3,42 | 2.608 | -6,25 | ||||
| 2025-11-12 | 13F | CIBC Bancorp USA Inc. | 18.524 | 600 | ||||||
| 2026-02-05 | 13F | Allworth Financial LP | 2.239 | 0,00 | 70 | -2,78 | ||||
| 2026-02-17 | 13F | Windsor Advisory Group, LLC | 0 | -100,00 | 0 | |||||
| 2026-02-17 | 13F | Royal Bank Of Canada | 8.126 | -1,90 | 256 | -4,48 | ||||
| 2026-01-08 | 13F | Fermata Advisors, LLC | 10.729 | -0,23 | 337 | -3,16 | ||||
| 2025-11-12 | 13F | Buckingham Strategic Partners | 0 | -100,00 | 0 | |||||
| 2026-01-27 | 13F | Summit Financial Wealth Advisors, LLC | 37.848 | 1.191 | ||||||
| 2026-02-12 | 13F | Advisors Asset Management, Inc. | 222.281 | 7,16 | 6.992 | 4,00 | ||||
| 2026-02-06 | 13F | Global Retirement Partners, LLC | 224 | 12,00 | 7 | 16,67 | ||||
| 2026-02-17 | 13F | Citadel Advisors Llc | 50.007 | 1.573 | ||||||
| 2026-01-12 | 13F | Bulwark Capital Corp | 16.564 | 110,85 | 521 | 105,12 | ||||
| 2026-02-06 | 13F | HighTower Advisors, LLC | 7.854 | 0,00 | 247 | -2,76 | ||||
| 2026-02-17 | 13F | BTG Pactual Asset Management US LLC | 0 | -100,00 | 0 | |||||
| 2026-02-11 | 13F | LPL Financial LLC | 315.542 | -14,09 | 9.925 | -16,62 | ||||
| 2026-02-06 | 13F | Larson Financial Group LLC | 0 | -100,00 | 0 | |||||
| 2026-02-19 | 13F | Atomi Financial Group, Inc. | 21.712 | 4,81 | 683 | 1,64 | ||||
| 2026-02-26 | 13F | Anchor Investment Management, LLC | 3.341 | 0,30 | 105 | -1,87 | ||||
| 2026-02-11 | 13F | XML Financial, LLC | 49.096 | -21,15 | 1.544 | -23,49 | ||||
| 2026-02-13 | 13F | SRS Capital Advisors, Inc. | 632 | 20 | ||||||
| 2025-11-05 | 13F | Caliber Wealth Management, LLC / KS | 0 | -100,00 | 0 | |||||
| 2026-02-06 | 13F | IFP Advisors, Inc | 5.257 | 0,40 | 165 | -2,37 | ||||
| 2026-01-14 | 13F | Spire Wealth Management | 508 | 1,20 | 16 | -6,25 | ||||
| 2026-02-10 | 13F | Goldman Sachs Group Inc | 200.019 | 6.292 | ||||||
| 2026-02-12 | 13F | Brinker Capital Investments, LLC | 0 | -100,00 | 0 | |||||
| 2026-02-02 | 13F | CX Institutional | 301 | 1,35 | 0 | |||||
| 2026-02-12 | 13F | Principal Securities, Inc. | 0 | -100,00 | 0 | -100,00 | ||||
| 2026-02-13 | 13F | 10Elms LLP | 7.300 | -6,41 | 230 | -9,13 | ||||
| 2026-01-26 | 13F | Cwm, Llc | 14.865 | 1,36 | 0 | |||||
| 2026-02-17 | 13F | SageView Advisory Group, LLC | 600 | 19 | ||||||
| 2026-02-05 | 13F | Castle Rock Wealth Management, LLC | 99.051 | -1,31 | 3.360 | 4,19 | ||||
| 2026-02-13 | 13F | Stifel Financial Corp | 83.836 | 33,56 | 2.637 | 29,65 | ||||
| 2026-02-02 | 13F | Fifth Third Bancorp | 2.000 | 0,00 | 63 | -3,12 | ||||
| 2026-01-21 | 13F | Sound Income Strategies, LLC | 1.441 | 47 | ||||||
| 2026-01-30 | 13F | Safe Harbor Family Capital, LLC | 89.731 | 2.822 | ||||||
| 2026-01-23 | 13F | Valley National Advisers Inc | 3.130 | 0,00 | 0 | |||||
| 2026-01-06 | 13F | Fulcrum Equity Management | 0 | -100,00 | 0 | |||||
| 2026-01-21 | 13F | Kraematon Investment Advisors, Inc | 50.652 | -0,59 | 1.593 | -3,51 | ||||
| 2026-02-04 | 13F | Ameritas Advisory Services, LLC | 0 | -100,00 | 0 | |||||
| 2026-02-13 | 13F | Mariner, LLC | 186.913 | -1,02 | 5.879 | -3,94 | ||||
| 2026-02-17 | 13F | Bank Of America Corp /de/ | 196.851 | 6,60 | 6.192 | 3,46 | ||||
| 2026-02-17 | 13F | Blair William & Co/il | 475 | 0,00 | 15 | -6,67 | ||||
| 2026-02-09 | 13F | Prospera Financial Services Inc | 12.048 | 59,62 | 379 | 54,92 | ||||
| 2026-02-13 | 13F | Gts Securities Llc | 0 | -100,00 | 0 | -100,00 | ||||
| 2026-02-17 | 13F | Advisor Group Holdings, Inc. | 39.691 | -5,27 | 1.249 | -7,41 | ||||
| 2026-02-17 | 13F | Ameriflex Group, Inc. | 0 | -100,00 | 0 | |||||
| 2026-01-29 | 13F | UBS Group AG | 61.975 | 14,12 | 1.949 | 10,74 | ||||
| 2026-01-23 | 13F | Rsm Us Wealth Management Llc | 24.782 | 0,85 | 783 | -1,76 | ||||
| 2026-02-17 | 13F | Angeles Wealth Management, Llc | 0 | -100,00 | 0 | |||||
| 2026-02-13 | 13F | Wells Fargo & Company/mn | 383.797 | 3,35 | 12.072 | 0,31 | ||||
| 2026-02-17 | 13F | Ameriprise Financial Inc | 110.841 | -22,48 | 3.486 | -24,66 | ||||
| 2026-02-11 | 13F | O'shaughnessy Asset Management, Llc | 2.413 | -0,86 | 76 | -3,85 | ||||
| 2026-02-14 | 13F | Rockefeller Capital Management L.P. | 23.583 | 0,80 | 742 | -2,24 | ||||
| 2026-01-23 | 13F | U.S. Capital Wealth Advisors, LLC | 75.281 | -2,63 | 2.368 | -5,51 | ||||
| 2026-01-13 | 13F | Dakota Wealth Management | 17.154 | 540 | ||||||
| 2026-02-12 | 13F | Insigneo Advisory Services, Llc | 10.991 | -2,91 | 346 | -5,74 | ||||
| 2026-02-10 | 13F | Bank of New York Mellon Corp | 0 | -100,00 | 0 | |||||
| 2025-11-14 | 13F | WNY Asset Management, LLC | 40.526 | -33,34 | 1.313 | -33,01 | ||||
| 2026-01-30 | 13F | Wealthfront Advisers Llc | 25.930 | 36,91 | 816 | 32,95 | ||||
| 2026-02-13 | 13F | Kestra Advisory Services, LLC | 8.135 | 256 | ||||||
| 2026-01-21 | 13F | Newbridge Financial Services Group, Inc. | 0 | -100,00 | 0 | |||||
| 2026-01-30 | 13F | Bogart Wealth, LLC | 107 | 0,94 | 3 | 0,00 | ||||
| 2025-12-16 | 13F | Lindenwold Advisors | 16.803 | 545 | ||||||
| 2026-02-03 | 13F | Strengthening Families & Communities, LLC | 347 | 594,00 | 11 | 900,00 | ||||
| 2026-01-14 | 13F | Moisand Fitzgerald Tamayo, LLC | 500 | 0,00 | 16 | -6,25 | ||||
| 2026-02-12 | 13F | Jane Street Group, Llc | 88.440 | 406,12 | 2.782 | 391,34 | ||||
| 2026-01-16 | 13F | Ronald Blue Trust, Inc. | 100 | -13,04 | 3 | 0,00 | ||||
| 2026-02-05 | 13F | Cambridge Investment Research Advisors, Inc. | 42.423 | 5,69 | 1 | 0,00 | ||||
| 2026-02-17 | 13F | Private Advisor Group, LLC | 9.786 | 21,14 | 308 | 17,62 | ||||
| 2026-02-06 | 13F | Keudell/Morrison Wealth Management | 7.000 | -20,90 | 220 | -22,81 | ||||
| 2026-01-22 | 13F | Glass Jacobson Investment Advisors llc | 12.683 | -34,69 | 399 | -36,72 | ||||
| 2026-02-17 | 13F | MGB Wealth Management, LLC | 1.750 | 75,00 | 55 | 71,88 | ||||
| 2026-02-13 | 13F | Morgan Stanley | 318.230 | -0,79 | 10.010 | -3,72 | ||||
| 2025-10-29 | 13F | Custom Index Systems, Llc | 0 | -100,00 | 0 | |||||
| 2026-02-14 | 13F | Pointe Capital Management LLC | 0 | -100,00 | 0 | |||||
| 2026-02-12 | 13F | CIBC Private Wealth Group, LLC | 18.524 | 0,00 | 583 | -3,00 | ||||
| 2026-02-18 | 13F | GWM Advisors LLC | 28.577 | 10,61 | 899 | 7,29 | ||||
| 2026-02-17 | 13F | Susquehanna International Group, Llp | 51.414 | 1.617 |