Grundlæggende statistik
| Institutionelle aktier (lange) | 55.938.080 - 20,21% (ex 13D/G) - change of -12,36MM shares -18,09% MRQ |
| Institutionel værdi (lang) | $ 733.480 USD ($1000) |
Institutionelt ejerskab og aktionærer
Trump Media & Technology Group Corp. (US:DJT) har 360 institutionelle ejere og aktionærer, der har indsendt 13D/G- eller 13F-formularer til Securities Exchange Commission (SEC). Disse institutioner har i alt 55,938,080 aktier. Største aktionærer omfatter Vanguard Group Inc, BlackRock, Inc., Yorkville Advisors Global, LP, Citadel Advisors Llc, Susquehanna International Group, Llp, Geode Capital Management, Llc, State Street Corp, Citadel Advisors Llc, Two Sigma Investments, Lp, and Susquehanna International Group, Llp .
Trump Media & Technology Group Corp. (NasdaqGM:DJT) institutionel ejerskabsstruktur viser aktuelle positioner i virksomheden efter institutioner og fonde, samt seneste ændringer i positionsstørrelse. Større aktionærer kan omfatte individuelle investorer, investeringsforeninger, hedgefonde eller institutioner. Skema 13D angiver, at investoren besidder (eller besidder) mere end 5 % af virksomheden og har til hensigt (eller har til hensigt at) aktivt at forfølge en ændring i forretningsstrategi. Skema 13G indikerer en passiv investering på over 5%.
The share price as of April 24, 2026 is 9,35 / share. Previously, on April 28, 2025, the share price was 25,83 / share. This represents a decline of 63,80% over that period.

Fondens stemningsscore
Fund Sentiment Score (fka Ownership Accumulation Score) finder de aktier, der bliver mest købt af fonde. Det er resultatet af en sofistikeret, multi-faktor kvantitativ model, der identificerer virksomheder med de højeste niveauer af institutionel akkumulering. Scoringsmodellen bruger en kombination af den samlede stigning i oplyste ejere, ændringerne i porteføljeallokeringer i disse ejere og andre målinger. Tallet går fra 0 til 100, hvor højere tal indikerer et højere niveau af akkumulering for sine jævnaldrende, og 50 er gennemsnittet.
Opdateringsfrekvens: Dagligt
Se Ownership Explorer, som giver en liste over højest rangerende virksomheder.
AI+ Ask Fintel’s AI assistant about Trump Media & Technology Group Corp..
Select a question to share a public post with an AI-crafted answer.
Thinking of good questions…
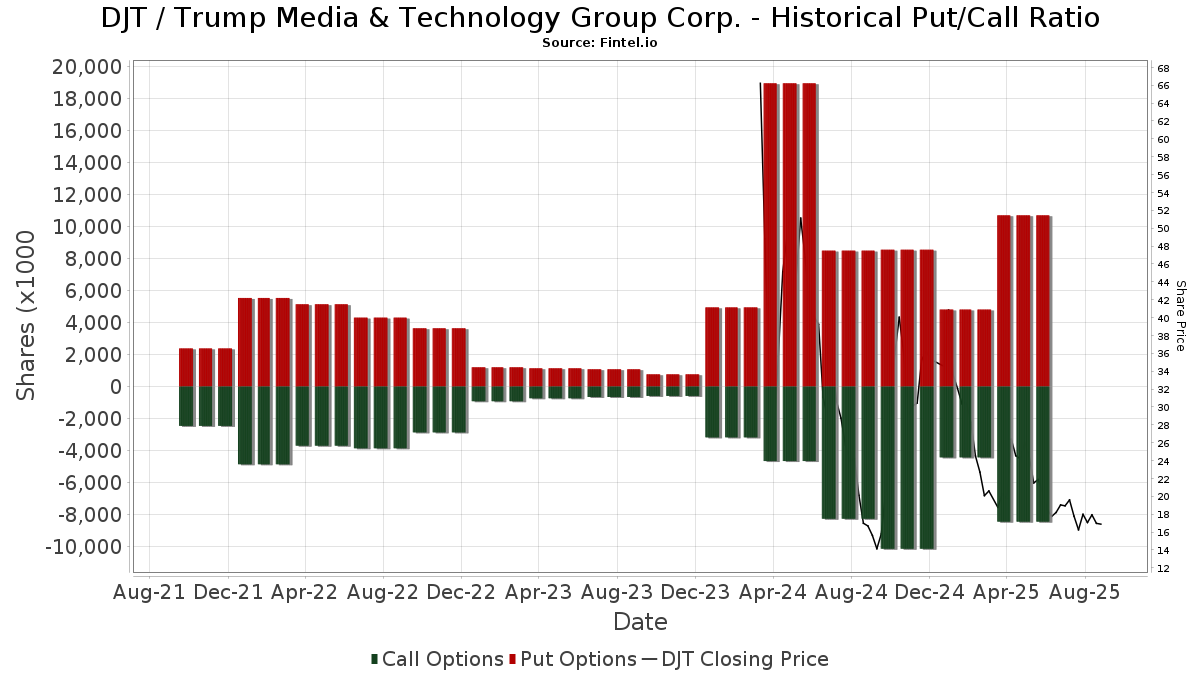
Institutionel Put/Call-forhold
Ud over at indberette standardaktie- og gældsudstedelser skal institutter med mere end 100 mill. aktiver under forvaltning også oplyse deres put- og call-optionsbeholdninger. Da salgsoptioner generelt indikerer negativ stemning, og købsoptioner indikerer positiv stemning, kan vi få en fornemmelse af den overordnede institutionelle stemning ved at plotte forholdet mellem put og kald. Diagrammet til højre viser det historiske put/call-forhold for dette instrument.
Brug af Put/Call Ratio som en indikator for investorernes stemning overvinder en af de vigtigste mangler ved at bruge totalt institutionelt ejerskab, som er, at en betydelig mængde af aktiver under forvaltning investeres passivt for at spore indekser. Passivt forvaltede fonde køber typisk ikke optioner, så indikatoren for put/call-forholdet følger mere nøje følelsen af aktivt forvaltede fonde.
13D/G-arkivering
Vi præsenterer 13D/G ansøgninger separat fra 13F ansøgninger på grund af den forskellige behandling af SEC. 13D/G-ansøgninger kan indgives af grupper af investorer (med én ledende), hvorimod 13F-ansøgninger ikke kan. Dette resulterer i situationer, hvor en investor kan indsende en 13D/G, der rapporterer én værdi for de samlede aktier (der repræsenterer alle de aktier, der ejes af investorgruppen), men derefter indsender en 13F, der rapporterer en anden værdi for de samlede aktier (der udelukkende repræsenterer deres egne) ejendomsret). Det betyder, at aktieejerskab af 13D/G-arkiver og 13F-arkiveringer ofte ikke er direkte sammenlignelige, så vi præsenterer dem separat.
Bemærk: Fra den 16. maj 2021 viser vi ikke længere ejere, der ikke har indsendt en 13D/G inden for det seneste år. Tidligere viste vi den fulde historie af 13D/G-arkiver. Generelt skal enheder, der er forpligtet til at indgive 13D/G-ansøgninger, indgive mindst årligt, før de indsender en afsluttende ansøgning. Dog forlader fonde nogle gange positioner uden at indsende en afsluttende ansøgning (dvs. de afvikler), så visning af den fulde historie resulterede nogle gange i forvirring om det nuværende ejerskab. For at undgå forvirring viser vi nu kun 'aktuelle' ejere - det vil sige - ejere, der har anmeldt inden for det seneste år.
Upgrade to unlock premium data.
| Fil dato | Form | Investor | Forrige Aktier |
Seneste Aktier |
Δ Aktier (Procent) |
Ejendomsret (Procent) |
Δ Ejerskab (Procent) |
|
|---|---|---|---|---|---|---|---|---|
| 2025-12-22 | TRUMP DONALD J | 114,750,000 | 114,750,000 | 0.00 | 41.50 | -21.55 | ||
| 2025-11-13 | JANE STREET GROUP, LLC | 15,085,643 | 10,213,390 | -32.30 | 3.70 | -31.48 | ||
| 2025-10-31 | VANGUARD GROUP INC | 14,834,151 | 5.35 |
13F og NPORT arkivering
Detaljer om 13F-arkivering er gratis. Detaljer om NP-ansøgninger kræver et premium-medlemskab. Grønne rækker angiver nye positioner. Røde rækker angiver lukkede positioner. Klik på linket ikon for at se den fulde transaktionshistorik.
Opgrader
for at låse premium-data op og eksportere til Excel ![]() .
.
| Fil dato | Kilde | Investor | Type | Gennemsnitlig pris (Øst) |
Aktier | Δ Aktier (%) |
Rapporteret Værdi ($1000) |
Δ Værdi (%) |
Port Alloc (%) |
|
|---|---|---|---|---|---|---|---|---|---|---|
| 2026-02-19 | 13F | Mcguire Capital Advisors Inc | 760 | 10 | ||||||
| 2026-04-02 | 13F | Noble Wealth Management PBC | 25 | 0 | ||||||
| 2026-02-17 | 13F | Fairscale Capital, LLC | 30 | 0,00 | 0 | |||||
| 2026-04-17 | 13F | IFC & Insurance Marketing, Inc. | 0 | -100,00 | 0 | |||||
| 2026-02-06 | 13F | EverSource Wealth Advisors, LLC | 3.708 | -3,59 | 49 | -22,22 | ||||
| 2026-02-13 | 13F | Sei Investments Co | 19.208 | 0,00 | 254 | -19,37 | ||||
| 2026-02-12 | 13F | Ci Investments Inc. | 0 | -100,00 | 0 | |||||
| 2026-04-21 | 13F | SLT Holdings LLC | 0 | -100,00 | 0 | |||||
| 2026-02-06 | 13F | Larson Financial Group LLC | 3.104 | 70,74 | 41 | 41,38 | ||||
| 2026-02-11 | 13F | T3 Companies, LLC | Call | 27.700 | 2 | |||||
| 2026-02-02 | 13F | Fifth Third Bancorp | 20 | 0 | ||||||
| 2026-02-13 | 13F | Kestra Advisory Services, LLC | 0 | -100,00 | 0 | |||||
| 2026-01-23 | 13F | Assetmark, Inc | 5 | -16,67 | 0 | |||||
| 2026-02-13 | 13F | Squarepoint Ops LLC | 0 | -100,00 | 0 | -100,00 | ||||
| 2026-02-27 | 13F | Strategic Investment Solutions, Inc. /IL | 0 | -100,00 | 0 | |||||
| 2026-02-23 | 13F | Beaird Harris Wealth Management, LLC | 85 | 0,00 | 1 | 0,00 | ||||
| 2025-11-12 | 13F | HAP Trading, LLC | Put | 658.400 | 281 | |||||
| 2026-04-13 | 13F | Wolff Wiese Magana Llc | 475 | 0,00 | 4 | -33,33 | ||||
| 2025-11-12 | 13F | HAP Trading, LLC | Call | 646.500 | 375 | |||||
| 2025-11-14 | 13F | Capstone Investment Advisors, Llc | 17.126 | 0,00 | 281 | -8,77 | ||||
| 2026-02-17 | 13F | Wellington Management Group Llp | 0 | -100,00 | 0 | |||||
| 2026-01-30 | 13F | R Squared Ltd | 0 | -100,00 | 0 | |||||
| 2026-02-17 | 13F | Hbk Investments L P | Put | 0 | -100,00 | 0 | -100,00 | |||
| 2025-11-14 | 13F | Atom Investors LP | 0 | -100,00 | 0 | |||||
| 2026-01-30 | 13F | Caldwell Securities, Inc | 50 | 0,00 | 1 | |||||
| 2026-02-17 | 13F | Hbk Investments L P | 0 | -100,00 | 0 | -100,00 | ||||
| 2026-04-08 | 13F | Wealth Enhancement Trust Services, Inc. | 148 | 0,00 | 1 | 0,00 | ||||
| 2025-11-05 | 13F | Optimize Financial Inc | 0 | -100,00 | 0 | |||||
| 2025-11-14 | 13F | Schonfeld Strategic Advisors LLC | 0 | -100,00 | 0 | |||||
| 2026-02-17 | 13F | RK Capital Management, LLC/FL | 0 | -100,00 | 0 | |||||
| 2026-02-02 | 13F | Chung Wu Investment Group, LLC | 420 | 366,67 | 6 | 400,00 | ||||
| 2026-02-11 | 13F | Simplex Trading, Llc | 0 | -100,00 | 0 | |||||
| 2026-04-22 | 13F | Sterling Capital Management LLC | 3.091 | -37,74 | 29 | -56,92 | ||||
| 2025-11-13 | 13F | Capital Fund Management S.a. | Call | 0 | -100,00 | 0 | -100,00 | |||
| 2026-04-20 | 13F | Ronald Blue Trust, Inc. | 5.472 | 10,06 | 51 | -23,08 | ||||
| 2026-02-13 | 13F | Marathon Trading Investment Management LLC | 16.199 | -57,36 | 214 | -65,65 | ||||
| 2026-02-13 | 13F | Public Employees Retirement Association Of Colorado | 15.330 | 0,00 | 0 | |||||
| 2026-02-13 | 13F | Police & Firemen's Retirement System of New Jersey | 68.845 | -3,17 | 912 | -21,94 | ||||
| 2026-02-20 | 13F | Sunbelt Securities, Inc. | 107 | 0,00 | 1 | 0,00 | ||||
| 2026-02-10 | 13F | IAG Wealth Partners, LLC | 156 | 0,00 | 2 | 0,00 | ||||
| 2026-04-15 | 13F | Activest Wealth Management | 500 | 0,00 | 5 | -33,33 | ||||
| 2025-10-28 | 13F | CarsonAllaria Wealth Management, Ltd. | 0 | -100,00 | 0 | |||||
| 2026-02-17 | 13F | Private Advisor Group, LLC | 14.150 | -7,25 | 187 | -25,20 | ||||
| 2026-02-04 | 13F | Fourth Dimension Wealth, LLC | 25 | 0,00 | 0 | |||||
| 2026-01-07 | 13F | Corsicana & Co. | 345 | 5 | ||||||
| 2026-02-17 | 13F | Tudor Investment Corp Et Al | Call | 10.000 | 132 | |||||
| 2026-04-23 | 13F | Private Wealth Management Group, LLC | 0 | -100,00 | 0 | |||||
| 2026-02-13 | 13F | Sofos Investments, Inc. | 100 | 0,00 | 1 | 0,00 | ||||
| 2026-02-10 | 13F | Goldman Sachs Group Inc | Put | 0 | -100,00 | 0 | -100,00 | |||
| 2026-01-16 | 13F | Crewe Advisors LLC | 54 | 0,00 | 1 | |||||
| 2026-02-13 | 13F | JustInvest LLC | 12.866 | 170 | ||||||
| 2026-02-02 | 13F | Wolverine Asset Management Llc | Put | 734.100 | 71,20 | 9.719 | 38,05 | |||
| 2026-02-17 | 13F | Css Llc/il | Put | 44.400 | 18,72 | 588 | -4,40 | |||
| 2026-02-17 | 13F | Css Llc/il | 7.881 | -9,22 | 104 | -26,76 | ||||
| 2026-02-11 | 13F | CNB Bank | 5 | 0,00 | 0 | |||||
| 2025-11-14 | 13F | Boothbay Fund Management, Llc | Call | 0 | -100,00 | 0 | ||||
| 2026-02-17 | 13F | Hbk Investments L P | Call | 60.600 | 802 | |||||
| 2026-02-17 | 13F | Engineers Gate Manager LP | 27.831 | 10,01 | 368 | -11,33 | ||||
| 2026-02-13 | 13F | Umb Bank N A/mo | 16 | 0 | ||||||
| 2026-02-10 | 13F | Bank of New York Mellon Corp | 415.871 | 24,69 | 5.506 | 0,55 | ||||
| 2025-11-03 | 13F | Tidemark, LLC | 0 | -100,00 | 0 | |||||
| 2026-02-11 | 13F | Jpmorgan Chase & Co | 150.445 | 125,81 | 1.992 | 82,16 | ||||
| 2026-02-12 | 13F | Marex Group plc | 70.635 | 935 | ||||||
| 2026-02-17 | 13F | LMR Partners LLP | Put | 25.500 | 0,00 | 338 | -19,38 | |||
| 2026-02-17 | 13F | Captrust Financial Advisors | 27.356 | 7,94 | 362 | -12,98 | ||||
| 2026-02-13 | 13F | Walleye Trading LLC | Call | 115.300 | -3,51 | 1.527 | -22,22 | |||
| 2026-02-13 | 13F | Walleye Trading LLC | 157.867 | 316,44 | 2.090 | 236,01 | ||||
| 2026-01-23 | 13F | First PREMIER Bank | 0 | -100,00 | 0 | |||||
| 2026-02-05 | 13F | Amalgamated Bank | 10.658 | -0,35 | 0 | |||||
| 2026-02-03 | 13F | SBI Securities Co., Ltd. | 8.675 | 15,65 | 115 | -7,32 | ||||
| 2026-02-11 | 13F | Parallel Advisors, LLC | 1.593 | -11,84 | 21 | -27,59 | ||||
| 2026-02-13 | 13F | Walleye Trading LLC | Put | 102.800 | -35,55 | 1.361 | -48,01 | |||
| 2026-02-17 | 13F | Advisor Group Holdings, Inc. | 43.125 | -8,85 | 571 | -29,46 | ||||
| 2026-02-05 | 13F | Center for Financial Planning, Inc. | 14.805 | 59,19 | 196 | 28,95 | ||||
| 2025-11-14 | 13F/A | Skopos Labs, Inc. | 0 | -100,00 | 0 | -100,00 | ||||
| 2025-11-21 | 13F | Bell Investment Advisors, Inc | 0 | -100,00 | 0 | |||||
| 2026-02-14 | 13F | Rockefeller Capital Management L.P. | 0 | -100,00 | 0 | |||||
| 2025-11-14 | 13F | Virtu Financial LLC | 0 | -100,00 | 0 | |||||
| 2026-02-06 | 13F | Handelsbanken Fonder AB | 41.800 | 77,87 | 1 | |||||
| 2026-02-26 | 13F/A | Alpine Global Management, LLC | 304.858 | -71,99 | 4.036 | -77,41 | ||||
| 2025-11-14 | 13F | LMR Partners LLP | Call | 0 | -100,00 | 0 | -100,00 | |||
| 2026-01-30 | 13F | Bogart Wealth, LLC | 852 | 660,71 | 11 | 1.000,00 | ||||
| 2026-02-17 | 13F | Price T Rowe Associates Inc /md/ | 133.635 | 31,47 | 2 | 0,00 | ||||
| 2026-01-23 | 13F | Avion Wealth | 126 | -28,41 | 0 | |||||
| 2026-02-06 | 13F | Pnc Financial Services Group, Inc. | 3.185 | -41,93 | 42 | -53,33 | ||||
| 2026-02-05 | 13F | HighMark Wealth Management LLC | 577 | 0,00 | 8 | -22,22 | ||||
| 2026-04-13 | 13F | True Wealth Design, LLC | 137 | 1 | ||||||
| 2026-01-29 | 13F | Quent Capital, LLC | 198 | 235,59 | 3 | |||||
| 2026-02-09 | 13F | Harbour Investments, Inc. | 2.181 | 5,31 | 29 | -17,65 | ||||
| 2026-02-12 | 13F | BlackRock, Inc. | 8.157.085 | 5,03 | 108.000 | -15,31 | ||||
| 2026-02-17 | 13F/A | RBF Capital, LLC | Put | 80.200 | 0,00 | 1.062 | -19,38 | |||
| 2026-02-10 | 13F | Bnp Paribas Arbitrage, Sa | 10.604 | -28,90 | 140 | -42,62 | ||||
| 2026-01-29 | 13F | Concord Wealth Partners | 139 | 110,61 | 2 | 0,00 | ||||
| 2026-02-13 | 13F | MAI Capital Management | 13.054 | -12,12 | 173 | -29,22 | ||||
| 2026-01-05 | 13F | GoalVest Advisory LLC | 0 | -100,00 | 0 | -100,00 | ||||
| 2026-02-13 | 13F | Flow Traders U.s. Llc | 63.771 | 1 | ||||||
| 2026-04-22 | 13F | Stone House Investment Management, LLC | 286 | 0,00 | 3 | -33,33 | ||||
| 2026-02-13 | 13F | Sculptor Capital LP | 22.500 | 0,00 | 298 | -19,51 | ||||
| 2026-02-13 | 13F | Sculptor Capital LP | Put | 765.100 | 5,34 | 10.130 | -15,06 | |||
| 2026-02-06 | 13F | Axxcess Wealth Management, Llc | 50.201 | 24,88 | 665 | 0,61 | ||||
| 2026-01-28 | 13F | Arizona State Retirement System | 46.527 | -5,43 | 616 | -23,67 | ||||
| 2026-01-21 | 13F | Sound Income Strategies, LLC | 5.607 | 30,12 | 78 | 5,48 | ||||
| 2026-02-12 | 13F | MetLife Investment Management, LLC | 6.819 | 0,38 | 90 | -18,92 | ||||
| 2026-04-08 | 13F | Grove Bank & Trust | 10 | 0,00 | 0 | |||||
| 2026-04-13 | 13F | IFP Advisors, Inc | 6.076 | -1,32 | 56 | -30,86 | ||||
| 2026-02-13 | 13F | Wells Fargo & Company/mn | 32.647 | 64,88 | 432 | 32,92 | ||||
| 2026-02-06 | 13F | Global Retirement Partners, LLC | 3.728 | 89,24 | 49 | 53,13 | ||||
| 2025-11-13 | 13F | Total Investment Management Inc | 0 | -100,00 | 0 | |||||
| 2026-02-11 | 13F | LPL Financial LLC | 129.686 | -9,29 | 1.717 | -26,84 | ||||
| 2026-02-17 | 13F | Janus Henderson Group Plc | 71.000 | 0,00 | 941 | -19,23 | ||||
| 2026-02-12 | 13F | Ankerstar Wealth, LLC | 62 | 1 | ||||||
| 2026-01-26 | 13F | Ckw Financial Group | 162 | 0,00 | 0 | |||||
| 2026-01-26 | 13F | Cwm, Llc | 9.174 | 40,55 | 0 | |||||
| 2026-01-20 | 13F | Nvwm, Llc | 14 | 0,00 | 0 | |||||
| 2025-11-14 | 13F | Fort Baker Capital Management LP | 0 | -100,00 | 0 | |||||
| 2026-02-10 | 13F | KERR FINANCIAL PLANNING Corp | 4.161 | -8,69 | 47 | -6,12 | ||||
| 2026-01-28 | 13F | Geneos Wealth Management Inc. | 1.653 | 0,00 | 22 | -22,22 | ||||
| 2026-04-17 | 13F | Vermillion Wealth Management, Inc. | 53 | 0,00 | 0 | |||||
| 2026-04-07 | 13F | Farther Finance Advisors, LLC | 926 | 206,62 | 8 | 166,67 | ||||
| 2026-02-17 | 13F | Susquehanna International Group, Llp | Call | 2.380.100 | -31,99 | 31.513 | -45,16 | |||
| 2026-02-17 | 13F | Susquehanna International Group, Llp | 1.645.161 | -18,36 | 21.782 | -34,18 | ||||
| 2026-02-17 | 13F | Susquehanna International Group, Llp | Put | 3.347.300 | -21,93 | 44.318 | -37,05 | |||
| 2026-01-15 | 13F | Nisa Investment Advisors, Llc | 2 | 0 | ||||||
| 2026-02-18 | 13F | Vermillion & White Wealth Management Group, LLC | 2.164 | 0,00 | 29 | -20,00 | ||||
| 2026-02-13 | 13F | Clear Street Group Inc. | 1.297.062 | 323.356,86 | 17.173 | 286.116,67 | ||||
| 2026-04-14 | 13F | Tradewinds Capital Management, LLC | 1.651 | 153,61 | 15 | 87,50 | ||||
| 2026-02-13 | 13F | Rhumbline Advisers | 129.140 | -2,67 | 1.710 | -21,53 | ||||
| 2026-02-17 | 13F | Creative Planning | 40.812 | 7,47 | 540 | -13,32 | ||||
| 2026-01-16 | 13F | FNY Investment Advisers, LLC | Call | 0 | -100,00 | 0 | ||||
| 2026-02-17 | 13F | Capstone Financial Advisors, Inc. | 0 | -100,00 | 0 | |||||
| 2026-02-09 | 13F | Hartland & Co., LLC | 161 | 0,00 | 2 | 0,00 | ||||
| 2026-02-17 | 13F | Quantinno Capital Management LP | 99.515 | 809,48 | 1.318 | 635,75 | ||||
| 2026-02-11 | 13F | Ameritas Investment Partners, Inc. | 50 | 1 | ||||||
| 2026-02-13 | 13F | Parkside Financial Bank & Trust | 122 | 4,27 | 2 | 0,00 | ||||
| 2026-04-08 | 13F | Wealth Enhancement Advisory Services, Llc | 26.648 | 101,03 | 245 | 29,10 | ||||
| 2026-02-17 | 13F | Optiver Holding B.V. | 0 | -100,00 | 0 | |||||
| 2025-11-07 | 13F | Beacon Capital Management, LLC | 0 | -100,00 | 0 | |||||
| 2026-04-07 | 13F | Eastern Bank | 130 | 0,00 | 1 | 0,00 | ||||
| 2026-02-17 | 13F | Saba Capital Management, L.P. | 343.802 | -11,57 | 4.552 | -28,71 | ||||
| 2026-04-21 | 13F | Trueblood Wealth Management, LLC | 35.047 | 248,83 | 325 | 144,36 | ||||
| 2026-02-17 | 13F | D. E. Shaw & Co., Inc. | 74.203 | 982 | ||||||
| 2026-02-12 | 13F | Eight 31 Financial Llc | 13.817 | 0,00 | 183 | -19,47 | ||||
| 2026-02-05 | 13F | Allworth Financial LP | 4.169 | 13,23 | 55 | -8,33 | ||||
| 2026-02-17 | 13F | Two Sigma Securities, Llc | 11.714 | 155 | ||||||
| 2026-02-04 | 13F | LRI Investments, LLC | 250 | 0,00 | 3 | -25,00 | ||||
| 2026-02-09 | 13F | Legal & General Group Plc | 143.026 | -22,77 | 1.894 | -37,75 | ||||
| 2026-02-17 | 13F | Algert Global Llc | 0 | -100,00 | 0 | |||||
| 2026-02-17 | 13F | Brevan Howard Capital Management LP | 0 | -100,00 | 0 | |||||
| 2026-04-06 | 13F | Versant Capital Management, Inc | 773 | 7 | ||||||
| 2026-04-13 | 13F | Mather Group, Llc. | 10 | 0 | ||||||
| 2026-01-29 | 13F | RMG Wealth Management LLC | 34 | 0,00 | 0 | |||||
| 2026-04-22 | 13F | JNBA Financial Advisors | 442 | 0,00 | 4 | -20,00 | ||||
| 2026-02-17 | 13F | Greenland Capital Management LP | Put | 165.000 | 2.185 | |||||
| 2026-04-07 | 13F | CoreCap Advisors, LLC | 859 | 6,18 | 8 | -30,00 | ||||
| 2026-02-12 | 13F | Nuveen, LLC | 346.147 | 29,56 | 4.583 | 4,85 | ||||
| 2026-02-11 | 13F | Commonwealth Retirement Investments LLC | 10 | 0 | ||||||
| 2026-04-17 | 13F | AdvisorNet Financial, Inc | 187 | 156,16 | 2 | |||||
| 2025-10-30 | 13F | WFA Asset Management Corp | 217 | 0,00 | 3 | -57,14 | ||||
| 2026-02-13 | 13F | Centiva Capital, LP | Call | 12.500 | 150,00 | 166 | 101,22 | |||
| 2026-02-13 | 13F | Manufacturers Life Insurance Company, The | 0 | -100,00 | 0 | |||||
| 2026-02-17 | 13F | Man Group plc | 108.488 | -84,59 | 1.436 | -87,58 | ||||
| 2026-01-05 | 13F | Chesapeake Asset Management Llc | 3 | 0,00 | 0 | |||||
| 2026-02-10 | 13F | Foundations Investment Advisors, LLC | 19.538 | 259 | ||||||
| 2026-04-09 | 13F | Pacifica Partners Inc. | 50 | 0,00 | 0 | |||||
| 2026-02-12 | 13F | Xponance, Inc. | 16.702 | 3,18 | 221 | -16,60 | ||||
| 2026-04-24 | 13F | Luminist Capital LLC | 0 | -100,00 | 0 | |||||
| 2026-04-06 | 13F | GAMMA Investing LLC | 1.884 | 110,50 | 17 | 54,55 | ||||
| 2026-02-12 | 13F | DRW Securities, LLC | 0 | -100,00 | 0 | |||||
| 2026-02-13 | 13F | Ubs Asset Management Americas Inc | 305.863 | 3,68 | 4.050 | -16,41 | ||||
| 2026-04-02 | 13F | Ares Financial Consulting, LLC | 150 | 0,00 | 1 | 0,00 | ||||
| 2026-04-14 | 13F | Nbc Securities, Inc. | 700 | 0,00 | 6 | -33,33 | ||||
| 2026-04-20 | 13F | Hilton Head Capital Partners, LLC | 200 | 0,00 | 2 | -50,00 | ||||
| 2026-01-29 | 13F | Vanguard Group Inc | 15.857.828 | 6,90 | 209.958 | -13,80 | ||||
| 2026-02-19 | 13F | CI Private Wealth, LLC | 23.594 | 5,93 | 312 | -14,52 | ||||
| 2026-02-17 | 13F | MIRAE ASSET GLOBAL ETFS HOLDINGS Ltd. | 46.658 | -7,54 | 618 | -25,48 | ||||
| 2026-01-29 | 13F | UBS Group AG | 715.936 | -41,01 | 9.479 | -52,44 | ||||
| 2026-04-13 | 13F | Creative Financial Designs Inc /adv | 1.156 | 0,00 | 11 | -33,33 | ||||
| 2025-11-12 | 13F | Transce3nd, LLC | 0 | -100,00 | 0 | |||||
| 2026-01-29 | 13F | IMC-Chicago, LLC | 166.205 | 63,25 | 2.201 | 31,66 | ||||
| 2025-11-06 | 13F | Ameritas Advisory Services, LLC | 0 | -100,00 | 0 | -100,00 | ||||
| 2026-02-12 | 13F | Voya Investment Management Llc | 13.936 | -10,13 | 185 | -27,56 | ||||
| 2025-11-14 | 13F | Murchinson Ltd. | 0 | -100,00 | 0 | -100,00 | ||||
| 2026-04-17 | 13F | CENTRAL TRUST Co | 305 | 0,00 | 3 | -50,00 | ||||
| 2026-02-09 | 13F | Hantz Financial Services, Inc. | 373 | -5,81 | 0 | |||||
| 2026-02-04 | 13F | Mascoma Wealth Management LLC | 0 | -100,00 | 0 | |||||
| 2026-02-17 | 13F | Wealth Watch Advisors, INC | 100 | 1 | ||||||
| 2026-01-23 | 13F | Westside Investment Management, Inc. | 779 | 193,96 | 11 | 150,00 | ||||
| 2025-11-06 | 13F | Vision Financial Markets Llc | 0 | -100,00 | 0 | -100,00 | ||||
| 2026-02-10 | 13F | Basepoint Wealth LLC | 57 | 1 | ||||||
| 2026-04-01 | 13F | Bangor Savings Bank | 10 | 0,00 | 0 | |||||
| 2026-01-16 | 13F | Hopwood Financial Services, Inc. | 0 | -100,00 | 0 | |||||
| 2025-11-21 | 13F/A | Royal Bank Of Canada | Put | 0 | -100,00 | 0 | -100,00 | |||
| 2026-04-09 | 13F | PFS Partners, LLC | 3 | 0,00 | 0 | |||||
| 2026-04-06 | 13F | CX Institutional | 444 | 197,99 | 0 | |||||
| 2026-02-23 | 13F | Wealth Preservation Advisors, LLC | 30 | 0,00 | 0 | |||||
| 2026-03-04 | 13F | SHP Wealth Management | 473 | 6 | ||||||
| 2026-02-09 | 13F | Huntington National Bank | 287 | -90,86 | 4 | -94,12 | ||||
| 2025-12-18 | 13F | Danske Bank A/s | Put | 0 | -100,00 | 0 | ||||
| 2026-02-13 | 13F | SRS Capital Advisors, Inc. | 3.826 | 93,92 | 51 | 56,25 | ||||
| 2026-04-24 | 13F | Financial Life Planners | 6 | 0 | ||||||
| 2026-02-10 | 13F | Meramec Financial Planners, LLC | 163 | 2 | ||||||
| 2026-02-17 | 13F | Interval Partners, LP | Call | 25.900 | -2,26 | 343 | -21,38 | |||
| 2026-02-17 | 13F | Asset One Wealth Management LLC | 153.808 | 1.895 | ||||||
| 2026-02-17 | 13F | Bank Of America Corp /de/ | 38.724 | -83,69 | 513 | -86,86 | ||||
| 2026-02-17 | 13F | Symmetry Peak Management Llc | Call | 39.900 | 528 | |||||
| 2026-02-13 | 13F | Stifel Financial Corp | 0 | -100,00 | 0 | |||||
| 2026-02-09 | 13F | MTM Investment Management, LLC | 245 | 8,89 | 3 | 0,00 | ||||
| 2026-02-17 | 13F | Balyasny Asset Management Llc | 204.628 | 132,17 | 2.709 | 87,21 | ||||
| 2026-02-10 | 13F | Bruce G. Allen Investments, LLC | 0 | -100,00 | 0 | |||||
| 2026-01-20 | 13F | Independence Bank of Kentucky | 483 | 0,00 | 6 | -14,29 | ||||
| 2026-02-06 | 13F | Bare Financial Services, Inc | 35 | 0 | ||||||
| 2026-04-14 | 13F | Nova Wealth Management, Inc. | 0 | -100,00 | 0 | |||||
| 2026-04-22 | 13F | Red Door Wealth Management, LLC | 27.084 | 0,00 | 251 | -29,89 | ||||
| 2026-02-04 | 13F | BCJ Capital Management, LLC | 10.043 | -0,25 | 133 | -20,00 | ||||
| 2026-01-23 | 13F | Nbt Bank N A /ny | 0 | -100,00 | 0 | |||||
| 2026-02-10 | 13F | Goldman Sachs Group Inc | 179.386 | -45,53 | 2.375 | -56,08 | ||||
| 2026-01-29 | 13F | Camelot Portfolios, LLC | 320 | 4 | ||||||
| 2026-04-13 | 13F | Bank of New Hampshire | 70 | 0,00 | 1 | |||||
| 2026-02-12 | 13F | Hohimer Wealth Management, Llc | 0 | -100,00 | 0 | |||||
| 2025-11-17 | 13F | Avondale Wealth Management | 0 | -100,00 | 0 | |||||
| 2026-02-03 | 13F | McIlrath & Eck, LLC | 158 | 0,00 | 2 | 0,00 | ||||
| 2026-02-10 | 13F | REAP Financial Group, LLC | 353 | 0,00 | 5 | -20,00 | ||||
| 2026-02-11 | 13F | Modus Advisors, LLC | 400 | 5 | ||||||
| 2026-02-13 | 13F | Resources Management Corp /ct/ /adv | 275 | 0,00 | 0 | |||||
| 2026-02-02 | 13F | Wolverine Asset Management Llc | 30.194 | 400 | ||||||
| 2026-04-23 | 13F | CWM Advisors, LLC | 120 | 0,00 | 1 | 0,00 | ||||
| 2026-02-04 | 13F | Atlantic Union Bankshares Corp | 170 | 0,00 | 2 | 0,00 | ||||
| 2026-01-28 | 13F | Teacher Retirement System Of Texas | 0 | -100,00 | 0 | |||||
| 2026-02-17 | 13F | Jain Global LLC | Put | 86.300 | 15,07 | 1.143 | -7,23 | |||
| 2026-01-20 | 13F | SOA Wealth Advisors, LLC. | 100 | 0,00 | 1 | 0,00 | ||||
| 2026-02-17 | 13F | Aqr Capital Management Llc | 77.442 | 1.025 | ||||||
| 2026-02-13 | 13F | Hudson Bay Capital Management LP | 15.000 | 199 | ||||||
| 2026-02-18 | 13F | Vident Advisory, LLC | 66.594 | 0,90 | 882 | -18,65 | ||||
| 2026-04-15 | 13F | Client 1st Advisory Group, Llc | 12.299 | 0,00 | 114 | -29,63 | ||||
| 2026-04-14 | 13F | Moisand Fitzgerald Tamayo, LLC | 2.338 | 0,00 | 22 | -30,00 | ||||
| 2026-02-17 | 13F | Clear Street Markets Llc | 1 | 0 | ||||||
| 2026-01-14 | 13F | ORG Wealth Partners, LLC | 233 | 0,00 | 3 | 0,00 | ||||
| 2026-02-12 | 13F | Commonwealth Equity Services, Llc | 55.427 | 9,29 | 734 | |||||
| 2026-02-13 | 13F | Wexford Capital Lp | 9.390 | 124 | ||||||
| 2026-02-26 | 13F | Anchor Investment Management, LLC | 100 | 0,00 | 1 | 0,00 | ||||
| 2026-02-09 | 13F | Geode Capital Management, Llc | 3.087.747 | 3,82 | 40.891 | -16,29 | ||||
| 2026-02-12 | 13F | Principal Securities, Inc. | 17.623 | 17,83 | 233 | -4,90 | ||||
| 2026-02-11 | 13F | United Financial Planning Group LLC | 95 | 0,00 | 1 | 0,00 | ||||
| 2026-02-11 | 13F | Group One Trading, L.p. | 607.085 | 1,10 | 8.038 | -18,49 | ||||
| 2026-04-03 | 13F | Investors Research Corp | 184 | 0,00 | 2 | -50,00 | ||||
| 2026-04-03 | 13F | Adirondack Trust Co | 100 | 0,00 | 1 | -100,00 | ||||
| 2026-02-17 | 13F | Ancora Advisors, LLC | 595 | 0,00 | 8 | -22,22 | ||||
| 2026-04-24 | 13F | Oakworth Capital, Inc. | 1.000 | 0,00 | 9 | -30,77 | ||||
| 2026-01-22 | 13F | Bfsg, Llc | 16 | 0,00 | 0 | |||||
| 2026-02-13 | 13F | Vontobel Holding Ltd. | 34.644 | 38,71 | 459 | 11,71 | ||||
| 2026-02-12 | 13F | Federation des caisses Desjardins du Quebec | 5.313 | -5,34 | 70 | -23,91 | ||||
| 2026-01-14 | 13F | ORG Partners LLC | 300 | -11,76 | 4 | -40,00 | ||||
| 2026-02-17 | 13F | Russell Investments Group, Ltd. | 15.811 | -42,08 | 209 | -53,35 | ||||
| 2026-01-12 | 13F | Horizon Financial Services, Llc | 0 | -100,00 | 0 | |||||
| 2026-02-13 | 13F | Victory Capital Management Inc | 18.640 | 25,95 | 247 | 1,23 | ||||
| 2026-02-05 | 13F | IMG Wealth Management, Inc. | 1.408 | 10.730,77 | 19 | |||||
| 2026-02-13 | 13F | Caitong International Asset Management Co., Ltd | 5 | -99,22 | 0 | -100,00 | ||||
| 2026-02-17 | 13F | Public Employees Retirement System Of Ohio | 48.275 | -3,66 | 639 | -22,26 | ||||
| 2025-11-14 | 13F | Bayesian Capital Management, LP | 0 | -100,00 | 0 | |||||
| 2026-02-06 | 13F | GPS Wealth Strategies Group, LLC | 0 | -100,00 | 0 | |||||
| 2026-04-17 | 13F | Total Clarity Wealth Management, Inc. | 48.586 | 451 | ||||||
| 2026-02-11 | 13F | Hughes Financial Services, LLC | 10 | -76,74 | 0 | |||||
| 2025-11-13 | 13F | GeoWealth Management, LLC | 0 | -100,00 | 0 | |||||
| 2026-01-13 | 13F | Stephens Consulting, LLC | 50 | 0,00 | 1 | |||||
| 2025-11-14 | 13F | XTX Topco Ltd | 0 | -100,00 | 0 | -100,00 | ||||
| 2026-02-13 | 13F | First Trust Advisors Lp | 25.836 | -11,13 | 342 | -28,30 | ||||
| 2026-02-10 | 13F | Axq Capital, Lp | 0 | -100,00 | 0 | |||||
| 2026-02-06 | 13F | Tanglewood Legacy Advisors, LLC | 50 | 0,00 | 1 | |||||
| 2026-02-12 | 13F | Triumph Capital Management | 1 | 0,00 | 0 | |||||
| 2026-02-09 | 13F | Quest Partners LLC | 3.315 | -5,34 | 44 | -24,56 | ||||
| 2026-04-08 | 13F | Sapient Capital Llc | 145.569 | 0,00 | 1.351 | -26,19 | ||||
| 2026-01-21 | 13F | Raleigh Capital Management Inc. | 813 | 11 | ||||||
| 2026-02-09 | 13F | Keating Financial Advisory Services, Inc. | 8 | 0 | ||||||
| 2026-01-30 | 13F | Rogco, Lp | 1.516 | 0,00 | 20 | -16,67 | ||||
| 2026-02-13 | 13F | 1248 Management, LLC | 419 | 0,00 | 6 | -16,67 | ||||
| 2026-02-12 | 13F | CIBC Private Wealth Group, LLC | 535 | -27,21 | 7 | -41,67 | ||||
| 2026-02-17 | 13F | Two Sigma Investments, Lp | Put | 2.564.800 | 8,86 | 33.958 | -12,23 | |||
| 2026-03-05 | 13F | Gunpowder Capital Management, LLC dba Oliver Wealth Management | 72 | 1 | ||||||
| 2026-02-11 | 13F | LPL Financial LLC | Call | 0 | -100,00 | 0 | -100,00 | |||
| 2026-02-17 | 13F | Royal Bank Of Canada | 19.775 | -97,60 | 262 | -98,07 | ||||
| 2026-02-12 | 13F | Hollencrest Capital Management | 1.325 | 0,00 | 18 | -19,05 | ||||
| 2026-02-17 | 13F | Hancock Prospecting Pty Ltd | 430.000 | 0,00 | 5.693 | -19,36 | ||||
| 2026-02-11 | 13F | Deutsche Bank Ag\ | 11.657 | 0,20 | 154 | -19,37 | ||||
| 2026-02-17 | 13F | Cinctive Capital Management LP | 28.972 | 384 | ||||||
| 2026-02-06 | 13F | Kingdom Financial Group LLC. | 377 | 5 | ||||||
| 2026-02-10 | 13F | Envestnet Asset Management Inc | 15.480 | 8,69 | 205 | -12,45 | ||||
| 2026-02-06 | 13F | HighTower Advisors, LLC | 16.540 | 21,73 | 219 | -2,24 | ||||
| 2026-02-17 | 13F | Fountainhead AM, LLC | 268 | -98,05 | 4 | -98,67 | ||||
| 2026-02-13 | 13F | State Street Corp | 2.962.844 | 22,67 | 39.228 | -1,09 | ||||
| 2026-01-29 | 13F | Dunhill Financial, LLC | 5 | 0 | ||||||
| 2026-01-30 | 13F | Sigma Planning Corp | 23.256 | 308 | ||||||
| 2026-02-05 | 13F | Tucker Asset Management Llc | 68 | 1 | ||||||
| 2026-04-23 | 13F | Marquette Asset Management, LLC | 51 | 0 | ||||||
| 2026-01-29 | 13F | Rakuten Securities, Inc. | 1.656 | -19,96 | 22 | -36,36 | ||||
| 2026-02-17 | 13F | California State Teachers Retirement System | 155.098 | -0,13 | 2.053 | -19,46 | ||||
| 2026-02-13 | 13F | Ieq Capital, Llc | 10.279 | 136 | ||||||
| 2026-02-17 | 13F | State Of Wisconsin Investment Board | 0 | -100,00 | 0 | |||||
| 2026-04-07 | 13F | Signaturefd, Llc | 382 | 9,14 | 4 | -25,00 | ||||
| 2026-02-13 | 13F | Treasurer of the State of North Carolina | 67.205 | -6,80 | 1 | -100,00 | ||||
| 2026-01-29 | 13F | Comerica Bank | 35 | -69,83 | 0 | -100,00 | ||||
| 2026-04-16 | 13F | Capital Advisors, Ltd. LLC | 253 | 0 | ||||||
| 2026-04-23 | 13F | SJS Investment Consulting Inc. | 18 | 0 | ||||||
| 2026-01-09 | 13F | SG Americas Securities, LLC | 0 | -100,00 | 0 | |||||
| 2026-02-12 | 13F | SWAN Capital LLC | 93 | 0,00 | 1 | 0,00 | ||||
| 2025-11-14 | 13F | Anson Funds Management LP | 0 | -100,00 | 0 | |||||
| 2026-02-17 | 13F | Garden State Investment Advisory Services LLC | 0 | -100,00 | 0 | |||||
| 2026-02-10 | 13F | Lido Advisors, LLC | 15.416 | 210 | ||||||
| 2026-02-17 | 13F | Advisory Services Network, LLC | 0 | -100,00 | 0 | |||||
| 2026-02-17 | 13F | Tower Research Capital LLC (TRC) | 651 | -64,01 | 9 | -72,41 | ||||
| 2026-02-12 | 13F | Bank Of Montreal /can/ | Put | 1.500 | 0,00 | 20 | -20,83 | |||
| 2025-11-14 | 13F | Hrt Financial Lp | 0 | -100,00 | 0 | -100,00 | ||||
| 2026-04-23 | 13F | Game Plan Financial Advisors, LLC | 50 | 0,00 | 0 | |||||
| 2026-02-12 | 13F | Bank Of Montreal /can/ | 9.596 | -37,51 | 127 | -49,60 | ||||
| 2026-01-13 | 13F | Team Financial Group, LLC | 0 | -100,00 | 0 | |||||
| 2026-02-13 | 13F | Kayne Anderson Rudnick Investment Management Llc | 11 | 0,00 | 0 | |||||
| 2026-01-28 | 13F | N.E.W. Advisory Services LLC | 1.597 | -67,24 | 21 | -73,75 | ||||
| 2026-02-17 | 13F | Intrepid Family Office Llc | 5.000 | 66 | ||||||
| 2026-02-02 | 13F | Pittenger & Anderson Inc | 1.350 | 4.555,17 | 18 | |||||
| 2026-02-17 | 13F | Alliancebernstein L.p. | 59.374 | -8,83 | 786 | -26,47 | ||||
| 2026-04-13 | 13F | Clayton Financial Group LLC | 100 | 0,00 | 1 | -100,00 | ||||
| 2026-02-10 | 13F | Rothschild Investment Llc | 13 | 0 | ||||||
| 2026-04-22 | 13F | Pictet Asset Management Holding SA | 28.907 | 14,37 | 268 | -19,76 | ||||
| 2026-02-13 | 13F | Colony Group, LLC | 181.911 | -4,38 | 2.409 | -22,86 | ||||
| 2026-02-17 | 13F | Strive Financial Group ,LLC | 5 | 0 | ||||||
| 2025-11-14 | 13F | Strategic Wealth Partners, Ltd. | 21 | 0,00 | 0 | |||||
| 2026-02-13 | 13F | Golden State Wealth Management, LLC | 433 | -77,31 | 6 | -83,87 | ||||
| 2026-04-21 | 13F | Red Tortoise LLC | 0 | -100,00 | 0 | |||||
| 2026-02-11 | 13F | SOUTH STATE Corp | 0 | -100,00 | 0 | |||||
| 2026-02-17 | 13F | SummitTX Capital, L.P. | 29.491 | 390 | ||||||
| 2026-01-28 | 13F | WPG Advisers, LLC | 426 | 0,00 | 6 | -16,67 | ||||
| 2026-02-13 | 13F | Squarepoint Ops LLC | Put | 153.400 | 35,27 | 2.031 | 9,08 | |||
| 2026-04-22 | 13F | Coston, McIsaac & Partners | 69 | 0,00 | 0 | |||||
| 2026-02-10 | 13F | Belvedere Trading LLC | Put | 0 | -100,00 | 0 | ||||
| 2026-02-10 | 13F | Belvedere Trading LLC | Call | 0 | -100,00 | 0 | ||||
| 2026-02-10 | 13F | Skaana Management L.P. | Put | 32.700 | 717,50 | 433 | 564,62 | |||
| 2026-02-17 | 13F | Arosa Capital Management LP | 180.000 | 2.383 | ||||||
| 2026-02-10 | 13F | Belvedere Trading LLC | 0 | -100,00 | 0 | |||||
| 2026-02-13 | 13F | Squarepoint Ops LLC | Call | 195.700 | 404,38 | 2.591 | 306,75 | |||
| 2026-04-23 | 13F | Kohmann Bosshard Financial Services, LLC | 729 | -0,27 | 7 | -33,33 | ||||
| 2026-02-13 | 13F | Citigroup Inc | 30.910 | -57,91 | 409 | -66,06 | ||||
| 2025-11-14 | 13F | Quarry LP | Put | 0 | -100,00 | 0 | -100,00 | |||
| 2026-02-11 | 13F | Cerity Partners LLC | 12.361 | 164 | ||||||
| 2026-02-17 | 13F | Cresset Asset Management, LLC | 17.073 | -31,29 | 226 | -44,61 | ||||
| 2026-02-13 | 13F | Charles Schwab Investment Management Inc | 1.435.115 | 0,86 | 19.001 | -18,67 | ||||
| 2026-02-17 | 13F | SageView Advisory Group, LLC | 481 | 6 | ||||||
| 2026-01-26 | 13F | Cwm, Llc | Put | 100 | 0 | |||||
| 2025-11-14 | 13F | Polar Asset Management Partners Inc. | 0 | -100,00 | 0 | |||||
| 2026-04-24 | 13F | Key FInancial Inc | 25 | 0,00 | 0 | |||||
| 2026-01-26 | 13F | Main Street Group, LTD | 0 | -100,00 | 0 | |||||
| 2026-02-13 | 13F | Transamerica Financial Advisors, Inc. | 58 | 1 | ||||||
| 2026-02-17 | 13F | Scarborough Advisors, LLC | 50 | -1,96 | 1 | |||||
| 2026-04-24 | 13F | Bayban | 250 | 0,00 | 2 | -33,33 | ||||
| 2026-02-13 | 13F | Motiv8 Investments LLC | 2.282 | 0 | ||||||
| 2026-01-20 | 13F/A | Miller Wealth Advisors, Llc | 205 | 0,00 | 3 | -33,33 | ||||
| 2026-02-17 | 13F | Cantor Fitzgerald, L. P. | Put | 750.000 | -45,45 | 9.930 | -56,02 | |||
| 2026-02-17 | 13F | Cantor Fitzgerald, L. P. | 1.149.806 | -39,54 | 15.223 | -55,33 | ||||
| 2026-02-12 | 13F | Wealthspire Advisors, LLC | 0 | -100,00 | 0 | |||||
| 2026-04-20 | 13F | Jfs Wealth Advisors, Llc | 777 | 0,00 | 7 | -30,00 | ||||
| 2026-01-27 | 13F | TD Waterhouse Canada Inc. | 595 | 138,00 | 8 | 75,00 | ||||
| 2026-01-21 | 13F | Newbridge Financial Services Group, Inc. | 1.365 | 12,81 | 18 | -5,26 | ||||
| 2026-02-13 | 13F | Gts Securities Llc | 0 | -100,00 | 0 | |||||
| 2026-02-13 | 13F | National Bank Of Canada /fi/ | 100 | 0,00 | 1 | 0,00 | ||||
| 2026-02-12 | 13F | Jane Street Group, Llc | Put | 712.500 | -58,34 | 9.434 | -66,41 | |||
| 2026-02-12 | 13F | Jane Street Group, Llc | Call | 1.121.600 | 1,36 | 14.850 | -18,28 | |||
| 2026-03-19 | 13F | Painted Porch Advisors LLC | 0 | -100,00 | 0 | |||||
| 2026-02-06 | 13F | Covestor Ltd | 607 | 0,17 | 0 | |||||
| 2026-04-15 | 13F | FNY Investment Advisers, LLC | 0 | -100,00 | 0 | |||||
| 2026-02-12 | 13F | Jane Street Group, Llc | 303.305 | -96,67 | 4.016 | -97,31 | ||||
| 2026-02-17 | 13F | Creek Drive Management Group LLC | 250.000 | 3.310 | ||||||
| 2026-02-10 | 13F | Yorkville Advisors Global, LP | 6.641.944 | 7,21 | 87.939 | -13,55 | ||||
| 2026-04-24 | 13F | Strs Ohio | 3.836 | -0,16 | 36 | -30,00 | ||||
| 2026-02-10 | 13F/A | Northwestern Mutual Wealth Management Co | 422 | -4,74 | 6 | -28,57 | ||||
| 2026-02-13 | 13F | Pinnacle Wealth Planning Services, Inc. | 4.811 | 64 | ||||||
| 2026-01-26 | 13F | KBC Group NV | 4.766 | 0,00 | 0 | |||||
| 2026-02-17 | 13F | Safe Harbor Fiduciary, LLC | 229 | 0,00 | 3 | -25,00 | ||||
| 2026-04-23 | 13F | Glass Jacobson Investment Advisors llc | 701 | 0,00 | 7 | -33,33 | ||||
| 2026-02-12 | 13F | Bank of Jackson Hole Trust | 0 | -100,00 | 0 | |||||
| 2025-11-14 | 13F | Hunting Hill Global Capital, LLC | Put | 0 | -100,00 | 0 | ||||
| 2026-02-10 | 13F | Daiwa Securities Group Inc. | 5.929 | 115,68 | 0 | |||||
| 2026-01-12 | 13F | AllSquare Wealth Management LLC | 303 | 0,00 | 5 | -20,00 | ||||
| 2026-02-10 | 13F | Machina Capital S.a.s. | 11.672 | 155 | ||||||
| 2026-04-15 | 13F | Sarver Vrooman Wealth Advisors | 0 | -100,00 | 0 | |||||
| 2026-01-21 | 13F | Flagship Harbor Advisors, Llc | 358 | 5 | ||||||
| 2026-01-30 | 13F | Us Bancorp \de\ | 3.670 | -25,92 | 49 | -40,74 | ||||
| 2026-04-01 | 13F | Burkett Financial Services, Llc | 99 | 0,00 | 1 | -100,00 | ||||
| 2026-02-20 | 13F/A | Prestige Wealth Management Group LLC | 0 | -100,00 | 0 | |||||
| 2026-01-20 | 13F | Savvy Advisors, Inc. | 11.254 | 149 | ||||||
| 2026-02-12 | 13F | Steward Partners Investment Advisory, Llc | 2.630 | -50,17 | 35 | -60,47 | ||||
| 2026-02-10 | 13F | State of Wyoming | 11.786 | 156 | ||||||
| 2026-02-17 | 13F | Perritt Capital Management Inc | 0 | -100,00 | 0 | |||||
| 2026-01-15 | 13F | Lodestone Wealth Management LLC | 92 | 1 | ||||||
| 2026-02-17 | 13F | Cetera Investment Advisers | 112.578 | -50,65 | 1.491 | -60,21 | ||||
| 2026-04-14 | 13F | Drive Wealth Management, Llc | 10.292 | 96 | ||||||
| 2025-11-14 | 13F | DRW Securities, LLC | Call | 0 | -100,00 | 0 | -100,00 | |||
| 2026-02-13 | 13F | Quinn Opportunity Partners LLC | 866.000 | 11.466 | ||||||
| 2026-04-16 | 13F | Lincoln Capital Corp | 10.000 | 0,00 | 93 | -30,30 | ||||
| 2026-02-03 | 13F | Winch Advisory Services, LLC | 34 | 0,00 | 0 | |||||
| 2026-04-15 | 13F | Fortitude Family Office, LLC | 0 | -100,00 | 0 | |||||
| 2026-02-04 | 13F | Pandora Wealth, Inc. | 270 | 0,00 | 4 | -25,00 | ||||
| 2026-03-12 | 13F/A | Peak6 Llc | Call | 229.400 | -76,16 | 3.037 | -80,78 | |||
| 2026-03-12 | 13F/A | Peak6 Llc | 284 | 4 | ||||||
| 2026-03-12 | 13F/A | Peak6 Llc | Put | 146.600 | 604,81 | 1.941 | 468,91 | |||
| 2026-02-11 | 13F | Twin Tree Management, LP | Put | 0 | -100,00 | 0 | ||||
| 2026-02-13 | 13F | Centiva Capital, LP | 0 | -100,00 | 0 | -100,00 | ||||
| 2026-02-13 | 13F | Quarry LP | 831 | 40,13 | 11 | 22,22 | ||||
| 2026-02-12 | 13F | Quadrant Capital Group Llc | 102 | 1 | ||||||
| 2026-04-23 | 13F | RIA Advisory Group LLC | 16.892 | 11,40 | 157 | -22,00 | ||||
| 2026-02-17 | 13F | Northern Trust Corp | 784.672 | 6,01 | 10.389 | -14,51 | ||||
| 2026-02-12 | 13F | New York State Common Retirement Fund | 81.200 | 40,73 | 1.075 | 13,52 | ||||
| 2026-02-17 | 13F | Corsair Capital Management, L.p. | 10.000 | 132 | ||||||
| 2026-04-21 | 13F | Pflug Koory, LLC | 371 | 0,00 | 3 | -25,00 | ||||
| 2026-02-17 | 13F | Ameriprise Financial Inc | 0 | -100,00 | 0 | |||||
| 2026-04-20 | 13F | City State Bank | 210 | 0,00 | 2 | -50,00 | ||||
| 2026-02-13 | 13F | Barclays Plc | Put | 0 | -100,00 | 0 | -100,00 | |||
| 2026-02-13 | 13F | Barclays Plc | Call | 0 | -100,00 | 0 | -100,00 | |||
| 2026-01-28 | 13F | Klp Kapitalforvaltning As | 35.600 | 3,19 | 471 | -16,78 | ||||
| 2026-02-04 | 13F | Tsfg, Llc | 100 | 0,00 | 0 | |||||
| 2026-02-17 | 13F | Millennium Management Llc | Put | 30.200 | -96,75 | 400 | -97,38 | |||
| 2026-01-27 | 13F | BankPlus Trust Department | 120 | 0,00 | 2 | 0,00 | ||||
| 2026-02-17 | 13F | Ameriflex Group, Inc. | 0 | -100,00 | 0 | |||||
| 2026-02-17 | 13F | Millennium Management Llc | Call | 80.200 | -65,84 | 1.062 | -72,48 | |||
| 2026-04-21 | 13F | Nemes Rush Group LLC | 151 | 0,00 | 1 | 0,00 | ||||
| 2026-02-04 | 13F | Community Bank, N.A. | 425 | 0,00 | 6 | -16,67 | ||||
| 2026-02-12 | 13F | Swiss National Bank | 327.700 | 1,68 | 4.339 | -18,03 | ||||
| 2025-11-13 | 13F | Continental General Insurance Co | 0 | -100,00 | 0 | -100,00 | ||||
| 2026-04-07 | 13F | Estate Planners Group, LLC | 200 | 3 | ||||||
| 2026-04-24 | 13F | Sumitomo Mitsui DS Asset Management Company, Ltd | 18.446 | 8,81 | 171 | -23,66 | ||||
| 2026-01-30 | 13F | Rachor Investment Advisory Services, LLC | 72 | 1 | ||||||
| 2025-11-06 | 13F | Costello Asset Management, INC | 0 | -100,00 | 0 | |||||
| 2026-02-12 | 13F | State Board Of Administration Of Florida Retirement System | 98.874 | 39,21 | 1.309 | 12,26 | ||||
| 2026-04-17 | 13F | Kentucky Trust Co | 500 | 0,00 | 5 | -33,33 | ||||
| 2025-11-04 | 13F | Guerra Advisors Inc | 56 | 1 | ||||||
| 2026-02-17 | 13F | Qube Research & Technologies Ltd | Put | 29.500 | -41,81 | 391 | -53,12 | |||
| 2026-02-17 | 13F | Qube Research & Technologies Ltd | Call | 67.700 | -22,63 | 896 | -37,60 | |||
| 2026-02-11 | 13F | Twin Tree Management, LP | 0 | -100,00 | 0 | |||||
| 2026-01-27 | 13F | Zurcher Kantonalbank (Zurich Cantonalbank) | 31.696 | -32,84 | 420 | -45,87 | ||||
| 2026-04-13 | 13F | Massmutual Trust Co Fsb/adv | 298 | 19,20 | 3 | -33,33 | ||||
| 2026-04-22 | 13F | Spire Wealth Management | 620 | 0,00 | 6 | -37,50 | ||||
| 2026-02-13 | 13F | Graney & King, LLC | 200 | 0,00 | 3 | -33,33 | ||||
| 2026-02-18 | 13F | GWM Advisors LLC | 0 | -100,00 | 0 | |||||
| 2026-02-17 | 13F | Jones Financial Companies Lllp | 12.898 | 109,62 | 171 | 63,46 | ||||
| 2026-02-13 | 13F | Barclays Plc | 2.159 | 36,56 | 29 | 12,00 | ||||
| 2026-02-13 | 13F | BNP Paribas Asset Management Holding S.A. | 2.220 | 37,38 | 0 | |||||
| 2026-04-16 | 13F | Toth Financial Advisory Corp | 415 | 0,00 | 4 | -40,00 | ||||
| 2026-02-17 | 13F | Sender Co & Partners, Inc. | 12.933 | 171 | ||||||
| 2026-02-17 | 13F | Symmetry Investments LP | Call | 250.000 | 3.310 | |||||
| 2026-04-16 | 13F | Davis Capital Management | 274 | 0,00 | 3 | -33,33 | ||||
| 2026-02-13 | 13F | Hurley Capital, LLC | 230 | 3 | ||||||
| 2026-02-13 | 13F | Mariner, LLC | 46.818 | 11,69 | 619 | -10,17 | ||||
| 2026-02-17 | 13F | Parallax Volatility Advisers, L.P. | Call | 46.600 | -86,69 | 617 | -89,28 | |||
| 2026-02-02 | 13F | Cornerstone Planning Group LLC | 10 | 900,00 | 0 | |||||
| 2026-02-17 | 13F | Parallax Volatility Advisers, L.P. | Put | 1.223.900 | 150,13 | 16.204 | 101,69 | |||
| 2026-02-17 | 13F | Parallax Volatility Advisers, L.P. | 229.364 | 3.037 | ||||||
| 2026-02-17 | 13F | Mercer Global Advisors Inc /adv | 18.429 | 244 | ||||||
| 2026-02-17 | 13F | Equitable Holdings, Inc. | 0 | -100,00 | 0 | |||||
| 2026-01-28 | 13F | M&t Bank Corp | 0 | -100,00 | 0 | |||||
| 2026-02-05 | 13F | Cambridge Investment Research Advisors, Inc. | 36.423 | -9,26 | 0 | |||||
| 2026-02-03 | 13F | International Assets Investment Management, Llc | 2.985 | 40 | ||||||
| 2025-11-13 | 13F | UBS Group AG | Call | 0 | -100,00 | 0 | -100,00 | |||
| 2026-04-08 | 13F | Holos Integrated Wealth LLC | 50 | 0,00 | 0 | |||||
| 2026-04-10 | 13F | Oak Thistle LLC | 0 | -100,00 | 0 | |||||
| 2026-02-17 | 13F | Capital Fund Management S.a. | 66.570 | -32,07 | 881 | -45,25 | ||||
| 2025-11-14 | 13F | Scientech Research LLC | 0 | -100,00 | 0 | -100,00 | ||||
| 2026-02-03 | 13F/A | Bank Of America Corp /de/ | Call | 0 | -100,00 | 0 | -100,00 | |||
| 2026-04-24 | 13F | Root Financial Partners, LLC | 3.970 | 44.011,11 | 37 | |||||
| 2025-10-27 | 13F | Kiker Wealth Management, LLC | 0 | -100,00 | 0 | -100,00 | ||||
| 2026-02-17 | 13F | Citadel Advisors Llc | 649.402 | 63,78 | 8.598 | 32,07 | ||||
| 2026-01-26 | 13F | Private Trust Co Na | 11 | 0,00 | 0 | |||||
| 2026-02-17 | 13F | Citadel Advisors Llc | Call | 2.839.000 | -0,68 | 37.588 | -19,91 | |||
| 2026-02-17 | 13F | Fmr Llc | 19.194 | 66,92 | 254 | 35,11 | ||||
| 2026-02-17 | 13F | Citadel Advisors Llc | Put | 3.536.300 | 142,49 | 46.821 | 95,53 | |||
| 2026-04-15 | 13F | Compagnie Lombard Odier SCmA | 125 | 0,00 | 1 | 0,00 | ||||
| 2025-10-30 | 13F | CVA Family Office, LLC | 0 | -100,00 | 0 | |||||
| 2025-11-13 | 13F | UBS Group AG | Put | 0 | -100,00 | 0 | -100,00 | |||
| 2026-04-21 | 13F | Financial Consulate, Inc | 46 | 0,00 | 0 | |||||
| 2025-11-14 | 13F | WealthTrak Capital Management LLC | 0 | -100,00 | 0 | |||||
| 2026-02-06 | 13F | Leonteq Securities AG | 732 | 0,00 | 10 | -25,00 | ||||
| 2026-01-16 | 13F | Trust Co Of Vermont | 5 | 0,00 | 0 | |||||
| 2026-02-13 | 13F | Morgan Stanley | 741.804 | 3,80 | 9.821 | -16,30 | ||||
| 2026-02-17 | 13F | Raymond James Financial Inc | Call | 1.400 | 0,00 | 132 | -2,94 | |||
| 2026-04-10 | 13F | Armstrong Advisory Group, Inc | 286 | 33,64 | 3 | 0,00 | ||||
| 2026-02-17 | 13F | Raymond James Financial Inc | 40.429 | 3,41 | 535 | -16,54 | ||||
| 2026-02-17 | 13F | Susquehanna Portfolio Strategies, LLC | 572.758 | 7.583 | ||||||
| 2026-02-05 | 13F | Plante Moran Financial Advisors, LLC | 75 | 0,00 | 1 | -100,00 | ||||
| 2026-02-19 | 13F | Invesco Ltd. | 197.602 | 10,83 | 2.616 | -10,63 | ||||
| 2026-02-11 | 13F | Los Angeles Capital Management Llc | 635 | 10 | ||||||
| 2025-11-19 | 13F/A | Danske Bank A/s | Call | 0 | -100,00 | 0 | -100,00 | |||
| 2026-02-17 | 13F | DV Trading LLC | 6 | 0 | ||||||
| 2026-01-30 | 13F | Archer Investment Corp | 3.000 | 0,00 | 40 | -20,41 |