Grundlæggende statistik
| Institutionelle aktier (lange) | 16.509.948 - 100,24% (ex 13D/G) - change of -4,58MM shares -21,76% MRQ |
| Institutionel værdi (lang) | $ 4.495.463 USD ($1000) |
Institutionelt ejerskab og aktionærer
CSW Industrials, Inc. (US:CSWI) har 350 institutionelle ejere og aktionærer, der har indsendt 13D/G- eller 13F-formularer til Securities Exchange Commission (SEC). Disse institutioner har i alt 16,509,948 aktier. Største aktionærer omfatter BlackRock, Inc., Vanguard Group Inc, Capital World Investors, Morgan Stanley, Wasatch Advisors Inc, State Street Corp, Conestoga Capital Advisors, LLC, Geode Capital Management, Llc, Kayne Anderson Rudnick Investment Management Llc, and Neuberger Berman Group LLC .
CSW Industrials, Inc. (NasdaqGS:CSWI) institutionel ejerskabsstruktur viser aktuelle positioner i virksomheden efter institutioner og fonde, samt seneste ændringer i positionsstørrelse. Større aktionærer kan omfatte individuelle investorer, investeringsforeninger, hedgefonde eller institutioner. Skema 13D angiver, at investoren besidder (eller besidder) mere end 5 % af virksomheden og har til hensigt (eller har til hensigt at) aktivt at forfølge en ændring i forretningsstrategi. Skema 13G indikerer en passiv investering på over 5%.
The share price as of June 6, 2025 is 305,10 / share. Previously, on April 14, 2025, the share price was 299,08 / share. This represents an increase of 2,01% over that period.

Fondens stemningsscore
Fund Sentiment Score (fka Ownership Accumulation Score) finder de aktier, der bliver mest købt af fonde. Det er resultatet af en sofistikeret, multi-faktor kvantitativ model, der identificerer virksomheder med de højeste niveauer af institutionel akkumulering. Scoringsmodellen bruger en kombination af den samlede stigning i oplyste ejere, ændringerne i porteføljeallokeringer i disse ejere og andre målinger. Tallet går fra 0 til 100, hvor højere tal indikerer et højere niveau af akkumulering for sine jævnaldrende, og 50 er gennemsnittet.
Opdateringsfrekvens: Dagligt
Se Ownership Explorer, som giver en liste over højest rangerende virksomheder.
AI+ Ask Fintel’s AI assistant about CSW Industrials, Inc..
Select a question to share a public post with an AI-crafted answer.
Thinking of good questions…
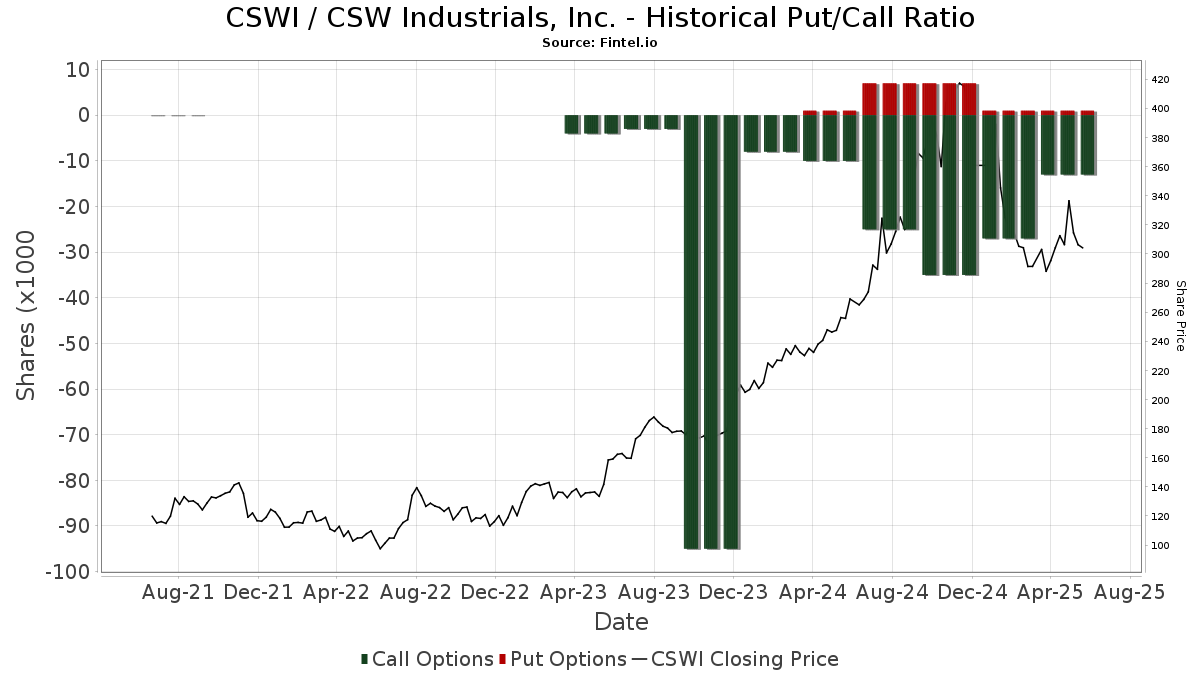
Institutionel Put/Call-forhold
Ud over at indberette standardaktie- og gældsudstedelser skal institutter med mere end 100 mill. aktiver under forvaltning også oplyse deres put- og call-optionsbeholdninger. Da salgsoptioner generelt indikerer negativ stemning, og købsoptioner indikerer positiv stemning, kan vi få en fornemmelse af den overordnede institutionelle stemning ved at plotte forholdet mellem put og kald. Diagrammet til højre viser det historiske put/call-forhold for dette instrument.
Brug af Put/Call Ratio som en indikator for investorernes stemning overvinder en af de vigtigste mangler ved at bruge totalt institutionelt ejerskab, som er, at en betydelig mængde af aktiver under forvaltning investeres passivt for at spore indekser. Passivt forvaltede fonde køber typisk ikke optioner, så indikatoren for put/call-forholdet følger mere nøje følelsen af aktivt forvaltede fonde.
13F og NPORT arkivering
Detaljer om 13F-arkivering er gratis. Detaljer om NP-ansøgninger kræver et premium-medlemskab. Grønne rækker angiver nye positioner. Røde rækker angiver lukkede positioner. Klik på linket ikon for at se den fulde transaktionshistorik.
Opgrader
for at låse premium-data op og eksportere til Excel ![]() .
.
| Fil dato | Kilde | Investor | Type | Gennemsnitlig pris (Øst) |
Aktier | Δ Aktier (%) |
Rapporteret Værdi ($1000) |
Δ Værdi (%) |
Port Alloc (%) |
|
|---|---|---|---|---|---|---|---|---|---|---|
| 2026-02-11 | 13F | Franklin Resources Inc | 2.088 | -96,88 | 613 | -96,24 | ||||
| 2025-11-14 | 13F | Texas Permanent School Fund | 0 | -100,00 | 0 | -100,00 | ||||
| 2025-11-12 | 13F | Picton Mahoney Asset Management | 0 | -100,00 | 0 | |||||
| 2026-01-21 | 13F | SJS Investment Consulting Inc. | 1 | 0,00 | 0 | |||||
| 2026-02-17 | 13F | Voloridge Investment Management, Llc | 0 | -100,00 | 0 | |||||
| 2026-02-12 | 13F | Sit Investment Associates Inc | 0 | -100,00 | 0 | |||||
| 2026-02-13 | 13F | Fiduciary Trust Co | 1.180 | 346 | ||||||
| 2026-02-04 | 13F | Marco Investment Management Llc | 800 | 235 | ||||||
| 2026-02-11 | 13F | Cedar Mountain Advisors, LLC | 3 | 200,00 | 1 | |||||
| 2026-02-17 | 13F | Tower Research Capital LLC (TRC) | 877 | 9,08 | 257 | 31,79 | ||||
| 2026-02-17 | 13F | Optiver Holding B.V. | 0 | -100,00 | 0 | -100,00 | ||||
| 2026-02-17 | 13F | Captrust Financial Advisors | 2.037 | 110,87 | 598 | 155,13 | ||||
| 2026-01-16 | 13F | Louisiana State Employees Retirement System | 7.600 | -1,30 | 2.231 | 19,32 | ||||
| 2025-11-14 | 13F | Mariner, LLC | 0 | -100,00 | 0 | |||||
| 2026-01-26 | 13F | Hendershot Investments Inc. | 897 | 0,00 | 263 | 21,20 | ||||
| 2026-02-13 | 13F | Rhumbline Advisers | 44.224 | -3,38 | 12.981 | 16,83 | ||||
| 2025-10-30 | 13F | Twin Peaks Wealth Advisors, LLC | 0 | -100,00 | 0 | |||||
| 2026-02-12 | 13F | Federated Hermes, Inc. | 0 | -100,00 | 0 | |||||
| 2026-02-10 | 13F | Rothschild Investment Llc | 16 | 100,00 | 5 | 300,00 | ||||
| 2026-01-28 | 13F | B. Metzler seel. Sohn & Co. AG | 12.383 | 37,59 | 3.635 | 66,39 | ||||
| 2026-02-09 | 13F | Atlantic Trust, LLC | 0 | -100,00 | 0 | |||||
| 2026-02-17 | 13F | Royal Bank Of Canada | 36.223 | 6,64 | 10.632 | 28,94 | ||||
| 2026-04-14 | 13F | Hudson Valley Investment Advisors Inc /adv | 0 | -100,00 | 0 | |||||
| 2026-02-17 | 13F | Balyasny Asset Management Llc | 0 | -100,00 | 0 | |||||
| 2026-01-29 | 13F | Vanguard Group Inc | 1.756.390 | -1,56 | 515.553 | 19,03 | ||||
| 2026-02-12 | 13F | Hrt Financial Lp | 0 | -100,00 | 0 | |||||
| 2026-04-08 | 13F | DiNuzzo Private Wealth, Inc. | 2 | 100,00 | 1 | |||||
| 2026-02-04 | 13F | Bailard, Inc. | 1.672 | -1,94 | 491 | 18,64 | ||||
| 2026-02-05 | 13F | Atria Investments Llc | 3.378 | 39,41 | 992 | 68,54 | ||||
| 2026-02-12 | 13F | Dimensional Fund Advisors Lp | 303.891 | 4,48 | 89.208 | 26,35 | ||||
| 2026-01-15 | 13F | Allspring Global Investments Holdings, LLC | 140.530 | -28,71 | 41.461 | -16,60 | ||||
| 2026-02-13 | 13F | MAI Capital Management | 8 | -55,56 | 2 | -50,00 | ||||
| 2026-02-12 | 13F | Hollencrest Capital Management | 20 | 0,00 | 6 | 25,00 | ||||
| 2026-01-27 | 13F | Zurcher Kantonalbank (Zurich Cantonalbank) | 3.562 | 1.046 | ||||||
| 2026-01-29 | 13F | Teachers Retirement System Of The State Of Kentucky | 4.194 | -11,78 | 1 | 0,00 | ||||
| 2026-02-09 | 13F | Quest Partners LLC | 96 | -23,81 | 28 | -6,67 | ||||
| 2026-02-13 | 13F | Greenline Wealth Management LLC | 44 | 13 | ||||||
| 2025-11-07 | 13F | Rialto Wealth Management, LLC | 0 | -100,00 | 0 | |||||
| 2026-04-02 | 13F | Hilltop National Bank | 824 | 20,64 | 215 | 7,00 | ||||
| 2026-01-28 | 13F | Teacher Retirement System Of Texas | 0 | -100,00 | 0 | -100,00 | ||||
| 2026-02-12 | 13F | Bank Of Montreal /can/ | 1.674 | -14,07 | 491 | 4,03 | ||||
| 2026-02-17 | 13F | Fmr Llc | 213.697 | 10.836,39 | 62.726 | 13.133,33 | ||||
| 2026-02-05 | 13F | Plante Moran Financial Advisors, LLC | 25 | 7 | ||||||
| 2026-02-13 | 13F | Mml Investors Services, Llc | 3.059 | 10,27 | 898 | 33,28 | ||||
| 2026-04-13 | 13F | Mather Group, Llc. | 42 | 11 | ||||||
| 2026-02-12 | 13F | Wasatch Advisors Inc | 666.473 | 11,02 | 195.630 | 34,24 | ||||
| 2026-02-10 | 13F | Moors & Cabot, Inc. | 951 | 0,00 | 279 | 21,30 | ||||
| 2026-02-13 | 13F | Pinnacle Wealth Planning Services, Inc. | 347 | 102 | ||||||
| 2026-04-14 | 13F | Bay Harbor Wealth Management, LLC | 1 | 0 | ||||||
| 2026-02-06 | 13F | EverSource Wealth Advisors, LLC | 58 | -36,26 | 17 | -22,73 | ||||
| 2026-02-06 | 13F | Covestor Ltd | 768 | 2,13 | 0 | |||||
| 2026-02-17 | 13F | Creative Planning | 13.228 | 115,37 | 3.883 | 160,54 | ||||
| 2026-01-26 | 13F | Cwm, Llc | 110 | 83,33 | 0 | |||||
| 2026-02-06 | 13F | Larson Financial Group LLC | 1 | 0 | ||||||
| 2026-02-10 | 13F | Bnp Paribas Arbitrage, Sa | 3.776 | -26,39 | 1.108 | -11,00 | ||||
| 2026-02-06 | 13F | HighTower Advisors, LLC | 1.629 | -4,74 | 478 | 15,18 | ||||
| 2026-04-07 | 13F | Farther Finance Advisors, LLC | 115 | 43,75 | 30 | 26,09 | ||||
| 2026-04-14 | 13F | Congress Asset Management Co /ma | 252.348 | 13,95 | 65.757 | 1,16 | ||||
| 2025-11-21 | 13F/A | CIBC Bancorp USA Inc. | 1.738 | 422 | ||||||
| 2026-02-10 | 13F | Bridges Investment Management Inc | 879 | -20,81 | 258 | -4,09 | ||||
| 2026-02-17 | 13F | Susquehanna Portfolio Strategies, LLC | 20.915 | -14,45 | 6.139 | 3,45 | ||||
| 2026-01-30 | 13F | Caldwell Securities, Inc | 2.078 | -31,01 | 610 | -16,69 | ||||
| 2026-02-09 | 13F | Keating Financial Advisory Services, Inc. | 5 | 1 | ||||||
| 2025-10-14 | 13F | Matrix Trust Co | 0 | -100,00 | 0 | |||||
| 2026-01-12 | 13F | DAVENPORT & Co LLC | 5.263 | 15,77 | 1.545 | 39,98 | ||||
| 2026-01-21 | 13F | Sound Income Strategies, LLC | 21 | 7 | ||||||
| 2026-01-16 | 13F | Ronald Blue Trust, Inc. | 194 | 0,00 | 57 | 19,15 | ||||
| 2026-02-13 | 13F | Financial Network Wealth Advisors LLC | 11 | 0,00 | 3 | 50,00 | ||||
| 2026-02-17 | 13F | Numerai GP LLC | 0 | -100,00 | 0 | |||||
| 2026-01-20 | 13F | Monticello Wealth Management, Llc | 18.272 | 0,00 | 5.363 | 20,92 | ||||
| 2026-02-17 | 13F | Freestone Grove Partners LP | 0 | -100,00 | 0 | |||||
| 2026-02-13 | 13F | Manufacturers Life Insurance Company, The | 0 | -100,00 | 0 | |||||
| 2026-04-09 | 13F | Moody National Bank Trust Division | 776 | -11,82 | 202 | -21,71 | ||||
| 2025-10-24 | 13F | Hemington Wealth Management | 8 | -42,86 | 0 | |||||
| 2026-02-11 | 13F | Rise Advisors, LLC | 0 | -100,00 | 0 | |||||
| 2026-02-10 | 13F/A | Northwestern Mutual Wealth Management Co | 4.029 | 0,00 | 1.183 | 20,86 | ||||
| 2026-02-10 | 13F | Goldman Sachs Group Inc | 218.665 | 111,49 | 64.185 | 155,72 | ||||
| 2025-10-21 | 13F | True Wealth Design, LLC | 0 | -100,00 | 0 | |||||
| 2026-02-17 | 13F | Canada Pension Plan Investment Board | 1.300 | 382 | ||||||
| 2025-10-28 | 13F | First National Corp /ma/ /adv | 2.815 | -1,12 | 710 | -13,11 | ||||
| 2026-02-12 | 13F | Quadrant Capital Group Llc | 124 | -3,12 | 36 | 16,13 | ||||
| 2025-11-13 | 13F | Ensign Peak Advisors, Inc | 0 | -100,00 | 0 | |||||
| 2026-02-13 | 13F | Smartleaf Asset Management LLC | 471 | 528,00 | 142 | 688,89 | ||||
| 2026-02-17 | 13F | Maryland State Retirement & Pension System | 2.439 | 0,99 | 716 | 22,01 | ||||
| 2026-01-12 | 13F | Daymark Wealth Partners, Llc | 1.809 | 0,11 | 531 | 21,23 | ||||
| 2026-01-28 | 13F | Marietta Wealth Management, LLC | 0 | -100,00 | 0 | |||||
| 2026-02-17 | 13F | Millennium Management Llc | 14.854 | -66,78 | 4.360 | -59,83 | ||||
| 2026-01-29 | 13F | Pictet Asset Management Holding SA | 2.639 | 7,49 | 775 | 30,08 | ||||
| 2026-02-13 | 13F | Toroso Investments, LLC | 42.273 | -16,94 | 12.408 | 0,43 | ||||
| 2026-02-17 | 13F | Abel Hall, LLC | 779 | 229 | ||||||
| 2026-01-29 | 13F | Comerica Bank | 82.356 | 48,96 | 24.174 | 80,13 | ||||
| 2026-02-02 | 13F | Danske Bank A/s | 100 | 0,00 | 29 | 20,83 | ||||
| 2025-10-17 | 13F | Ethic Inc. | 0 | -100,00 | 0 | -100,00 | ||||
| 2026-01-29 | 13F | Mountain Pacific Investment Advisers Inc/id | 18.203 | 8,80 | 5.343 | 31,57 | ||||
| 2025-12-09 | 13F/A | Tudor Investment Corp Et Al | 8.613 | -61,63 | 2.091 | -67,53 | ||||
| 2026-04-08 | 13F | Wealth Enhancement Advisory Services, Llc | 3.603 | 1,66 | 948 | -15,13 | ||||
| 2026-02-13 | 13F | Heron Bay Capital Management | 16.069 | 0,15 | 4.717 | 21,11 | ||||
| 2026-02-02 | 13F | Truist Financial Corp | 1.250 | 14,47 | 367 | 38,11 | ||||
| 2026-02-13 | 13F | Citigroup Inc | 9.681 | -46,52 | 2.842 | -35,34 | ||||
| 2026-02-18 | 13F | GWM Advisors LLC | 1.336 | 1,98 | 392 | 23,27 | ||||
| 2026-02-10 | 13F | Norges Bank | 294.434 | 86.425 | ||||||
| 2026-02-12 | 13F | Aviva Plc | 1.725 | -7,95 | 506 | 11,45 | ||||
| 2026-02-10 | 13F | Intech Investment Management Llc | 6.045 | -25,48 | 1.774 | -9,90 | ||||
| 2026-02-11 | 13F | Illinois Municipal Retirement Fund | 7.968 | -16,29 | 2.339 | 1,21 | ||||
| 2026-04-09 | 13F | Nelson, Van Denburg & Campbell Wealth Management Group, LLC | 2.502 | -9,02 | 652 | -19,33 | ||||
| 2026-01-30 | 13F | CBOE Vest Financial, LLC | 9.108 | 11,37 | 2.673 | 34,66 | ||||
| 2026-02-17 | 13F | DV Trading LLC | 200 | 59 | ||||||
| 2026-02-12 | 13F | Loomis Sayles & Co L P | 111.857 | -4,46 | 32.833 | 15,52 | ||||
| 2026-02-17 | 13F | Man Group plc | 1.820 | 9,05 | 534 | 31,85 | ||||
| 2026-02-17 | 13F | Russell Investments Group, Ltd. | 1.683 | -0,88 | 494 | 19,90 | ||||
| 2026-02-13 | 13F | Public Employees Retirement Association Of Colorado | 1.216 | 0,00 | 0 | |||||
| 2026-02-12 | 13F | Rossby Financial, LCC | 2 | 1 | ||||||
| 2026-02-05 | 13F | Allworth Financial LP | 66 | 22,22 | 19 | 46,15 | ||||
| 2026-01-29 | 13F | UMA Financial Services, Inc. | 30 | 0,00 | 9 | 14,29 | ||||
| 2026-01-09 | 13F | Assenagon Asset Management S.A. | 2.510 | 737 | ||||||
| 2026-02-06 | 13F | Bare Financial Services, Inc | 33 | 17,86 | 10 | 50,00 | ||||
| 2026-02-17 | 13F | Glenmede Trust Co Na | 5.816 | 25,91 | 1.707 | 26,82 | ||||
| 2026-02-10 | 13F | Meramec Financial Planners, LLC | 10 | 3 | ||||||
| 2026-02-11 | 13F | LPL Financial LLC | 21.060 | -3,09 | 6.182 | 17,18 | ||||
| 2026-02-13 | 13F | Y-Intercept (Hong Kong) Ltd | 0 | -100,00 | 0 | -100,00 | ||||
| 2026-02-17 | 13F | Brevan Howard Capital Management LP | 0 | -100,00 | 0 | |||||
| 2026-02-13 | 13F | Public Sector Pension Investment Board | 0 | -100,00 | 0 | |||||
| 2026-04-10 | 13F | Pure Financial Advisors, Inc. | 1.753 | -0,17 | 457 | -11,46 | ||||
| 2026-02-11 | 13F | Janney Montgomery Scott LLC | 1.754 | 6,24 | 1 | |||||
| 2026-02-03 | 13F | K.J. Harrison & Partners Inc | 2.400 | 704 | ||||||
| 2026-02-13 | 13F | First Trust Advisors Lp | 382.174 | 28,12 | 112.180 | 54,92 | ||||
| 2026-01-12 | 13F | Professional Advisory Services Inc | 800 | 0 | ||||||
| 2026-01-29 | 13F | Sanctuary Advisors, LLC | 984 | 8,13 | 289 | 30,91 | ||||
| 2026-02-13 | 13F | Morgan Stanley | 669.601 | 19,58 | 196.549 | 44,60 | ||||
| 2026-02-04 | 13F | Schwartz Investment Counsel Inc | 26.000 | 7.632 | ||||||
| 2026-02-12 | 13F | Cibc World Markets Corp | 1.079 | -46,29 | 317 | -45,14 | ||||
| 2026-01-21 | 13F | Azzad Asset Management Inc /adv | 3.481 | 3,11 | 1.022 | 24,66 | ||||
| 2025-11-17 | 13F | Caxton Associates Llp | 0 | -100,00 | 0 | -100,00 | ||||
| 2026-01-16 | 13F | Crewe Advisors LLC | 44 | 10,00 | 13 | 33,33 | ||||
| 2026-02-11 | 13F | Walter & Keenan Financial Consulting Co /mi/ /adv | 8.015 | 0,19 | 2.353 | 21,11 | ||||
| 2026-01-13 | 13F | Dakota Wealth Management | 685 | 201 | ||||||
| 2026-02-17 | 13F | Kensington Investment Counsel, LLC | 6.254 | -16,74 | 1.836 | 0,66 | ||||
| 2026-02-17 | 13F | Citadel Advisors Llc | Put | 800 | 235 | |||||
| 2026-02-17 | 13F | Citadel Advisors Llc | Call | 2.900 | -69,47 | 851 | -63,10 | |||
| 2026-02-12 | 13F | BlackRock, Inc. | 2.407.891 | 1,80 | 706.788 | 23,09 | ||||
| 2026-04-02 | 13F | MJT & Associates Financial Advisory Group, Inc. | 12 | 0,00 | 3 | 0,00 | ||||
| 2026-02-17 | 13F | Main Street Financial Solutions, LLC | 804 | 236 | ||||||
| 2026-01-13 | 13F | Riverbridge Partners Llc | 130.412 | -9,57 | 38.280 | 9,35 | ||||
| 2026-04-10 | 13F | Abound Wealth Management | 0 | -100,00 | 0 | |||||
| 2026-01-21 | 13F | Clayton Financial Group LLC | 0 | -100,00 | 0 | |||||
| 2026-02-13 | 13F | Barclays Plc | 25.429 | 8,56 | 7.464 | 31,29 | ||||
| 2026-02-17 | 13F | Holocene Advisors, LP | 2.577 | 756 | ||||||
| 2026-02-17 | 13F | Jones Financial Companies Lllp | 75 | -11,76 | 22 | 10,00 | ||||
| 2025-11-03 | 13F | Townsquare Capital Llc | 0 | -100,00 | 0 | -100,00 | ||||
| 2026-02-17 | 13F | Northern Trust Corp | 199.802 | -3,92 | 58.648 | 16,18 | ||||
| 2026-04-06 | 13F | Washington Trust Advisors, Inc. | 3.900 | -4,88 | 1.016 | -15,54 | ||||
| 2026-02-09 | 13F | Geode Capital Management, Llc | 392.802 | -0,12 | 115.318 | 20,78 | ||||
| 2026-01-21 | 13F | Portside Wealth Group, LLC | 1.456 | 11,91 | 427 | 35,56 | ||||
| 2026-02-12 | 13F | Ankerstar Wealth, LLC | 2 | 1 | ||||||
| 2026-02-17 | 13F | Susquehanna Fundamental Investments, Llc | 4.711 | 20,95 | 1.383 | 46,24 | ||||
| 2026-02-12 | 13F | Nuveen, LLC | 37.378 | -2,28 | 10.972 | 18,17 | ||||
| 2026-02-17 | 13F | Quantinno Capital Management LP | 9.477 | 432,72 | 2.782 | 545,24 | ||||
| 2026-02-19 | 13F | Invesco Ltd. | 70.144 | 29,87 | 20.589 | 57,04 | ||||
| 2026-01-15 | 13F | Fortitude Family Office, LLC | 2 | -33,33 | 1 | |||||
| 2026-02-17 | 13F | Cresset Asset Management, LLC | 1.094 | 5,70 | 321 | 27,89 | ||||
| 2026-01-30 | 13F | North Star Investment Management Corp. | 51 | 0,00 | 15 | 16,67 | ||||
| 2026-01-29 | 13F | UBS Group AG | 135.821 | 311,88 | 39.868 | 398,09 | ||||
| 2026-02-13 | 13F | Segall Bryant & Hamill, Llc | 46.244 | 4,69 | 13.574 | 26,60 | ||||
| 2026-01-28 | 13F | Klp Kapitalforvaltning As | 3.580 | 2,29 | 1.051 | 23,67 | ||||
| 2026-01-30 | 13F | Moody Aldrich Partners Llc | 17.540 | 116,20 | 5.149 | 161,45 | ||||
| 2026-04-13 | 13F | Creative Financial Designs Inc /adv | 3 | 0,00 | 1 | |||||
| 2026-02-05 | 13F | Thrivent Financial For Lutherans | 185.070 | 1.337,10 | 54 | 1.700,00 | ||||
| 2026-02-06 | 13F | Van Hulzen Asset Management, LLC | 5.388 | -8,02 | 1.582 | 11,18 | ||||
| 2026-02-17 | 13F | Advisor Group Holdings, Inc. | 29.624 | -7,63 | 8.695 | 10,96 | ||||
| 2026-02-10 | 13F | Commonwealth Of Pennsylvania Public School Empls Retrmt Sys | 4.131 | -3,46 | 1.213 | 16,76 | ||||
| 2026-02-06 | 13F | Warner Group LLC | 2.313 | 679 | ||||||
| 2026-02-13 | 13F | Parkside Financial Bank & Trust | 244 | -3,94 | 72 | 16,39 | ||||
| 2026-02-18 | 13F | Beacon Pointe Advisors, LLC | 12.511 | -2,43 | 3.672 | 17,99 | ||||
| 2026-02-10 | 13F | Bank of New York Mellon Corp | 106.087 | -5,52 | 31.140 | 14,25 | ||||
| 2026-04-07 | 13F | Anderson Hoagland & Co | 795 | -36,14 | 207 | -43,29 | ||||
| 2026-02-17 | 13F | D. E. Shaw & Co., Inc. | 0 | -100,00 | 0 | |||||
| 2026-02-17 | 13F | California State Teachers Retirement System | 15.789 | -0,09 | 4.635 | 20,80 | ||||
| 2026-01-28 | 13F | Cadinha & Co Llc | 4.283 | 0,00 | 1.257 | 20,98 | ||||
| 2026-02-09 | 13F | Morningstar Investment Management LLC | 0 | -100,00 | 0 | -100,00 | ||||
| 2026-02-12 | 13F | Xponance, Inc. | 1.284 | 0,94 | 377 | 22,08 | ||||
| 2026-02-02 | 13F | Strs Ohio | 1.300 | 30,00 | 382 | 57,44 | ||||
| 2026-02-17 | 13F | MIRAE ASSET GLOBAL ETFS HOLDINGS Ltd. | 121.893 | 2,40 | 35.781 | 23,83 | ||||
| 2026-02-12 | 13F | Wealthspire Advisors, LLC | 0 | -100,00 | 0 | |||||
| 2026-02-17 | 13F | Private Advisor Group, LLC | 733 | 215 | ||||||
| 2026-02-14 | 13F | Rockefeller Capital Management L.P. | 47.485 | -16,74 | 13.938 | 0,67 | ||||
| 2026-02-04 | 13F | Pacer Advisors, Inc. | 0 | -100,00 | 0 | -100,00 | ||||
| 2025-11-13 | 13F | Glenmede Investment Management, LP | 4.290 | -20,70 | 1.041 | -32,88 | ||||
| 2026-01-28 | 13F | HB Wealth Management, LLC | 3.205 | -4,78 | 941 | 15,06 | ||||
| 2025-11-12 | 13F | American Century Companies Inc | 0 | -100,00 | 0 | |||||
| 2026-02-17 | 13F | Scientech Research LLC | 717 | 210 | ||||||
| 2026-02-05 | 13F | Bessemer Group Inc | 104.700 | 1.708,29 | 31 | 2.900,00 | ||||
| 2026-01-30 | 13F | State of New Jersey Common Pension Fund D | 8.970 | 8,54 | 2.633 | 31,21 | ||||
| 2026-02-17 | 13F | Qube Research & Technologies Ltd | 0 | -100,00 | 0 | |||||
| 2026-02-13 | 13F | Cynosure Management, Llc | 0 | -100,00 | 0 | -100,00 | ||||
| 2026-04-07 | 13F | Park Avenue Securities Llc | 0 | -100,00 | 0 | |||||
| 2026-02-17 | 13F | Bank Of America Corp /de/ | 141.496 | 17,46 | 41.533 | 42,04 | ||||
| 2025-11-12 | 13F | Aster Capital Management (DIFC) Ltd | 0 | -100,00 | 0 | -100,00 | ||||
| 2026-04-10 | 13F | Jacobson & Schmitt Advisors, Llc | 63.736 | 2,00 | 16.608 | -9,44 | ||||
| 2026-02-06 | 13F | Vestmark Advisory Solutions, Inc. | 1.235 | 363 | ||||||
| 2026-01-27 | 13F | GHP Investment Advisors, Inc. | 262 | 0,00 | 77 | 20,63 | ||||
| 2026-02-13 | 13F | Bridgewater Associates, LP | 9.593 | 2.816 | ||||||
| 2026-02-13 | 13F | Southernsun Asset Management, Llc | 66.748 | 19.593 | ||||||
| 2026-04-07 | 13F | Signaturefd, Llc | 1.546 | -1,09 | 403 | -12,23 | ||||
| 2026-02-12 | 13F | CIBC Private Wealth Group, LLC | 116 | -7,20 | 34 | 13,33 | ||||
| 2026-02-12 | 13F | Swiss National Bank | 33.149 | 1,84 | 9.730 | 23,15 | ||||
| 2026-01-14 | 13F | Spire Wealth Management | 24 | 0,00 | 7 | 40,00 | ||||
| 2026-01-14 | 13F | Jfs Wealth Advisors, Llc | 12 | 20,00 | 4 | 50,00 | ||||
| 2026-02-13 | 13F | Commerce Bank | 1.611 | 473 | ||||||
| 2026-02-12 | 13F | Cloud Capital Management, LLC | 0 | -100,00 | 0 | |||||
| 2025-11-14 | 13F | DRW Securities, LLC | 0 | -100,00 | 0 | -100,00 | ||||
| 2026-02-17 | 13F | State Of Wisconsin Investment Board | 901 | -43,76 | 264 | -31,96 | ||||
| 2025-11-13 | 13F | Capital Research Global Investors | 0 | -100,00 | 0 | -100,00 | ||||
| 2026-01-26 | 13F | Whittier Trust Co | 202 | 0,00 | 64 | 26,00 | ||||
| 2026-02-17 | 13F | Port Capital LLC | 5.900 | 0,00 | 1.732 | 20,88 | ||||
| 2026-02-13 | 13F | Wells Fargo & Company/mn | 80.643 | 14,46 | 23.671 | 38,40 | ||||
| 2026-04-13 | 13F | Massmutual Trust Co Fsb/adv | 10 | -9,09 | 3 | -33,33 | ||||
| 2026-02-13 | 13F | Edgestream Partners, L.P. | 0 | -100,00 | 0 | |||||
| 2026-02-02 | 13F | Oppenheimer Asset Management Inc. | 13.884 | 1,92 | 4.075 | 23,26 | ||||
| 2026-02-11 | 13F | Jpmorgan Chase & Co | 23.924 | -48,30 | 7.022 | -37,49 | ||||
| 2026-02-17 | 13F | Fred Alger Management, Llc | 27.626 | -2,07 | 8.109 | 18,43 | ||||
| 2026-02-11 | 13F | Zions Bancorporation, National Association /ut/ | 3.752 | -6,62 | 1.101 | 12,92 | ||||
| 2026-02-13 | 13F | Champlain Investment Partners, LLC | 0 | -100,00 | 0 | |||||
| 2026-02-17 | 13F | Wiley Bros.-aintree Capital, Llc | 1.383 | 15,83 | 406 | 40,14 | ||||
| 2026-02-17 | 13F | Zimmer Partners, LP | 0 | -100,00 | 0 | -100,00 | ||||
| 2026-02-13 | 13F | Ubs Asset Management Americas Inc | 27.034 | 2,25 | 7.935 | 23,64 | ||||
| 2026-02-17 | 13F | Advisory Services Network, LLC | 0 | -100,00 | 0 | |||||
| 2025-11-13 | 13F | Dynamic Technology Lab Private Ltd | 0 | -100,00 | 0 | -100,00 | ||||
| 2026-02-17 | 13F | First Manhattan Co | 0 | -100,00 | 0 | |||||
| 2026-02-04 | 13F | Dogwood Wealth Management LLC | 11 | 3 | ||||||
| 2026-01-07 | 13F | Harbor Investment Advisory, Llc | 314 | -20,10 | 92 | -3,16 | ||||
| 2026-02-06 | 13F | Profund Advisors Llc | 1.290 | 379 | ||||||
| 2026-02-13 | 13F | Langdon Equity Partners | 82.282 | 26.419 | ||||||
| 2025-11-14 | 13F | Aigen Investment Management, Lp | 0 | -100,00 | 0 | -100,00 | ||||
| 2026-02-19 | 13F/A | T. Rowe Price Investment Management, Inc. | 277.351 | 61,25 | 81 | 97,56 | ||||
| 2026-02-11 | 13F | Deutsche Bank Ag\ | 13.748 | 6,31 | 4.035 | 28,54 | ||||
| 2026-02-17 | 13F | Raymond James Financial Inc | 110.821 | 22,87 | 32.889 | 50,22 | ||||
| 2026-02-12 | 13F | MetLife Investment Management, LLC | 9.058 | -5,03 | 2.659 | 14,82 | ||||
| 2026-02-17 | 13F | Alliancebernstein L.p. | 17.728 | -1,25 | 5.204 | 19,42 | ||||
| 2026-02-13 | 13F | Prudential Financial Inc | 15.575 | -7,03 | 4.572 | 12,42 | ||||
| 2026-02-11 | 13F | Saturna Capital CORP | 3.042 | 893 | ||||||
| 2025-11-14 | 13F | Sherbrooke Park Advisers Llc | 0 | -100,00 | 0 | -100,00 | ||||
| 2026-02-09 | 13F | Legal & General Group Plc | 42.405 | -4,06 | 12.471 | 16,17 | ||||
| 2026-02-06 | 13F | Global Retirement Partners, LLC | 107 | -5,31 | 31 | 14,81 | ||||
| 2026-02-26 | 13F | Anchor Investment Management, LLC | 1.135 | -3,24 | 333 | 17,25 | ||||
| 2026-02-13 | 13F | Johnson Investment Counsel Inc | 0 | -100,00 | 0 | |||||
| 2026-01-26 | 13F | PFG Investments, LLC | 2.939 | -5,19 | 863 | 14,63 | ||||
| 2026-04-06 | 13F | Versant Capital Management, Inc | 77 | 285,00 | 20 | 300,00 | ||||
| 2026-02-13 | 13F | Colony Group, LLC | 5.735 | -10,84 | 1.683 | 8,86 | ||||
| 2025-10-27 | 13F | Stephens Inc /ar/ | 0 | -100,00 | 0 | -100,00 | ||||
| 2026-02-12 | 13F | Jane Street Group, Llc | Call | 2.500 | 4,17 | 734 | 25,95 | |||
| 2026-02-17 | 13F | Engineers Gate Manager LP | 0 | -100,00 | 0 | -100,00 | ||||
| 2026-02-13 | 13F | SRS Capital Advisors, Inc. | 95 | -94,08 | 28 | -93,06 | ||||
| 2026-02-12 | 13F | Summit Financial, LLC | 0 | -100,00 | 0 | |||||
| 2025-11-14 | 13F | Algert Global Llc | 0 | -100,00 | 0 | |||||
| 2025-11-14 | 13F | Centiva Capital, LP | 0 | -100,00 | 0 | |||||
| 2025-11-21 | 13F | Nebula Research & Development LLC | 0 | -100,00 | 0 | |||||
| 2026-01-28 | 13F | Arizona State Retirement System | 4.681 | -5,87 | 1.374 | 13,84 | ||||
| 2026-02-17 | 13F | Cetera Investment Advisers | 2.782 | -10,98 | 817 | 7,65 | ||||
| 2026-02-06 | 13F | Pnc Financial Services Group, Inc. | 1.689 | 120,50 | 496 | 167,57 | ||||
| 2026-02-12 | 13F | Jane Street Group, Llc | 0 | -100,00 | 0 | -100,00 | ||||
| 2026-02-10 | 13F | Connor, Clark & Lunn Investment Management Ltd. | 5.207 | -60,50 | 1.528 | -52,25 | ||||
| 2026-02-05 | 13F | Td Private Client Wealth Llc | 5 | 0,00 | 1 | 0,00 | ||||
| 2026-03-10 | 13F | Montanaro Asset Management Ltd | 46.200 | 15,50 | 13.561 | 39,66 | ||||
| 2026-02-06 | 13F | Envestnet Portfolio Solutions, Inc. | 1.818 | 34,87 | 534 | 63,00 | ||||
| 2026-02-11 | 13F | Los Angeles Capital Management Llc | 6.231 | 0,00 | 1.541 | 1,92 | ||||
| 2026-02-10 | 13F | Td Asset Management Inc | 9.652 | 58,18 | 2.833 | 91,29 | ||||
| 2026-01-23 | 13F | Rsm Us Wealth Management Llc | 706 | 218 | ||||||
| 2026-02-13 | 13F | Umb Bank N A/mo | 213 | 42,00 | 63 | 72,22 | ||||
| 2026-04-13 | 13F | IFP Advisors, Inc | 21 | 5,00 | 5 | 0,00 | ||||
| 2025-11-14 | 13F | Vident Advisory, LLC | 0 | -100,00 | 0 | |||||
| 2026-01-23 | 13F | Gibbs Wealth Management | 1.835 | -7,42 | 586 | 21,83 | ||||
| 2026-01-28 | 13F | Salomon & Ludwin, LLC | 117 | -19,86 | 36 | 0,00 | ||||
| 2026-02-02 | 13F | Cornerstone Planning Group LLC | 4 | 1 | ||||||
| 2026-02-03 | 13F | Farmers & Merchants Investments Inc | 10 | 0,00 | 3 | 0,00 | ||||
| 2026-04-14 | 13F | Thurston, Springer, Miller, Herd & Titak, Inc. | 24 | 0,00 | 6 | -14,29 | ||||
| 2026-02-24 | 13F | Bell Investment Advisors, Inc | 17 | 0,00 | 5 | 0,00 | ||||
| 2026-01-23 | 13F | Yorktown Management & Research Co Inc | 1.300 | 0,00 | 382 | 20,95 | ||||
| 2026-01-30 | 13F | Us Bancorp \de\ | 2.391 | -0,79 | 702 | 19,83 | ||||
| 2026-02-10 | 13F | Natixis Advisors, L.p. | 89.055 | 1,91 | 26 | 23,81 | ||||
| 2026-02-12 | 13F | Ci Investments Inc. | 47.624 | 6,52 | 13.979 | 139.690,00 | ||||
| 2026-02-10 | 13F | Eurizon Capital SGR S.p.A. | 79 | 24 | ||||||
| 2026-01-15 | 13F | Nisa Investment Advisors, Llc | 258 | -55,97 | 76 | -47,18 | ||||
| 2025-10-29 | 13F | Vaughan David Investments Inc/il | 0 | -100,00 | 0 | |||||
| 2026-02-11 | 13F | TCTC Holdings, LLC | 1.841 | 0,00 | 540 | 21,08 | ||||
| 2026-02-11 | 13F | GW&K Investment Management, LLC | 159.197 | 47 | ||||||
| 2026-02-09 | 13F | Hartland & Co., LLC | 13 | 0,00 | 4 | 0,00 | ||||
| 2026-02-04 | 13F | Nicholas Company, Inc. | 11.210 | 29,45 | 3.290 | 56,52 | ||||
| 2026-02-12 | 13F | Steward Partners Investment Advisory, Llc | 237 | -4,05 | 70 | 16,95 | ||||
| 2025-11-04 | 13F | High Note Wealth, LLC | 0 | -100,00 | 0 | |||||
| 2026-02-12 | 13F | State Board Of Administration Of Florida Retirement System | 3.311 | 14,93 | 972 | 38,91 | ||||
| 2026-02-02 | 13F | Conestoga Capital Advisors, LLC | 633.255 | 9,39 | 185.879 | 32,27 | ||||
| 2026-01-21 | 13F | Capital Advisors, Ltd. LLC | 26 | 0 | ||||||
| 2026-02-17 | 13F | Kemnay Advisory Services Inc. | 40 | 12 | ||||||
| 2025-11-17 | 13F | Alyeska Investment Group, L.P. | 0 | -100,00 | 0 | -100,00 | ||||
| 2026-02-12 | 13F | Moerus Capital Management LLC | 6.847 | -11,99 | 2.010 | 6,41 | ||||
| 2026-01-26 | 13F | Private Trust Co Na | 66 | 13,79 | 19 | 35,71 | ||||
| 2026-02-14 | 13F | Howe & Rusling Inc | 856 | 251 | ||||||
| 2026-02-19 | 13F | CI Private Wealth, LLC | 8.841 | -17,53 | 2.617 | 0,58 | ||||
| 2026-02-17 | 13F | Blair William & Co/il | 1.095 | 332 | ||||||
| 2025-10-21 | 13F | First Pacific Financial | 0 | -100,00 | 0 | |||||
| 2025-11-13 | 13F | Inceptionr Llc | 0 | -100,00 | 0 | -100,00 | ||||
| 2026-02-13 | 13F | Bragg Financial Advisors, Inc | 19.897 | -5,28 | 5.840 | 14,53 | ||||
| 2026-02-17 | 13F | Jain Global LLC | 0 | -100,00 | 0 | |||||
| 2026-02-09 | 13F | King Luther Capital Management Corp | 29.644 | 79,33 | 8.701 | 116,87 | ||||
| 2026-02-11 | 13F | CenterBook Partners LP | 17.640 | 5.178 | ||||||
| 2026-02-17 | 13F | Ancora Advisors, LLC | 2 | 0,00 | 1 | |||||
| 2025-11-07 | 13F | Fiera Capital Corp | 0 | -100,00 | 0 | -100,00 | ||||
| 2026-04-07 | 13F | U.S. Capital Wealth Advisors, LLC | 3.300 | 0,00 | 860 | -11,26 | ||||
| 2026-02-17 | 13F | Twinbeech Capital Lp | 0 | -100,00 | 0 | |||||
| 2026-02-06 | 13F | Entrust Financial Llc | 17 | 5 | ||||||
| 2026-02-10 | 13F | Envestnet Asset Management Inc | 56.087 | -13,25 | 16.463 | 4,89 | ||||
| 2025-11-13 | 13F | O'shaughnessy Asset Management, Llc | 0 | -100,00 | 0 | -100,00 | ||||
| 2026-02-06 | 13F | ProShare Advisors LLC | 3.172 | 3,02 | 931 | 24,63 | ||||
| 2026-02-10 | 13F | AdvisorShares Investments LLC | 1.600 | 470 | ||||||
| 2025-11-07 | 13F | Hardy Reed LLC | 0 | -100,00 | 0 | |||||
| 2026-02-12 | 13F | Principal Securities, Inc. | 0 | -100,00 | 0 | |||||
| 2026-02-03 | 13F | Sequoia Financial Advisors, LLC | 3.313 | 8,30 | 972 | 31,00 | ||||
| 2026-02-17 | 13F | Silvercrest Asset Management Group Llc | 64.210 | -38,34 | 18.848 | -25,44 | ||||
| 2026-04-09 | 13F | Park Place Capital Corp | 39 | 0,00 | 10 | -9,09 | ||||
| 2026-02-11 | 13F | Parallel Advisors, LLC | 129 | 1,57 | 38 | 23,33 | ||||
| 2026-02-17 | 13F | Public Employees Retirement System Of Ohio | 12.053 | 0,07 | 3.538 | 21,01 | ||||
| 2026-04-08 | 13F | Heritage Family Offices, LLP | 0 | -100,00 | 0 | |||||
| 2026-02-13 | 13F | Channing Capital Management, LLC | 150.453 | 44.162 | ||||||
| 2026-02-06 | 13F | Tortoise Investment Management, LLC | 0 | -100,00 | 0 | |||||
| 2026-02-09 | 13F | Wcm Investment Management, Llc | 53.131 | -0,10 | 16.050 | 25,52 | ||||
| 2026-01-05 | 13F | Argent Capital Management Llc | 2.046 | -6,49 | 601 | 12,99 | ||||
| 2026-02-17 | 13F | Price T Rowe Associates Inc /md/ | 146.885 | 1,07 | 43 | 22,86 | ||||
| 2026-01-16 | 13F | HMS Capital Management, LLC | 2.254 | 0,13 | 662 | 21,06 | ||||
| 2026-01-21 | 13F | Yousif Capital Management, Llc | 4.585 | -13,21 | 1.457 | 13,65 | ||||
| 2026-02-17 | 13F | Westwood Holdings Group Inc | 2.400 | 0,00 | 704 | 20,75 | ||||
| 2026-02-05 | 13F | Cambridge Investment Research Advisors, Inc. | 2.415 | 17,01 | 1 | |||||
| 2026-01-26 | 13F | Grace & White Inc /ny | 6.080 | 0,00 | 1.785 | 20,95 | ||||
| 2026-02-17 | 13F | Summit Global Investments | 1.365 | -5,73 | 0 | |||||
| 2026-02-13 | 13F | Victory Capital Management Inc | 4.855 | 22,51 | 1.425 | 48,13 | ||||
| 2026-02-18 | 13F | Cim, Llc | 1.591 | -3,87 | 467 | 16,46 | ||||
| 2026-02-17 | 13F | Janus Henderson Group Plc | 88.110 | -3,74 | 25.864 | 16,42 | ||||
| 2026-02-10 | 13F | Mawer Investment Management Ltd. | 15.173 | 4.454 | ||||||
| 2026-02-02 | 13F | TCI Wealth Advisors, Inc. | 864 | 0,00 | 254 | 21,05 | ||||
| 2026-02-13 | 13F | Zuckerman Investment Group, LLC | 79.860 | 1,86 | 23.441 | 23,17 | ||||
| 2026-02-13 | 13F | Entropy Technologies, LP | 0 | -100,00 | 0 | |||||
| 2026-02-13 | 13F | Pathstone Holdings, LLC | 11.532 | 60,81 | 3.385 | 94,54 | ||||
| 2026-02-17 | 13F | Lombard Odier Asset Management (USA) Corp | 0 | -100,00 | 0 | |||||
| 2026-02-11 | 13F | Capital International Investors | 226.298 | 50,57 | 66.425 | 82,06 | ||||
| 2026-02-12 | 13F | Callan Family Office, LLC | 2.990 | 878 | ||||||
| 2026-02-17 | 13F | Farringdon Capital, Ltd. | 2.469 | -53,68 | 725 | -44,01 | ||||
| 2026-01-30 | 13F | Archer Investment Corp | 329 | 0,00 | 97 | 21,52 | ||||
| 2026-02-12 | 13F | Voya Investment Management Llc | 9.591 | 1,13 | 2.815 | 22,28 | ||||
| 2026-02-13 | 13F | BNP Paribas Asset Management Holding S.A. | 194 | 40,58 | 0 | |||||
| 2026-02-02 | 13F | Fifth Third Bancorp | 412 | 3,26 | 121 | 25,00 | ||||
| 2026-02-12 | 13F | Annandale Capital, LLC | 2.721 | 0,00 | 1 | -100,00 | ||||
| 2026-02-12 | 13F | Brown Brothers Harriman & Co | 15 | -93,02 | 4 | -92,31 | ||||
| 2026-02-18 | 13F | Mackenzie Financial Corp | 1.021 | 5,91 | 308 | 31,20 | ||||
| 2026-02-13 | 13F | Caitong International Asset Management Co., Ltd | 0 | -100,00 | 0 | |||||
| 2026-02-18 | 13F | State of Tennessee, Treasury Department | 5.861 | -17,94 | 1.582 | -8,71 | ||||
| 2025-11-14 | 13F | Mount Yale Investment Advisors, LLC | 0 | -100,00 | 0 | -100,00 | ||||
| 2026-02-03 | 13F | Crossmark Global Holdings, Inc. | 697 | 205 | ||||||
| 2026-02-13 | 13F | Neuberger Berman Group LLC | 390.261 | -5,56 | 114.553 | 14,20 | ||||
| 2025-11-12 | 13F | NewSquare Capital LLC | 0 | -100,00 | 0 | |||||
| 2026-02-13 | 13F | Grandeur Peak Global Advisors, LLC | 12.885 | 1,11 | 3.782 | 22,28 | ||||
| 2025-11-06 | 13F | MQS Management LLC | 0 | -100,00 | 0 | -100,00 | ||||
| 2026-04-06 | 13F | GAMMA Investing LLC | 675 | 299,41 | 176 | 257,14 | ||||
| 2026-02-05 | 13F | Amalgamated Bank | 4.838 | 1,11 | 1 | 0,00 | ||||
| 2026-02-17 | 13F | Amundi | 2.611 | -11,22 | 766 | 4,64 | ||||
| 2026-02-11 | 13F | Empowered Funds, LLC | 1.670 | -8,69 | 490 | 10,61 | ||||
| 2026-02-13 | 13F | Sei Investments Co | 61.652 | 13,89 | 18.097 | 37,72 | ||||
| 2025-11-07 | 13F | Shell Asset Management Co | 334 | -61,25 | 0 | |||||
| 2025-11-03 | 13F | Knights of Columbus Asset Advisors LLC | 0 | -100,00 | 0 | |||||
| 2026-02-02 | 13F | CENTRAL TRUST Co | 2 | 1 | ||||||
| 2026-02-17 | 13F | Susquehanna International Group, Llp | Call | 5.900 | 118,52 | 1.732 | 164,27 | |||
| 2026-02-17 | 13F | Susquehanna International Group, Llp | 3.734 | 83,22 | 1.096 | 121,86 | ||||
| 2026-02-13 | 13F | State Street Corp | 637.650 | 2,67 | 187.169 | 24,15 | ||||
| 2026-02-17 | 13F | Susquehanna International Group, Llp | Put | 3.100 | 82,35 | 910 | 120,63 | |||
| 2026-02-23 | 13F | Virtu Financial LLC | 4.154 | 1 | ||||||
| 2026-02-12 | 13F | Pitcairn Co | 0 | -100,00 | 0 | |||||
| 2026-02-12 | 13F | New York State Common Retirement Fund | 36.941 | 546,16 | 10.843 | 681,76 | ||||
| 2026-02-11 | 13F | Ameritas Investment Partners, Inc. | 1.323 | 388 | ||||||
| 2026-01-28 | 13F | Universal- Beteiligungs- und Servicegesellschaft mbH | 2.265 | 60,07 | 672 | 95,63 | ||||
| 2026-02-13 | 13F | Stifel Financial Corp | 11.586 | -3,23 | 3.401 | 17,00 | ||||
| 2025-11-03 | 13F | Annis Gardner Whiting Capital Advisors, LLC | 0 | -100,00 | 0 | |||||
| 2026-02-13 | 13F | First National Bank Of Omaha | 1.955 | 9,65 | 574 | 32,64 | ||||
| 2026-01-30 | 13F | New York State Teachers Retirement System | 3.900 | 0,00 | 1 | |||||
| 2026-02-17 | 13F | Jump Financial, LLC | 0 | -100,00 | 0 | |||||
| 2026-02-13 | 13F | Verition Fund Management LLC | 0 | -100,00 | 0 | |||||
| 2026-02-17 | 13F | Punch & Associates Investment Management, Inc. | 50.018 | 0,18 | 14.682 | 21,14 | ||||
| 2026-02-17 | 13F | Sovereign's Capital Management, LLC | 3.721 | -10,81 | 1.092 | 7,91 | ||||
| 2025-11-13 | 13F | Hsbc Holdings Plc | 0 | -100,00 | 0 | -100,00 | ||||
| 2026-01-13 | 13F | Trust Point Inc. | 1.210 | 7,65 | 355 | 30,51 | ||||
| 2026-02-13 | 13F | Wealth Alliance | 1.420 | 37,33 | 417 | 65,74 | ||||
| 2026-02-17 | 13F | Lazard Asset Management Llc | 15.636 | 47,25 | 4.590 | 78,08 | ||||
| 2026-02-06 | 13F | Handelsbanken Fonder AB | 4.869 | 0,00 | 1 | 0,00 | ||||
| 2026-01-27 | 13F | Evergreen Capital Management Llc | 1.501 | 9,24 | 441 | 32,13 | ||||
| 2026-02-17 | 13F | J. Goldman & Co LP | 10.275 | 3.016 | ||||||
| 2026-03-03 | 13F/A | Integrated Investment Consultants, LLC | 1.424 | -0,97 | 418 | 19,48 | ||||
| 2026-02-13 | 13F | Sterling Capital Management LLC | 5.830 | -32,52 | 1.711 | -18,41 | ||||
| 2026-02-11 | 13F | Everett Harris & Co /ca/ | 17.120 | -0,31 | 5.025 | 20,56 | ||||
| 2026-02-03 | 13F | Mitsubishi UFJ Kokusai Asset Management Co., Ltd. | 105 | 0,00 | 31 | 20,00 | ||||
| 2026-02-10 | 13F | Mutual Of America Capital Management Llc | 1.907 | 1,33 | 560 | 22,59 | ||||
| 2026-02-13 | 13F | Jacobs Levy Equity Management, Inc | 0 | -100,00 | 0 | -100,00 | ||||
| 2026-01-23 | 13F | State of Alaska, Department of Revenue | 9.504 | 0,62 | 3 | 0,00 | ||||
| 2026-02-10 | 13F | Root Financial Partners, LLC | 22 | -8,33 | 6 | 20,00 | ||||
| 2026-01-20 | 13F | AdvisorNet Financial, Inc | 320 | 0,00 | 94 | 20,78 | ||||
| 2026-02-10 | 13F | CIBC Asset Management Inc | 962 | 282 | ||||||
| 2026-02-12 | 13F | Renaissance Technologies Llc | 0 | -100,00 | 0 | |||||
| 2026-02-13 | 13F | Kilter Group LLC | 4 | -50,00 | 1 | 0,00 | ||||
| 2026-01-23 | 13F | Assetmark, Inc | 287 | 117,42 | 84 | 162,50 | ||||
| 2026-02-09 | 13F | Huntington National Bank | 553 | 6,14 | 162 | 28,57 | ||||
| 2026-02-17 | 13F | Citadel Advisors Llc | 0 | -100,00 | 0 | -100,00 | ||||
| 2026-02-03 | 13F | SBI Securities Co., Ltd. | 46 | -4,17 | 14 | 18,18 | ||||
| 2026-02-13 | 13F | Van Eck Associates Corp | 0 | -100,00 | 0 | |||||
| 2026-04-01 | 13F | Laurus Investment Counsel Inc. | 4.180 | 5,03 | 1.089 | -6,76 | ||||
| 2026-02-13 | 13F | Police & Firemen's Retirement System of New Jersey | 4.319 | -4,28 | 1.268 | 15,71 | ||||
| 2026-01-26 | 13F | KBC Group NV | 479 | 0,00 | 0 | |||||
| 2026-02-13 | 13F | Kestra Advisory Services, LLC | 423 | 124 | ||||||
| 2026-02-17 | 13F | Aqr Capital Management Llc | 5.842 | 14,10 | 1.715 | 38,00 | ||||
| 2026-02-04 | 13F | Swiss Life Asset Management Ltd | 1.495 | 439 | ||||||
| 2026-02-09 | 13F | New Age Alpha Advisors, LLC | 0 | -100,00 | 0 | |||||
| 2026-02-17 | 13F | Two Sigma Securities, Llc | 0 | -100,00 | 0 | |||||
| 2026-01-15 | 13F | Vaughan Nelson Investment Management, L.p. | 182.040 | 5,81 | 53.434 | 27,95 | ||||
| 2025-11-13 | 13F/A | Peak6 Llc | Call | 0 | -100,00 | 0 | ||||
| 2025-10-31 | 13F | Whittier Trust Co Of Nevada Inc | 0 | -100,00 | 0 | |||||
| 2026-02-12 | 13F | Brinker Capital Investments, LLC | 773 | 227 | ||||||
| 2026-01-27 | 13F | Tributary Capital Management, LLC | 59.246 | 3,53 | 17.390 | 25,19 | ||||
| 2025-11-14 | 13F | Squarepoint Ops LLC | 0 | -100,00 | 0 | -100,00 | ||||
| 2026-02-13 | 13F | Great West Life Assurance Co /can/ | 14.516 | -28,06 | 4 | 0,00 | ||||
| 2026-02-17 | 13F | Ameriprise Financial Inc | 79.882 | 5,36 | 23.448 | 27,41 | ||||
| 2026-02-13 | 13F | JustInvest LLC | 2.135 | 36,77 | 627 | 65,61 | ||||
| 2026-02-17 | 13F | Df Dent & Co Inc | 0 | -100,00 | 0 | |||||
| 2025-11-06 | 13F | Ameritas Advisory Services, LLC | 0 | -100,00 | 0 | |||||
| 2026-02-17 | 13F | Perbak Capital Partners LLP | 1.401 | -64,04 | 411 | -56,51 | ||||
| 2025-12-29 | 13F | Cape Investment Advisory, Inc. | 0 | -100,00 | 0 | |||||
| 2026-02-06 | 13F | Mraz, Amerine & Associates, Inc. | 1.030 | -35,62 | 302 | -22,16 | ||||
| 2026-02-13 | 13F | Charles Schwab Investment Management Inc | 174.829 | 4,33 | 51.318 | 26,15 | ||||
| 2026-02-13 | 13F | Kayne Anderson Rudnick Investment Management Llc | 392.110 | -3,71 | 115.096 | 16,44 | ||||
| 2026-02-11 | 13F | Gilpin Wealth Management, Llc | 1 | 0 | ||||||
| 2026-02-11 | 13F | Horizon Kinetics Asset Management Llc | 0 | -100,00 | 0 | |||||
| 2025-11-13 | 13F | FORA Capital, LLC | 0 | -100,00 | 0 | |||||
| 2026-04-08 | 13F | Sandbox Financial Partners, LLC | 1.000 | 0,00 | 261 | -11,26 | ||||
| 2025-11-13 | 13F | Riggs Asset Managment Co. Inc. | 0 | -100,00 | 0 | |||||
| 2026-04-07 | 13F | Eastern Bank | 415 | 0,00 | 108 | -10,74 | ||||
| 2026-02-13 | 13F | Quarry LP | 0 | -100,00 | 0 | |||||
| 2026-02-12 | 13F | Alps Advisors Inc | 1.869 | -1,06 | 549 | 19,65 | ||||
| 2026-02-17 | 13F | SageView Advisory Group, LLC | 19.457 | -20,65 | 5.711 | -4,05 | ||||
| 2026-02-02 | 13F | Principal Financial Group Inc | 79.776 | -1,76 | 23.417 | 18,78 | ||||
| 2026-02-17 | 13F | Select Equity Group, L.P. | 108.194 | 30,28 | 31.758 | 57,54 | ||||
| 2025-11-14 | 13F | Two Sigma Investments, Lp | 0 | -100,00 | 0 | |||||
| 2026-02-11 | 13F | Capital World Investors | 1.052.480 | 0,64 | 308.934 | 21,70 | ||||
| 2026-02-13 | 13F | Destination Wealth Management | 1.228 | 0,00 | 360 | 20,81 | ||||
| 2026-01-09 | 13F | SG Americas Securities, LLC | 135.984 | 11.424,07 | 40 | |||||
| 2026-01-20 | 13F | Harbor Capital Advisors, Inc. | 8.038 | -8,64 | 2 | 0,00 | ||||
| 2026-02-10 | 13F | Quantbot Technologies LP | 0 | -100,00 | 0 | |||||
| 2026-04-09 | 13F | Mechanics Bank Trust Department | 1.920 | 0,00 | 500 | -11,19 | ||||
| 2025-11-14 | 13F | Skopos Labs, Inc. | 0 | -100,00 | 0 | |||||
| 2026-02-13 | 13F | LRT Capital Management, LLC | 0 | -100,00 | 0 | |||||
| 2026-02-04 | 13F | Oregon Public Employees Retirement Fund | 3.848 | 2,53 | 1.130 | 23,93 | ||||
| 2026-02-09 | 13F | Hantz Financial Services, Inc. | 151 | 235,56 | 0 | |||||
| 2026-02-02 | 13F | Montag A & Associates Inc | 0 | -100,00 | 0 | |||||
| 2026-02-04 | 13F | Community Bank, N.A. | 28 | 0,00 | 8 | 33,33 | ||||
| 2026-01-29 | 13F | Cornerstone Investment Partners, LLC | 1.197 | 351 |