Grundlæggende statistik
| Institutionelle ejere | 265 total, 254 long only, 0 short only, 11 long/short - change of -60,34% MRQ |
| Gennemsnitlig porteføljeallokering | 0.1368 % - change of -36,53% MRQ |
| Institutionelle aktier (lange) | 80.225.998 (ex 13D/G) - change of -25,85MM shares -24,29% MRQ |
| Institutionel værdi (lang) | $ 2.130.885 USD ($1000) |
Institutionelt ejerskab og aktionærer
Civitas Resources, Inc. (US:CIVI) har 265 institutionelle ejere og aktionærer, der har indsendt 13D/G- eller 13F-formularer til Securities Exchange Commission (SEC). Disse institutioner har i alt 80,225,998 aktier. Største aktionærer omfatter Canada Pension Plan Investment Board, Vanguard Group Inc, BlackRock, Inc., Kimmeridge Energy Management Company, LLC, Donald Smith & Co., Inc., Aristeia Capital Llc, Millennium Management Llc, State Street Corp, Dimensional Fund Advisors Lp, and American Century Companies Inc .
Civitas Resources, Inc. (NYSE:CIVI) institutionel ejerskabsstruktur viser aktuelle positioner i virksomheden efter institutioner og fonde, samt seneste ændringer i positionsstørrelse. Større aktionærer kan omfatte individuelle investorer, investeringsforeninger, hedgefonde eller institutioner. Skema 13D angiver, at investoren besidder (eller besidder) mere end 5 % af virksomheden og har til hensigt (eller har til hensigt at) aktivt at forfølge en ændring i forretningsstrategi. Skema 13G indikerer en passiv investering på over 5%.
The share price as of January 30, 2026 is 0,00 / share. Previously, on April 30, 2025, the share price was 27,25 / share. This represents a decline of 100,00% over that period.

Fondens stemningsscore
Fund Sentiment Score (fka Ownership Accumulation Score) finder de aktier, der bliver mest købt af fonde. Det er resultatet af en sofistikeret, multi-faktor kvantitativ model, der identificerer virksomheder med de højeste niveauer af institutionel akkumulering. Scoringsmodellen bruger en kombination af den samlede stigning i oplyste ejere, ændringerne i porteføljeallokeringer i disse ejere og andre målinger. Tallet går fra 0 til 100, hvor højere tal indikerer et højere niveau af akkumulering for sine jævnaldrende, og 50 er gennemsnittet.
Opdateringsfrekvens: Dagligt
Se Ownership Explorer, som giver en liste over højest rangerende virksomheder.
AI+ Ask Fintel’s AI assistant about Civitas Resources, Inc..
Select a question to share a public post with an AI-crafted answer.
Thinking of good questions…
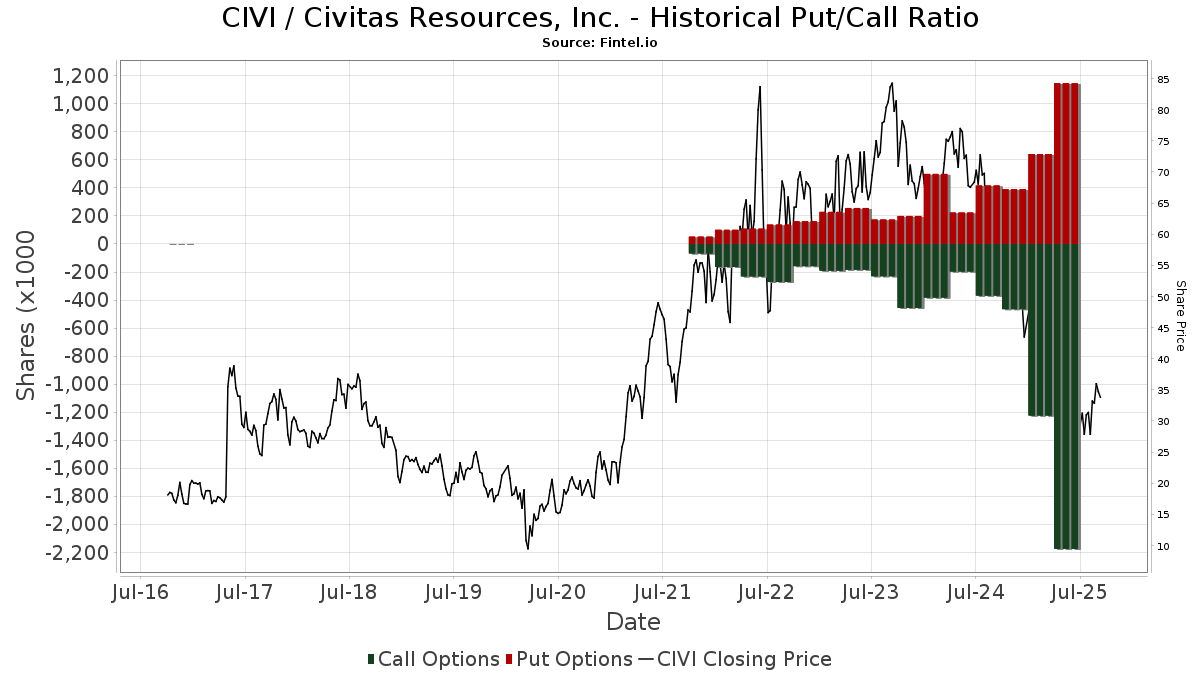
Institutionel Put/Call-forhold
Ud over at indberette standardaktie- og gældsudstedelser skal institutter med mere end 100 mill. aktiver under forvaltning også oplyse deres put- og call-optionsbeholdninger. Da salgsoptioner generelt indikerer negativ stemning, og købsoptioner indikerer positiv stemning, kan vi få en fornemmelse af den overordnede institutionelle stemning ved at plotte forholdet mellem put og kald. Diagrammet til højre viser det historiske put/call-forhold for dette instrument.
Brug af Put/Call Ratio som en indikator for investorernes stemning overvinder en af de vigtigste mangler ved at bruge totalt institutionelt ejerskab, som er, at en betydelig mængde af aktiver under forvaltning investeres passivt for at spore indekser. Passivt forvaltede fonde køber typisk ikke optioner, så indikatoren for put/call-forholdet følger mere nøje følelsen af aktivt forvaltede fonde.
13D/G-arkivering
Vi præsenterer 13D/G ansøgninger separat fra 13F ansøgninger på grund af den forskellige behandling af SEC. 13D/G-ansøgninger kan indgives af grupper af investorer (med én ledende), hvorimod 13F-ansøgninger ikke kan. Dette resulterer i situationer, hvor en investor kan indsende en 13D/G, der rapporterer én værdi for de samlede aktier (der repræsenterer alle de aktier, der ejes af investorgruppen), men derefter indsender en 13F, der rapporterer en anden værdi for de samlede aktier (der udelukkende repræsenterer deres egne) ejendomsret). Det betyder, at aktieejerskab af 13D/G-arkiver og 13F-arkiveringer ofte ikke er direkte sammenlignelige, så vi præsenterer dem separat.
Bemærk: Fra den 16. maj 2021 viser vi ikke længere ejere, der ikke har indsendt en 13D/G inden for det seneste år. Tidligere viste vi den fulde historie af 13D/G-arkiver. Generelt skal enheder, der er forpligtet til at indgive 13D/G-ansøgninger, indgive mindst årligt, før de indsender en afsluttende ansøgning. Dog forlader fonde nogle gange positioner uden at indsende en afsluttende ansøgning (dvs. de afvikler), så visning af den fulde historie resulterede nogle gange i forvirring om det nuværende ejerskab. For at undgå forvirring viser vi nu kun 'aktuelle' ejere - det vil sige - ejere, der har anmeldt inden for det seneste år.
Upgrade to unlock premium data.
| Fil dato | Form | Investor | Forrige Aktier |
Seneste Aktier |
Δ Aktier (Procent) |
Ejendomsret (Procent) |
Δ Ejerskab (Procent) |
|
|---|---|---|---|---|---|---|---|---|
| 2026-02-17 | ARISTEIA CAPITAL LLC | 6,112,368 | 4,081,641 | -33.22 | 4.78 | -33.33 | ||
| 2026-02-03 | CANADA PENSION PLAN INVESTMENT BOARD | 9,524,201 | 0 | -100.00 | 0.00 | -100.00 | ||
| 2026-01-30 | VANGUARD GROUP INC | 10,498,008 | 8,429,741 | -19.70 | 9.88 | -12.41 | ||
| 2025-11-10 | Kimmeridge Energy Management Company, LLC | 8,404,518 | 5,011,771 | -40.37 | 5.90 | -35.16 | ||
| 2025-05-12 | FMR LLC | 6,165,724 | 4,403,745 | -28.58 | 4.70 | -25.03 |
13F og NPORT arkivering
Detaljer om 13F-arkivering er gratis. Detaljer om NP-ansøgninger kræver et premium-medlemskab. Grønne rækker angiver nye positioner. Røde rækker angiver lukkede positioner. Klik på linket ikon for at se den fulde transaktionshistorik.
Opgrader
for at låse premium-data op og eksportere til Excel ![]() .
.
| Fil dato | Kilde | Investor | Type | Gennemsnitlig pris (Øst) |
Aktier | Δ Aktier (%) |
Rapporteret Værdi ($1000) |
Δ Værdi (%) |
Port Alloc (%) |
|
|---|---|---|---|---|---|---|---|---|---|---|
| 2026-02-12 | 13F | Hohimer Wealth Management, Llc | 0 | -100,00 | 0 | |||||
| 2026-02-12 | 13F | Voya Investment Management Llc | 0 | -100,00 | 0 | |||||
| 2026-02-03 | 13F | Everence Capital Management Inc | 0 | -100,00 | 0 | |||||
| 2026-01-29 | 13F | IMC-Chicago, LLC | 34.565 | -14,47 | 936 | -28,71 | ||||
| 2026-02-13 | 13F | Walleye Trading LLC | 15.913 | -79,60 | 431 | -82,99 | ||||
| 2026-04-30 | 13F | Mv Capital Management, Inc. | 0 | -100,00 | 0 | |||||
| 2026-02-04 | 13F | Pacer Advisors, Inc. | 0 | -100,00 | 0 | -100,00 | ||||
| 2026-02-13 | 13F | Walleye Trading LLC | Put | 42.400 | -21,63 | 1.149 | -34,70 | |||
| 2026-02-12 | 13F | Brown Brothers Harriman & Co | 7.119 | -4,24 | 193 | -20,33 | ||||
| 2026-02-13 | 13F | Walleye Trading LLC | Call | 23.300 | 71,32 | 631 | 42,76 | |||
| 2026-02-11 | 13F | Donald Smith & Co., Inc. | 4.485.476 | 121.512 | ||||||
| 2026-02-13 | 13F | Squarepoint Ops LLC | Call | 0 | -100,00 | 0 | -100,00 | |||
| 2026-02-17 | 13F | Graham Capital Management, L.P. | 60.722 | 81,95 | 1.645 | 51,66 | ||||
| 2026-02-05 | 13F | Bessemer Group Inc | 477 | -95,61 | 0 | |||||
| 2026-02-17 | 13F | Adage Capital Partners Gp, L.l.c. | 1.200.000 | 155,32 | 32.508 | 112,82 | ||||
| 2026-04-13 | 13F | Massmutual Trust Co Fsb/adv | 0 | -100,00 | 0 | |||||
| 2025-11-14 | 13F | Weiss Asset Management LP | 12.542 | 408 | ||||||
| 2026-04-13 | 13F | Wedge Capital Management L L P/nc | 0 | -100,00 | 0 | |||||
| 2025-11-12 | 13F | Montag A & Associates Inc | 0 | -100,00 | 0 | |||||
| 2026-02-13 | 13F | Landscape Capital Management, L.l.c. | 0 | -100,00 | 0 | |||||
| 2026-02-17 | 13F | Bayesian Capital Management, LP | 0 | -100,00 | 0 | |||||
| 2026-02-17 | 13F | Readystate Asset Management Lp | 0 | -100,00 | 0 | |||||
| 2026-02-13 | 13F | Sei Investments Co | 74.931 | 164,40 | 2.030 | 120,30 | ||||
| 2026-01-27 | 13F | Zurcher Kantonalbank (Zurich Cantonalbank) | 22.193 | 1,20 | 601 | -15,59 | ||||
| 2026-02-11 | 13F | Deutsche Bank Ag\ | 8.316 | -19,74 | 225 | -33,04 | ||||
| 2026-02-17 | 13F | Captrust Financial Advisors | 9.455 | -14,84 | 256 | -28,89 | ||||
| 2025-10-30 | 13F | Twin Peaks Wealth Advisors, LLC | 0 | -100,00 | 0 | |||||
| 2025-11-13 | 13F | Acadian Asset Management Llc | 0 | -100,00 | 0 | |||||
| 2026-03-09 | 13F | EMC Capital Management | 3.017 | -14,99 | 0 | |||||
| 2026-02-04 | 13F | Atlantic Union Bankshares Corp | 657 | 18,38 | 18 | -5,56 | ||||
| 2026-04-22 | 13F | Janney Montgomery Scott LLC | 0 | -100,00 | 0 | |||||
| 2026-02-09 | 13F | Legal & General Group Plc | 108.398 | -6,34 | 2.937 | -21,94 | ||||
| 2026-02-17 | 13F | Redwood Investment Management, Llc | 89.387 | 2 | ||||||
| 2026-02-18 | 13F | GWM Advisors LLC | 118 | 9,26 | 3 | 0,00 | ||||
| 2026-01-30 | 13F | Samalin Investment Counsel, LLC | 0 | -100,00 | 0 | |||||
| 2025-11-13 | 13F | Capital Fund Management S.a. | 0 | -100,00 | 0 | -100,00 | ||||
| 2026-02-06 | 13F | Larson Financial Group LLC | 92 | -62,14 | 2 | -71,43 | ||||
| 2026-02-13 | 13F | Ubs Asset Management Americas Inc | 149.061 | -1,41 | 4.038 | -17,81 | ||||
| 2026-02-13 | 13F | Cornerstone Financial Management LLC | 62 | 2 | ||||||
| 2026-02-05 | 13F | Northwestern Mutual Investment Management Company, Llc | 17.177 | -7,59 | 465 | -23,01 | ||||
| 2026-01-26 | 13F | Mirae Asset Global Investments Co., Ltd. | 1.994 | -7,13 | 54 | -21,74 | ||||
| 2026-04-23 | 13F | Private Wealth Management Group, LLC | 0 | -100,00 | 0 | |||||
| 2026-02-17 | 13F | Jump Financial, LLC | 31.126 | 843 | ||||||
| 2026-02-13 | 13F | Dockside LLC | 42.816 | 1.160 | ||||||
| 2026-02-18 | 13F | Vident Advisory, LLC | 38.888 | 17,08 | 1.053 | -2,41 | ||||
| 2026-02-12 | 13F | MetLife Investment Management, LLC | 37.766 | -12,19 | 1.023 | -26,77 | ||||
| 2026-02-17 | 13F | Woodline Partners LP | 0 | -100,00 | 0 | |||||
| 2025-11-14 | 13F | Wolverine Trading, Llc | 22.759 | -55,88 | 726 | -49,79 | ||||
| 2026-02-17 | 13F | Bank Of America Corp /de/ | 138.639 | -82,08 | 3.756 | -85,07 | ||||
| 2025-11-14 | 13F | Wolverine Trading, Llc | Call | 100.700 | 79,18 | 3.211 | 104,13 | |||
| 2025-11-14 | 13F | Wolverine Trading, Llc | Put | 59.700 | 17,98 | 1.904 | 34,39 | |||
| 2026-02-12 | 13F | Distillate Capital Partners LLC | 9 | 800,00 | 0 | |||||
| 2025-11-13 | 13F | Twin Tree Management, LP | Call | 0 | -100,00 | 0 | -100,00 | |||
| 2026-02-11 | 13F | Parallel Advisors, LLC | 4.168 | -7,97 | 113 | -23,81 | ||||
| 2026-02-05 | 13F | Cambridge Investment Research Advisors, Inc. | 0 | -100,00 | 0 | |||||
| 2026-01-15 | 13F | Clg Llc | 355.261 | -2,67 | 9.624 | -18,87 | ||||
| 2026-02-13 | 13F | Transamerica Financial Advisors, Inc. | 20 | 1 | ||||||
| 2026-02-13 | 13F | Mariner, LLC | 30.088 | 23,67 | 815 | 3,16 | ||||
| 2026-04-24 | 13F | Kendall Capital Management | 0 | -100,00 | 0 | |||||
| 2026-04-30 | 13F | Sequoia Financial Advisors, LLC | 0 | -100,00 | 0 | |||||
| 2026-02-17 | 13F | D. E. Shaw & Co., Inc. | 0 | -100,00 | 0 | -100,00 | ||||
| 2026-02-11 | 13F | Franklin Resources Inc | 228.744 | 101,83 | 6.197 | 68,23 | ||||
| 2026-02-09 | 13F | Huntington National Bank | 482 | -1,43 | 13 | -13,33 | ||||
| 2026-02-06 | 13F | HighTower Advisors, LLC | 36.439 | 394,62 | 987 | 312,97 | ||||
| 2026-02-03 | 13F | Ethic Inc. | 0 | -100,00 | 0 | -100,00 | ||||
| 2026-02-17 | 13F | Virtus Investment Advisers, Inc. | 0 | -100,00 | 0 | |||||
| 2026-02-09 | 13F | Keating Financial Advisory Services, Inc. | 45 | 1 | ||||||
| 2026-02-04 | 13F | Virginia Retirement Systems Et Al | 10.800 | 0,93 | 293 | -15,85 | ||||
| 2026-02-17 | 13F | Raymond James Financial Inc | 21.784 | -0,51 | 590 | -17,02 | ||||
| 2026-02-05 | 13F | Sequent Planning LLC | 0 | -100,00 | 0 | |||||
| 2026-02-13 | 13F | Cozad Asset Management Inc | 56.213 | 1,48 | 1.523 | -15,44 | ||||
| 2025-11-14 | 13F | Maverick Capital Ltd | 0 | -100,00 | 0 | |||||
| 2026-02-17 | 13F | California State Teachers Retirement System | 71.960 | -3,44 | 1.949 | -19,53 | ||||
| 2026-02-02 | 13F | Fifth Third Bancorp | 1.612 | -4,33 | 44 | -20,37 | ||||
| 2026-02-05 | 13F | Td Private Client Wealth Llc | 0 | -100,00 | 0 | |||||
| 2026-02-13 | 13F | OMERS ADMINISTRATION Corp | 0 | -100,00 | 0 | -100,00 | ||||
| 2026-02-20 | 13F | Ruggaard & Associates LLC | 0 | -100,00 | 0 | |||||
| 2026-01-29 | 13F | Concurrent Investment Advisors, LLC | 20.745 | -9,44 | 562 | -24,60 | ||||
| 2026-02-13 | 13F | Pinnacle Wealth Planning Services, Inc. | 791 | 21 | ||||||
| 2026-04-24 | 13F | Retirement Systems of Alabama | 0 | -100,00 | 0 | |||||
| 2026-02-06 | 13F | EverSource Wealth Advisors, LLC | 2.203 | 19,73 | 60 | 0,00 | ||||
| 2026-02-09 | 13F | Quest Partners LLC | 29.108 | -3,07 | 789 | -19,18 | ||||
| 2026-02-17 | 13F | Boothbay Fund Management, Llc | 0 | -100,00 | 0 | |||||
| 2026-02-09 | 13F | Atlantic Trust, LLC | 0 | -100,00 | 0 | |||||
| 2026-02-17 | 13F | Susquehanna Portfolio Strategies, LLC | 167.048 | -9,21 | 4.525 | -24,33 | ||||
| 2025-11-07 | 13F | Synovus Financial Corp | 0 | -100,00 | 0 | |||||
| 2026-04-23 | 13F | Impact Partnership Wealth, LLC | 0 | -100,00 | 0 | |||||
| 2026-04-28 | 13F | SBI Securities Co., Ltd. | 0 | -100,00 | 0 | |||||
| 2025-11-06 | 13F | Versor Investments LP | 0 | -100,00 | 0 | |||||
| 2026-04-07 | 13F | Signaturefd, Llc | 0 | -100,00 | 0 | |||||
| 2026-04-28 | 13F | Whittier Trust Co Of Nevada Inc | 0 | -100,00 | 0 | |||||
| 2026-04-29 | 13F | Childress Capital Advisors, Llc | 0 | -100,00 | 0 | |||||
| 2026-02-12 | 13F | Johnson Financial Group, Inc. | 33 | 0,00 | 1 | -100,00 | ||||
| 2026-02-13 | 13F | Wells Fargo & Company/mn | 16.798 | -10,10 | 455 | -25,04 | ||||
| 2026-04-08 | 13F | Wealth Enhancement Advisory Services, Llc | 0 | -100,00 | 0 | |||||
| 2026-02-13 | 13F | Walleye Capital LLC | 13.433 | 364 | ||||||
| 2026-02-13 | 13F | Walleye Capital LLC | Call | 23.700 | -40,75 | 642 | -50,62 | |||
| 2026-02-13 | 13F | Rhumbline Advisers | 212.815 | -9,12 | 5.765 | -24,24 | ||||
| 2026-02-17 | 13F | Whitebox Advisors Llc | 427.887 | 6,97 | 11.591 | -10,84 | ||||
| 2026-02-11 | 13F | Empowered Funds, LLC | 85.483 | 31,09 | 2.316 | 9,25 | ||||
| 2026-02-11 | 13F | Jpmorgan Chase & Co | 223.550 | 8,63 | 6.056 | -9,46 | ||||
| 2026-02-12 | 13F | Advisors Asset Management, Inc. | 52.179 | -40,02 | 1.414 | -50,02 | ||||
| 2026-01-14 | 13F | Klein Pavlis & Peasley Financial, Inc. | 0 | -100,00 | 0 | |||||
| 2026-02-09 | 13F | Kingsview Wealth Management, LLC | 0 | -100,00 | 0 | |||||
| 2025-11-13 | 13F | Renaissance Technologies Llc | 0 | -100,00 | 0 | |||||
| 2026-02-13 | 13F | Walleye Capital LLC | Put | 33.800 | -68,23 | 916 | -73,54 | |||
| 2026-02-18 | 13F | Mackenzie Financial Corp | 8.999 | 245 | ||||||
| 2026-02-18 | 13F | EP Wealth Advisors, Inc. | 9.672 | 4,69 | 262 | 3,15 | ||||
| 2026-02-13 | 13F | Arrowstreet Capital, Limited Partnership | 24.166 | 0,00 | 655 | -16,69 | ||||
| 2026-02-13 | 13F | MAI Capital Management | 1.171 | 614,02 | 32 | 520,00 | ||||
| 2026-02-17 | 13F | Sagewood Asset Management LP | 23.338 | 632 | ||||||
| 2026-02-06 | 13F | Covestor Ltd | 356 | -0,28 | 0 | |||||
| 2026-04-24 | 13F | Redwood Wealth Management Group, LLC | 0 | -100,00 | 0 | |||||
| 2026-02-17 | 13F | DV Trading LLC | 700 | 19 | ||||||
| 2025-11-14 | 13F | Federation des caisses Desjardins du Quebec | 0 | -100,00 | 0 | |||||
| 2026-02-17 | 13F | Parallax Volatility Advisers, L.P. | 0 | -100,00 | 0 | |||||
| 2025-10-30 | 13F | CNB Bank | 0 | -100,00 | 0 | |||||
| 2026-04-29 | 13F | Klp Kapitalforvaltning As | 0 | -100,00 | 0 | |||||
| 2026-02-17 | 13F | Punch & Associates Investment Management, Inc. | 0 | -100,00 | 0 | -100,00 | ||||
| 2026-02-12 | 13F | Bank Of Montreal /can/ | 13.099 | -7,53 | 355 | -23,04 | ||||
| 2026-02-09 | 13F | Knights of Columbus Asset Advisors LLC | 0 | -100,00 | 0 | |||||
| 2026-02-17 | 13F | Price T Rowe Associates Inc /md/ | 73.594 | 4,75 | 2 | -50,00 | ||||
| 2026-04-21 | 13F | Financial Consulate, Inc | 0 | -100,00 | 0 | |||||
| 2026-04-30 | 13F | Kestra Advisory Services, LLC | 0 | -100,00 | 0 | |||||
| 2026-01-14 | 13F | Hennion & Walsh Asset Management, Inc. | 8.920 | -52,96 | 242 | -60,88 | ||||
| 2026-02-17 | 13F | Citadel Advisors Llc | Put | 110.400 | -59,16 | 2.991 | -65,96 | |||
| 2026-02-17 | 13F | Citadel Advisors Llc | Call | 73.700 | -58,78 | 1.997 | -65,65 | |||
| 2026-02-06 | 13F | Global Retirement Partners, LLC | 823 | 4.472,22 | 22 | |||||
| 2026-02-13 | 13F | Neuberger Berman Group LLC | 16.384 | 93,92 | 444 | 61,68 | ||||
| 2026-01-07 | 13F | Retirement Wealth Solutions LLC | 0 | -100,00 | 0 | |||||
| 2026-02-17 | 13F | Citadel Advisors Llc | 378.046 | 18,12 | 10.241 | -1,54 | ||||
| 2026-01-23 | 13F | Avion Wealth | 257 | 140,19 | 0 | |||||
| 2026-01-29 | 13F | UBS Group AG | 956.048 | -19,50 | 25.899 | -32,90 | ||||
| 2025-11-14 | 13F | Texas Permanent School Fund | 0 | -100,00 | 0 | |||||
| 2026-01-29 | 13F | Marathon Capital Management | 0 | -100,00 | 0 | |||||
| 2026-04-16 | 13F | Trium Capital LLP | 0 | -100,00 | 0 | |||||
| 2026-04-24 | 13F | Root Financial Partners, LLC | 0 | -100,00 | 0 | |||||
| 2026-02-13 | 13F | Caxton Associates Llp | 50.342 | -22,71 | 1.364 | -35,59 | ||||
| 2025-11-13 | 13F | University Of Texas/texas Am Investment Managment Co | 0 | -100,00 | 0 | |||||
| 2026-02-17 | 13F | Algert Global Llc | 376.316 | 10 | ||||||
| 2026-02-17 | 13F | FIL Ltd | 36.065 | 977 | ||||||
| 2026-04-02 | 13F | Marex Group plc | 0 | -100,00 | 0 | -100,00 | ||||
| 2026-02-12 | 13F | Hrt Financial Lp | 125.752 | 3 | ||||||
| 2026-02-17 | 13F | Dark Forest Capital Management Lp | 0 | -100,00 | 0 | |||||
| 2026-02-10 | 13F | New Mexico Educational Retirement Board | 17.400 | 0,00 | 0 | |||||
| 2026-02-13 | 13F | Cloverfields Capital Group, Lp | 0 | -100,00 | 0 | |||||
| 2026-02-17 | 13F | State Of Wisconsin Investment Board | 0 | -100,00 | 0 | |||||
| 2026-02-13 | 13F | Kennedy Capital Management, Inc. | 0 | -100,00 | 0 | |||||
| 2026-02-10 | 13F | Bnp Paribas Arbitrage, Sa | 10.903 | -93,02 | 295 | -94,19 | ||||
| 2026-04-23 | 13F | American National Bank | 0 | -100,00 | 0 | |||||
| 2026-02-13 | 13F | Brookfield Asset Management Inc. | 22.080 | 0,00 | 598 | -16,60 | ||||
| 2025-11-14 | 13F | Jain Global LLC | 0 | -100,00 | 0 | |||||
| 2026-02-13 | 13F | Segall Bryant & Hamill, Llc | 60.887 | -0,35 | 1.649 | -16,93 | ||||
| 2026-04-17 | 13F | Leeward Investments, LLC - MA | 0 | -100,00 | 0 | |||||
| 2026-02-13 | 13F | Pathstone Holdings, LLC | 26.599 | -31,61 | 721 | -43,04 | ||||
| 2026-02-12 | 13F | Collier Financial | 9 | 0,00 | 0 | |||||
| 2026-01-29 | 13F | Vanguard Group Inc | 8.429.741 | -11,86 | 228.362 | -26,53 | ||||
| 2026-02-13 | 13F | Gts Securities Llc | 0 | -100,00 | 0 | |||||
| 2025-11-12 | 13F | Edgestream Partners, L.P. | 0 | -100,00 | 0 | |||||
| 2026-01-27 | 13F | WealthCollab, LLC | 0 | -100,00 | 0 | |||||
| 2026-04-30 | 13F | Torren Management, LLC | 0 | -100,00 | 0 | |||||
| 2026-04-20 | 13F | Ronald Blue Trust, Inc. | 0 | -100,00 | 0 | |||||
| 2026-02-10 | 13F | Godfrey Financial Associates, Inc. | 9 | 0 | ||||||
| 2026-04-28 | 13F | Stratos Wealth Partners, LTD. | 0 | -100,00 | 0 | |||||
| 2026-02-17 | 13F | Janus Henderson Group Plc | 35.644 | 0,00 | 965 | -16,74 | ||||
| 2026-02-17 | 13F | Mangrove Partners | 8.460 | 229 | ||||||
| 2026-02-02 | 13F | Oppenheimer & Co Inc | 0 | -100,00 | 0 | |||||
| 2026-02-17 | 13F | Alliancebernstein L.p. | 156.156 | -7,04 | 4.230 | -22,51 | ||||
| 2026-01-20 | 13F | Harbor Capital Advisors, Inc. | 0 | -100,00 | 0 | |||||
| 2026-04-30 | 13F | Nisa Investment Advisors, Llc | 0 | -100,00 | 0 | |||||
| 2026-04-13 | 13F | True Wealth Design, LLC | 0 | -100,00 | 0 | |||||
| 2026-02-11 | 13F | Ameritas Investment Partners, Inc. | 14.070 | 381 | ||||||
| 2026-02-12 | 13F | Jane Street Group, Llc | Call | 15.600 | -70,84 | 423 | -75,72 | |||
| 2026-02-12 | 13F | Jane Street Group, Llc | 554.320 | 45,13 | 15.017 | 20,98 | ||||
| 2026-02-12 | 13F | Jane Street Group, Llc | Put | 20.600 | -94,77 | 558 | -95,64 | |||
| 2026-02-17 | 13F | Scientech Research LLC | 0 | -100,00 | 0 | |||||
| 2026-04-28 | 13F | Alberta Investment Management Corp | 0 | -100,00 | 0 | |||||
| 2026-02-17 | 13F | Summit Trail Advisors, Llc | 17.406 | 15,47 | 472 | -3,68 | ||||
| 2026-02-17 | 13F | Sagefield Capital LP | 244.873 | 3,51 | 6.634 | -13,72 | ||||
| 2026-02-12 | 13F | DRW Securities, LLC | Call | 0 | -100,00 | 0 | -100,00 | |||
| 2026-02-17 | 13F | Tower Research Capital LLC (TRC) | 4.677 | 82,98 | 127 | 51,81 | ||||
| 2026-02-13 | 13F | Ieq Capital, Llc | 24.174 | -57,82 | 655 | -64,88 | ||||
| 2026-02-17 | 13F | Cresset Asset Management, LLC | 20.003 | 0,78 | 542 | -16,12 | ||||
| 2026-02-17 | 13F | Css Llc/il | Call | 0 | -100,00 | 0 | ||||
| 2026-02-06 | 13F | Bare Financial Services, Inc | 51 | 264,29 | 1 | |||||
| 2026-02-17 | 13F | XTX Topco Ltd | 15.809 | 74,34 | 428 | 45,58 | ||||
| 2026-02-11 | 13F | Los Angeles Capital Management Llc | 388 | 11 | ||||||
| 2025-11-13 | 13F | Capital World Investors | 0 | -100,00 | 0 | -100,00 | ||||
| 2026-02-13 | 13F | Morgan Stanley | 1.054.859 | -32,55 | 28.576 | -43,78 | ||||
| 2026-02-13 | 13F | Wbi Investments, Inc. | 55.323 | 1.499 | ||||||
| 2026-02-12 | 13F | Triumph Capital Management | 325 | 62,50 | 9 | 33,33 | ||||
| 2026-02-12 | 13F | Principal Securities, Inc. | 0 | -100,00 | 0 | |||||
| 2026-04-29 | 13F | Oregon Public Employees Retirement Fund | 0 | -100,00 | 0 | |||||
| 2026-01-30 | 13F | Keybank National Association/oh | 0 | -100,00 | 0 | -100,00 | ||||
| 2026-02-12 | 13F | DRW Securities, LLC | 7.681 | 208 | ||||||
| 2026-02-17 | 13F | Polymer Capital Management (US) LLC | 10.475 | 284 | ||||||
| 2026-03-16 | 13F/A | Rockefeller Capital Management L.P. | 235 | 0,00 | 6 | -14,29 | ||||
| 2026-02-17 | 13F | Sender Co & Partners, Inc. | 0 | -100,00 | 0 | |||||
| 2026-04-27 | 13F | Y-Intercept (Hong Kong) Ltd | 0 | -100,00 | 0 | |||||
| 2026-04-30 | 13F | LRI Investments, LLC | 0 | -100,00 | 0 | |||||
| 2026-04-30 | 13F | Cromwell Holdings LLC | 0 | -100,00 | 0 | |||||
| 2026-02-13 | 13F | Cullen Capital Management, LLC | 7.956 | -7,48 | 216 | -22,94 | ||||
| 2026-02-17 | 13F | Qube Research & Technologies Ltd | 703.044 | 19.045 | ||||||
| 2026-02-13 | 13F | Stifel Financial Corp | 0 | -100,00 | 0 | |||||
| 2026-01-29 | 13F | Dunhill Financial, LLC | 2 | 0 | ||||||
| 2026-02-17 | 13F | Css Llc/il | 0 | -100,00 | 0 | |||||
| 2026-04-20 | 13F | Louisiana State Employees Retirement System | 0 | -100,00 | 0 | |||||
| 2026-01-30 | 13F | Mitsubishi UFJ Trust & Banking Corp | 244.742 | 9,34 | 6.630 | -8,85 | ||||
| 2026-02-10 | 13F | Commonwealth Of Pennsylvania Public School Empls Retrmt Sys | 19.212 | -10,24 | 520 | -25,18 | ||||
| 2026-02-12 | 13F | Xponance, Inc. | 7.786 | -19,42 | 211 | -33,12 | ||||
| 2026-02-10 | 13F | State of Wyoming | 0 | -100,00 | 0 | |||||
| 2026-02-12 | 13F | Dimensional Fund Advisors Lp | 3.396.324 | 3,72 | 92.008 | -13,54 | ||||
| 2026-02-17 | 13F | Quantinno Capital Management LP | 85.895 | 22,79 | 2.327 | 2,33 | ||||
| 2026-02-12 | 13F | Swiss National Bank | 146.230 | -4,13 | 3.961 | -20,09 | ||||
| 2026-02-02 | 13F | Horizon Investments, LLC | 0 | -100,00 | 0 | |||||
| 2026-02-11 | 13F | Prestige Wealth Management Group LLC | 130 | 85,71 | 4 | 50,00 | ||||
| 2026-01-28 | 13F | CAPROCK Group, Inc. | 27.082 | 48,25 | 734 | 9,24 | ||||
| 2026-04-15 | 13F | FNY Investment Advisers, LLC | 0 | -100,00 | 0 | |||||
| 2026-02-12 | 13F | CIBC Private Wealth Group, LLC | 3.650 | -20,44 | 99 | -34,23 | ||||
| 2026-01-26 | 13F | Mountain Hill Investment Partners Corp. | 64 | 3,23 | 2 | -50,00 | ||||
| 2026-02-11 | 13F | Vestcor Inc | 26.394 | 0,00 | 1 | |||||
| 2026-02-13 | 13F | Barclays Plc | 115.326 | -85,32 | 3.124 | -87,76 | ||||
| 2026-02-13 | 13F | Wexford Capital Lp | 3.409 | 92 | ||||||
| 2026-04-29 | 13F | Envestnet Portfolio Solutions, Inc. | 0 | -100,00 | 0 | |||||
| 2026-02-17 | 13F | MIRAE ASSET GLOBAL ETFS HOLDINGS Ltd. | 285.624 | 2,62 | 7.738 | -14,46 | ||||
| 2026-03-04 | 13F | SHP Wealth Management | 26 | 1 | ||||||
| 2026-02-13 | 13F | Bridgewater Associates, LP | 104.553 | 2.832 | ||||||
| 2026-02-13 | 13F | Thomist Capital Management, LP | 0 | -100,00 | 0 | |||||
| 2026-02-12 | 13F | Ci Investments Inc. | 0 | -100,00 | 0 | |||||
| 2025-11-07 | 13F | Ontario Teachers Pension Plan Board | 0 | -100,00 | 0 | -100,00 | ||||
| 2026-02-13 | 13F | Smartleaf Asset Management LLC | 166 | -54,89 | 5 | -63,64 | ||||
| 2026-04-23 | 13F | Farmers & Merchants Investments Inc | 0 | -100,00 | 0 | |||||
| 2026-01-29 | 13F | Teachers Retirement System Of The State Of Kentucky | 27.718 | 0,00 | 1 | |||||
| 2026-04-17 | 13F | Investment Advisory Services Inc /tx /adv | 0 | -100,00 | 0 | |||||
| 2026-02-05 | 13F | Thrivent Financial For Lutherans | 17.288 | -67,98 | 0 | -100,00 | ||||
| 2026-02-06 | 13F | Diamond Hill Capital Management Inc | 653.369 | -43,67 | 17.700 | -53,05 | ||||
| 2026-02-18 | 13F | State of Tennessee, Treasury Department | 0 | -100,00 | 0 | |||||
| 2026-04-06 | 13F | GAMMA Investing LLC | 0 | -100,00 | 0 | |||||
| 2026-02-09 | 13F | Geode Capital Management, Llc | 1.778.718 | -2,11 | 48.197 | -18,41 | ||||
| 2026-02-12 | 13F | Ensign Peak Advisors, Inc | 0 | -100,00 | 0 | |||||
| 2026-02-12 | 13F | BlackRock, Inc. | 7.678.282 | -10,07 | 208.005 | -25,04 | ||||
| 2026-02-13 | 13F | Prudential Financial Inc | 0 | -100,00 | 0 | |||||
| 2026-02-17 | 13F | Balyasny Asset Management Llc | 13.930 | 59,44 | 377 | 33,22 | ||||
| 2026-04-15 | 13F | Valley National Advisers Inc | 0 | -100,00 | 0 | |||||
| 2026-02-10 | 13F | Bank of New York Mellon Corp | 1.354.751 | 48,92 | 36.700 | 24,13 | ||||
| 2026-04-10 | 13F | Smh Capital Advisors Inc | 0 | -100,00 | 0 | |||||
| 2026-02-13 | 13F | Citigroup Inc | 66.992 | -43,65 | 1.815 | -53,05 | ||||
| 2026-02-17 | 13F | Kimmeridge Energy Management Company, LLC | 5.011.771 | -18,81 | 135.769 | -32,32 | ||||
| 2026-02-13 | 13F | Parkside Financial Bank & Trust | 1.097 | -30,39 | 30 | -43,14 | ||||
| 2026-02-13 | 13F | State Street Corp | 3.830.770 | -8,16 | 103.776 | -23,45 | ||||
| 2026-01-30 | 13F | Glenorchy Capital Ltd | 14.120 | 31,35 | 383 | 9,46 | ||||
| 2026-04-24 | 13F | Stock Yards Bank & Trust Co | 0 | -100,00 | 0 | |||||
| 2026-04-29 | 13F | Police & Firemen's Retirement System of New Jersey | 0 | -100,00 | 0 | |||||
| 2026-04-29 | 13F | Skopos Labs, Inc. | 0 | -100,00 | 0 | |||||
| 2026-02-02 | 13F | Sachetta, LLC | 319 | 0,00 | 9 | -20,00 | ||||
| 2026-04-15 | 13F | Merit Financial Group, LLC | 0 | -100,00 | 0 | |||||
| 2026-04-27 | 13F | New York State Teachers Retirement System | 0 | -100,00 | 0 | |||||
| 2026-02-17 | 13F | Schonfeld Strategic Advisors LLC | 0 | -100,00 | 0 | |||||
| 2026-02-13 | 13F | JustInvest LLC | 27.021 | -31,91 | 732 | -43,29 | ||||
| 2026-02-13 | 13F | Goehring & Rozencwajg Associates, LLC | 256.605 | 32,86 | 6.951 | 10,74 | ||||
| 2026-02-17 | 13F | Advisor Group Holdings, Inc. | 28.485 | -20,23 | 772 | -39,34 | ||||
| 2026-02-09 | 13F | Hantz Financial Services, Inc. | 4.632 | 46,35 | 0 | |||||
| 2026-02-12 | 13F | State Board Of Administration Of Florida Retirement System | 41.378 | 0,00 | 1.121 | -16,67 | ||||
| 2026-02-11 | 13F | Group One Trading, L.p. | 25.929 | -69,01 | 702 | -74,18 | ||||
| 2026-04-07 | 13F | Farther Finance Advisors, LLC | 0 | -100,00 | 0 | |||||
| 2026-02-20 | 13F | Kovitz Investment Group Partners, LLC | 0 | -100,00 | 0 | |||||
| 2026-04-15 | 13F | Gf Fund Management Co. Ltd. | 0 | -100,00 | 0 | |||||
| 2026-04-10 | 13F | Daytona Street Capital LLC | 0 | -100,00 | 0 | |||||
| 2026-04-15 | 13F | Activest Wealth Management | 0 | -100,00 | 0 | |||||
| 2026-02-11 | 13F | Meeder Asset Management Inc | 73 | -99,89 | 2 | -99,95 | ||||
| 2026-02-17 | 13F | Advisory Services Network, LLC | 0 | -100,00 | 0 | |||||
| 2026-02-13 | 13F | Squarepoint Ops LLC | Put | 11.500 | -22,30 | 312 | -35,34 | |||
| 2026-02-13 | 13F | Squarepoint Ops LLC | 70.699 | 1.915 | ||||||
| 2026-02-13 | 13F | Barclays Plc | Put | 0 | -100,00 | 0 | -100,00 | |||
| 2026-02-17 | 13F | Mercer Global Advisors Inc /adv | 21.777 | -13,26 | 590 | -27,73 | ||||
| 2026-02-05 | 13F | Elyxium Wealth, LLC | 97 | 3 | ||||||
| 2026-02-13 | 13F | Barclays Plc | Call | 0 | -100,00 | 0 | -100,00 | |||
| 2026-02-05 | 13F | Dana Investment Advisors, Inc. | 29.387 | 72,71 | 796 | 44,20 | ||||
| 2026-04-07 | 13F | Eastern Bank | 0 | -100,00 | 0 | |||||
| 2026-02-17 | 13F | Aqr Capital Management Llc | 1.664.620 | -30,74 | 45.095 | -42,27 | ||||
| 2026-04-28 | 13F | Quent Capital, LLC | 0 | -100,00 | 0 | |||||
| 2026-02-05 | 13F | Amalgamated Bank | 37.185 | -3,46 | 1 | 0,00 | ||||
| 2026-02-12 | 13F | California Public Employees Retirement System | 176.985 | 2,26 | 4.795 | -14,76 | ||||
| 2026-02-17 | 13F | Parallax Volatility Advisers, L.P. | Call | 20.000 | -46,67 | 542 | -55,58 | |||
| 2026-02-13 | 13F | Colony Group, LLC | 127.283 | 69,53 | 3.448 | -3,63 | ||||
| 2026-01-28 | 13F | Arizona State Retirement System | 20.427 | -12,33 | 553 | -26,95 | ||||
| 2026-02-02 | 13F | Principal Financial Group Inc | 165.511 | -10,86 | 4.484 | -25,70 | ||||
| 2026-02-12 | 13F | Chilton Capital Management Llc | 86 | 2 | ||||||
| 2025-11-13 | 13F | Bnp Paribas Arbitrage, Sa | Put | 0 | -100,00 | 0 | -100,00 | |||
| 2026-04-24 | 13F | Yousif Capital Management, Llc | 0 | -100,00 | 0 | |||||
| 2026-02-13 | 13F | Victory Capital Management Inc | 294.620 | -84,12 | 7.981 | -86,76 | ||||
| 2026-02-13 | 13F | Peak6 Llc | Put | 37.900 | 1.027 | |||||
| 2026-02-13 | 13F | Peak6 Llc | 29.774 | 807 | ||||||
| 2025-11-14 | 13F | Freestone Grove Partners LP | 0 | -100,00 | 0 | |||||
| 2026-02-13 | 13F | National Bank Of Canada /fi/ | 131 | -95,83 | 4 | -97,06 | ||||
| 2026-02-17 | 13F | Public Employees Retirement System Of Ohio | 27.771 | -3,65 | 752 | -19,66 | ||||
| 2026-02-12 | 13F/A | Pinebridge Investments Llc | 37.078 | 1.004 | ||||||
| 2025-11-07 | 13F | Shell Asset Management Co | 2.251 | -55,36 | 0 | |||||
| 2026-02-10 | 13F | Bruce G. Allen Investments, LLC | 62 | -24,39 | 2 | -50,00 | ||||
| 2026-04-27 | 13F | Leonteq Securities AG | 0 | -100,00 | 0 | |||||
| 2026-04-29 | 13F | Hughes Financial Services, LLC | 0 | -100,00 | 0 | |||||
| 2026-02-13 | 13F | Caitong International Asset Management Co., Ltd | 454 | -94,17 | 12 | -95,26 | ||||
| 2026-01-15 | 13F | Fortitude Family Office, LLC | 0 | -100,00 | 0 | |||||
| 2026-02-11 | 13F | Rise Advisors, LLC | 0 | -100,00 | 0 | |||||
| 2026-04-30 | 13F | Clear Street Markets Llc | 0 | -100,00 | 0 | |||||
| 2026-04-28 | 13F | Bogart Wealth, LLC | 0 | -100,00 | 0 | |||||
| 2026-02-17 | 13F | Jones Financial Companies Lllp | 2.725 | 4,57 | 74 | -15,12 | ||||
| 2026-01-13 | 13F/A | Sanctuary Advisors, LLC | 20.283 | 4,45 | 659 | 23,41 | ||||
| 2026-01-22 | 13F | Bear Mountain Capital, Inc. | 0 | -100,00 | 0 | |||||
| 2026-02-17 | 13F | Gotham Asset Management, LLC | 1.244.802 | 96,00 | 33.722 | 63,38 | ||||
| 2026-02-09 | 13F | Royce & Associates Lp | 70.455 | -73,72 | 1.909 | -78,10 | ||||
| 2026-04-15 | 13F | Bayforest Capital Ltd | 0 | -100,00 | 0 | -100,00 | ||||
| 2026-01-15 | 13F | Foster & Motley Inc | 0 | -100,00 | 0 | |||||
| 2026-02-17 | 13F | Point72 Asset Management, L.P. | Call | 14.100 | 382 | |||||
| 2026-04-30 | 13F | Valued Wealth Advisors LLC | 0 | -100,00 | 0 | |||||
| 2026-02-17 | 13F | Northern Trust Corp | 787.951 | -29,23 | 21.346 | -41,01 | ||||
| 2026-02-13 | 13F | Diametric Capital, LP | 0 | -100,00 | 0 | |||||
| 2026-02-09 | 13F | Kestra Investment Management, LLC | 15.705 | 1,45 | 425 | -15,51 | ||||
| 2026-04-30 | 13F | Private Trust Co Na | 0 | -100,00 | 0 | |||||
| 2026-02-02 | 13F | Cornerstone Planning Group LLC | 5 | -66,67 | 0 | |||||
| 2026-02-09 | 13F | Hartland & Co., LLC | 306 | -29,98 | 8 | -42,86 | ||||
| 2026-02-10 | 13F | Nomura Asset Management Co Ltd | 1.690 | 0,00 | 46 | -16,67 | ||||
| 2026-04-17 | 13F | Bell Investment Advisors, Inc | 0 | -100,00 | 0 | |||||
| 2026-02-17 | 13F | Corigliano Investment Advisers, LLC | 0 | -100,00 | 0 | |||||
| 2025-11-14 | 13F | PineBridge Investments, L.P. | 37.078 | 0,00 | 1.205 | 18,14 | ||||
| 2026-02-17 | 13F | Aster Capital Management (DIFC) Ltd | 0 | -100,00 | 0 | |||||
| 2026-02-19 | 13F | Invesco Ltd. | 940.736 | 21,59 | 25.485 | 1,35 | ||||
| 2026-02-13 | 13F | Manufacturers Life Insurance Company, The | 0 | -100,00 | 0 | |||||
| 2026-02-12 | 13F | Wedbush Securities Inc | 0 | -100,00 | 0 | |||||
| 2026-02-02 | 13F | Hussman Strategic Advisors, Inc. | 42.000 | 1.138 | ||||||
| 2026-04-21 | 13F | GHP Investment Advisors, Inc. | 0 | -100,00 | 0 | |||||
| 2026-02-17 | 13F | Cetera Investment Advisers | 67.371 | 124,01 | 1.825 | 86,80 | ||||
| 2026-02-13 | 13F | Umb Bank N A/mo | 976 | -3,94 | 26 | -21,21 | ||||
| 2026-02-11 | 13F | Simplex Trading, Llc | 2.578 | -70,32 | 70 | |||||
| 2026-02-17 | 13F | Grantham, Mayo, Van Otterloo & Co. LLC | 504.700 | -18,13 | 13.672 | -31,76 | ||||
| 2025-11-14 | 13F | Holocene Advisors, LP | 0 | -100,00 | 0 | |||||
| 2026-02-13 | 13F | First Trust Advisors Lp | 542.440 | -46,32 | 14.695 | -55,25 | ||||
| 2026-02-12 | 13F | Federated Hermes, Inc. | 14.960 | -59,03 | 405 | -65,85 | ||||
| 2026-02-13 | 13F | American Century Companies Inc | 2.678.398 | 14,90 | 72.558 | -4,23 | ||||
| 2026-02-13 | 13F | Treasurer of the State of North Carolina | 38.663 | -6,80 | 1 | 0,00 | ||||
| 2026-02-04 | 13F | Dogwood Wealth Management LLC | 0 | -100,00 | 0 | |||||
| 2026-02-17 | 13F | Royal Bank Of Canada | 57.509 | -90,12 | 1.557 | -91,77 | ||||
| 2026-01-09 | 13F | SG Americas Securities, LLC | 0 | -100,00 | 0 | |||||
| 2026-02-13 | 13F | S&t Bank/pa | 60.253 | -32,80 | 1.632 | -43,99 | ||||
| 2026-02-10 | 13F | Rothschild Investment Llc | 504 | -61,59 | 14 | -69,05 | ||||
| 2026-02-13 | 13F | Panagora Asset Management Inc | 0 | -100,00 | 0 | |||||
| 2026-02-13 | 13F | Rafferty Asset Management, LLC | 117.134 | -10,29 | 3.173 | -25,22 | ||||
| 2026-04-28 | 13F | Abel Hall, LLC | 0 | -100,00 | 0 | |||||
| 2026-02-13 | 13F | Pingora Partners LLC | 900 | 0,00 | 24 | -17,24 | ||||
| 2026-02-12 | 13F | Wealthspire Advisors, LLC | 0 | -100,00 | 0 | |||||
| 2026-02-17 | 13F | Lighthouse Investment Partners, LLC | 0 | -100,00 | 0 | |||||
| 2026-02-17 | 13F | Susquehanna International Group, Llp | Put | 404.500 | -32,02 | 10.958 | -43,34 | |||
| 2026-02-17 | 13F | Susquehanna International Group, Llp | Call | 555.400 | -23,92 | 15.046 | -36,59 | |||
| 2026-02-09 | 13F | GeoSphere Capital Management | 0 | -100,00 | 0 | |||||
| 2026-02-17 | 13F | Susquehanna International Group, Llp | 814.798 | -14,48 | 22.073 | -28,72 | ||||
| 2026-04-22 | 13F | Sterling Capital Management LLC | 0 | -100,00 | 0 | |||||
| 2026-02-11 | 13F | Cerity Partners LLC | 51.825 | -28,11 | 1.404 | -40,12 | ||||
| 2026-02-19 | 13F | CI Private Wealth, LLC | 22.448 | -65,59 | 608 | -71,32 | ||||
| 2026-04-10 | 13F | Quaker Wealth Management, LLC | 0 | -100,00 | 0 | |||||
| 2026-02-10 | 13F | Tieton Capital Management, LLC | 194.475 | 0,19 | 5 | -16,67 | ||||
| 2026-01-28 | 13F | Legacy Capital Group California, Inc. | 19.658 | 31,84 | 533 | 9,92 | ||||
| 2026-02-17 | 13F | Cnh Partners Llc | 98.317 | 2.663 | ||||||
| 2026-01-26 | 13F | Cwm, Llc | 19.642 | -14,29 | 1 | |||||
| 2026-04-20 | 13F | State of Alaska, Department of Revenue | 0 | -100,00 | 0 | |||||
| 2026-02-13 | 13F | Marshall Wace, Llp | 129.954 | 3.520 | ||||||
| 2025-11-14 | 13F | Man Group plc | 0 | -100,00 | 0 | -100,00 | ||||
| 2026-01-28 | 13F | Salomon & Ludwin, LLC | 34 | -66,00 | 1 | -100,00 | ||||
| 2026-02-17 | 13F | Ancora Advisors, LLC | 922 | 25 | ||||||
| 2026-02-17 | 13F | Optiver Holding B.V. | 0 | -100,00 | 0 | |||||
| 2026-02-13 | 13F | Natixis | 18.265 | 495 | ||||||
| 2026-01-21 | 13F | Unison Advisors LLC | 0 | -100,00 | 0 | |||||
| 2026-01-30 | 13F | Jackson Hole Capital Partners, LLC | 9.952 | 270 | ||||||
| 2026-02-17 | 13F | Nomura Holdings Inc | 13.800 | -94,04 | 374 | -95,04 | ||||
| 2026-02-10 | 13F | Mutual Of America Capital Management Llc | 31.951 | -17,04 | 866 | -30,86 | ||||
| 2025-11-13 | 13F | Fieldview Capital Management, LLC | 0 | -100,00 | 0 | |||||
| 2026-02-13 | 13F | Toroso Investments, LLC | 28.645 | 182,27 | 776 | 135,56 | ||||
| 2026-04-21 | 13F | Alpine Associates Management Inc. | 0 | -100,00 | 0 | |||||
| 2026-01-20 | 13F | AdvisorNet Financial, Inc | 0 | -100,00 | 0 | |||||
| 2026-02-17 | 13F | Guggenheim Capital Llc | 43.808 | -17,06 | 1.187 | -30,89 | ||||
| 2026-02-17 | 13F | D. E. Shaw & Co., Inc. | Call | 77.600 | -71,77 | 2.102 | -76,47 | |||
| 2026-02-17 | 13F | D. E. Shaw & Co., Inc. | Put | 73.800 | -65,29 | 1.999 | -71,07 | |||
| 2026-02-12 | 13F | South Dakota Investment Council | 75.697 | -19,29 | 2 | -33,33 | ||||
| 2026-02-11 | 13F | Winton Capital Group Ltd | 0 | -100,00 | 0 | |||||
| 2026-04-24 | 13F | UMA Financial Services, Inc. | 0 | -100,00 | 0 | |||||
| 2026-02-10 | 13F/A | Northwestern Mutual Wealth Management Co | 335 | 55,81 | 9 | 50,00 | ||||
| 2026-02-18 | 13F | First Citizens Bank & Trust Co | 29.318 | 93,75 | 794 | 61,71 | ||||
| 2026-04-07 | 13F | CoreCap Advisors, LLC | 0 | -100,00 | 0 | |||||
| 2026-02-17 | 13F | Fmr Llc | 951.114 | 4,20 | 25.766 | -13,15 | ||||
| 2026-04-21 | 13F | Vise Technologies, Inc. | 0 | -100,00 | 0 | |||||
| 2026-02-17 | 13F | Prelude Capital Management, Llc | 0 | -100,00 | 0 | |||||
| 2026-01-29 | 13F | State Of Michigan Retirement System | 18.100 | -9,05 | 490 | -24,15 | ||||
| 2025-11-06 | 13F | Bryce Point Capital, LLC | 15.618 | 508 | ||||||
| 2026-02-17 | 13F | Caption Management, LLC | Call | 0 | -100,00 | 0 | ||||
| 2026-01-23 | 13F | Westside Investment Management, Inc. | 508 | 0,00 | 14 | -22,22 | ||||
| 2026-02-13 | 13F | Sassicaia Capital Advisers Llc | 0 | -100,00 | 0 | |||||
| 2026-01-29 | 13F | Comerica Bank | 46.081 | -19,08 | 1.248 | -32,54 | ||||
| 2026-02-17 | 13F | SummitTX Capital, L.P. | 0 | -100,00 | 0 | |||||
| 2026-02-12 | 13F | CoreCommodity Management, LLC | 111.870 | 17,15 | 3.031 | -2,35 | ||||
| 2026-02-17 | 13F | Ilex Capital Partners (UK) LLP | 0 | -100,00 | 0 | |||||
| 2026-02-17 | 13F | Ameriprise Financial Inc | 121.875 | -29,17 | 3.305 | -40,90 | ||||
| 2026-04-07 | 13F | Abacus Planning Group, Inc. | 0 | -100,00 | 0 | |||||
| 2026-02-09 | 13F | Jefferies Financial Group Inc. | Put | 4.000 | 108 | |||||
| 2026-02-24 | 13F | MidFirst Bank | 79 | 2 | ||||||
| 2026-02-09 | 13F | Jefferies Financial Group Inc. | 5.699 | 154 | ||||||
| 2026-04-30 | 13F | Independence Bank of Kentucky | 0 | -100,00 | 0 | |||||
| 2026-02-11 | 13F | CSM Advisors, LLC | 0 | -100,00 | 0 | |||||
| 2025-11-06 | 13F | Abich Financial Wealth Management LLC | 3.395 | 110 | ||||||
| 2025-11-14 | 13F | WealthTrak Capital Management LLC | 0 | -100,00 | 0 | |||||
| 2026-01-21 | 13F | Future Financial Wealth Managment LLC | 0 | -100,00 | 0 | |||||
| 2026-01-26 | 13F | KBC Group NV | 2.325 | 0,00 | 0 | |||||
| 2026-02-17 | 13F | Aristeia Capital Llc | 4.081.641 | -33,22 | 110.572 | -44,34 | ||||
| 2026-02-04 | 13F | Ameritas Advisory Services, LLC | 0 | -100,00 | 0 | |||||
| 2026-02-06 | 13F | Pnc Financial Services Group, Inc. | 4.724 | -35,09 | 128 | -46,19 | ||||
| 2025-11-14 | 13F | Condire Management, LP | 0 | -100,00 | 0 | |||||
| 2026-02-13 | 13F | Public Employees Retirement Association Of Colorado | 7.808 | 0,00 | 0 | |||||
| 2026-02-17 | 13F | Worldquant Millennium Advisors Llc | 0 | -100,00 | 0 | |||||
| 2026-02-17 | 13F | Aventail Capital Group, LP | 0 | -100,00 | 0 | |||||
| 2026-04-28 | 13F | Whittier Trust Co | 0 | -100,00 | 0 | |||||
| 2026-04-28 | 13F | GM Advisory Group, Inc. | 0 | -100,00 | 0 | |||||
| 2026-02-17 | 13F | Canada Pension Plan Investment Board | 9.524.201 | 0,00 | 258.011 | -16,65 | ||||
| 2026-01-30 | 13F/A | M&t Bank Corp | 22.760 | -27,56 | 616 | -39,67 | ||||
| 2026-02-17 | 13F | Creative Planning | 94.732 | 21,40 | 2.566 | 1,18 | ||||
| 2026-04-30 | 13F | Teacher Retirement System Of Texas | 0 | -100,00 | 0 | |||||
| 2026-02-05 | 13F | Allworth Financial LP | 1.940 | 35,47 | 53 | 13,04 | ||||
| 2026-02-03 | 13F | Legacy Wealth Managment, LLC/ID | 1.737 | -13,84 | 47 | -27,69 | ||||
| 2026-01-30 | 13F | Archer Investment Corp | 99 | 0,00 | 3 | -33,33 | ||||
| 2026-02-10 | 13F | Catalyst Capital Advisors LLC | 23.298 | 0,00 | 631 | -16,64 | ||||
| 2026-02-03 | 13F | Crossmark Global Holdings, Inc. | 39.714 | 506,32 | 1.076 | 407,08 | ||||
| 2026-02-02 | 13F | Wolverine Asset Management Llc | Put | 0 | -100,00 | 0 | ||||
| 2026-02-10 | 13F | Principia Wealth Advisory, LLC | 3 | -40,00 | 0 | |||||
| 2026-04-23 | 13F | SJS Investment Consulting Inc. | 0 | -100,00 | 0 | |||||
| 2026-02-02 | 13F | Wolverine Asset Management Llc | 0 | -100,00 | 0 | |||||
| 2026-02-11 | 13F | SOUTH STATE Corp | 30 | -61,54 | 1 | -100,00 | ||||
| 2026-02-17 | 13F | Toronto Dominion Bank | 12 | 0 | ||||||
| 2026-02-10 | 13F | Sivia Capital Partners, LLC | 8.143 | 221 | ||||||
| 2025-11-14 | 13F | Sourcerock Group LLC | 0 | -100,00 | 0 | -100,00 | ||||
| 2025-11-04 | 13F | Guerra Advisors Inc | 771 | 25 | ||||||
| 2026-04-13 | 13F | IFP Advisors, Inc | 1.308 | -29,45 | 36 | -30,00 | ||||
| 2026-02-13 | 13F | Charles Schwab Investment Management Inc | 752.051 | -10,96 | 20.373 | -25,78 | ||||
| 2026-01-23 | 13F | Assetmark, Inc | 835 | -25,84 | 23 | -38,89 | ||||
| 2026-02-17 | 13F | Aquatic Capital Management LLC | 0 | -100,00 | 0 | |||||
| 2026-04-30 | 13F | First Horizon Corp | 0 | -100,00 | 0 | |||||
| 2026-02-17 | 13F | Russell Investments Group, Ltd. | 138.766 | 14,73 | 3.760 | -4,30 | ||||
| 2026-02-10 | 13F | Goldman Sachs Group Inc | 267.386 | 114,14 | 7.243 | 78,49 | ||||
| 2026-02-20 | 13F | Sunbelt Securities, Inc. | 45 | 0,00 | 1 | 0,00 | ||||
| 2026-04-03 | 13F | Investors Research Corp | 0 | -100,00 | 0 | |||||
| 2026-04-29 | 13F | WPG Advisers, LLC | 0 | -100,00 | 0 | |||||
| 2026-04-16 | 13F | Capital Advisors, Ltd. LLC | 0 | -100,00 | 0 | |||||
| 2026-04-30 | 13F | Kornitzer Capital Management Inc /ks | 0 | -100,00 | 0 | |||||
| 2026-02-12 | 13F | Steward Partners Investment Advisory, Llc | 88 | -6,38 | 2 | -33,33 | ||||
| 2026-02-12 | 13F | Commonwealth Equity Services, Llc | 0 | -100,00 | 0 | |||||
| 2026-04-30 | 13F | Nuveen, LLC | 0 | -100,00 | 0 | |||||
| 2025-11-10 | 13F | Vestmark Advisory Solutions, Inc. | 0 | -100,00 | 0 | |||||
| 2026-02-13 | 13F | Quarry LP | 403 | 757,45 | 11 | 900,00 | ||||
| 2026-02-17 | 13F | Capital Fund Management S.a. | Put | 0 | -100,00 | 0 | ||||
| 2026-02-17 | 13F | Sig Brokerage, Lp | Put | 0 | -100,00 | 0 | ||||
| 2026-02-17 | 13F | Millennium Management Llc | 3.872.183 | 3,49 | 104.897 | -13,74 | ||||
| 2025-11-14 | 13F | Twinbeech Capital Lp | 0 | -100,00 | 0 | |||||
| 2026-02-18 | 13F | Garton & Associates Financial Advisors LLC | 102 | 3 | ||||||
| 2026-02-11 | 13F | LPL Financial LLC | 41.233 | -15,76 | 1.117 | -29,75 | ||||
| 2026-02-17 | 13F | Capital Fund Management S.a. | Call | 0 | -100,00 | 0 | ||||
| 2026-02-10 | 13F | Private Wealth Asset Management, LLC | 120 | 0,00 | 3 | 0,00 | ||||
| 2025-11-13 | 13F | Intrepid Capital Management Inc | 0 | -100,00 | 0 | |||||
| 2026-02-13 | 13F | Kilter Group LLC | 33 | -29,79 | 1 | -100,00 | ||||
| 2026-01-15 | 13F | Range Financial Group LLC | 0 | -100,00 | 0 | |||||
| 2026-04-20 | 13F | Godsey & Gibb Associates | 0 | -100,00 | 0 | |||||
| 2026-02-06 | 13F | Gsa Capital Partners Llp | 23.738 | -13,70 | 1 | |||||
| 2026-02-11 | 13F | Allianz Asset Management GmbH | 0 | -100,00 | 0 | |||||
| 2026-02-10 | 13F | Intech Investment Management Llc | 81.373 | 2.204 | ||||||
| 2026-02-17 | 13F | Sig Brokerage, Lp | Call | 0 | -100,00 | 0 | ||||
| 2026-02-09 | 13F | New Age Alpha Advisors, LLC | 11.879 | 322 | ||||||
| 2026-02-06 | 13F | Lsv Asset Management | 421.745 | -41,86 | 11 | -52,17 | ||||
| 2026-02-13 | 13F | SRS Capital Advisors, Inc. | 773 | -92,54 | 21 | -94,05 | ||||
| 2026-02-12 | 13F | Quadrant Capital Group Llc | 4.526 | 8,10 | 123 | -10,29 | ||||
| 2026-02-03 | 13F | Mitsubishi UFJ Kokusai Asset Management Co., Ltd. | 68 | 0,00 | 2 | -50,00 | ||||
| 2026-04-22 | 13F | Lawson Kroeker Investment Management Inc/ne | 0 | -100,00 | 0 | |||||
| 2026-02-06 | 13F | Addison Advisors LLC | 226 | 0,00 | 6 | -14,29 | ||||
| 2026-04-22 | 13F | Pinnacle Bancorp, Inc. | 0 | -100,00 | 0 | |||||
| 2026-04-24 | 13F | Strs Ohio | 0 | -100,00 | 0 | |||||
| 2026-02-17 | 13F | Concentric Capital Strategies, LP | 0 | -100,00 | 0 | |||||
| 2026-04-10 | 13F | Oak Thistle LLC | 0 | -100,00 | 0 | |||||
| 2026-04-22 | 13F | Pictet Asset Management Holding SA | 0 | -100,00 | 0 | |||||
| 2026-02-04 | 13F | Securian Asset Management, Inc | 5.595 | -10,41 | 152 | -25,25 | ||||
| 2026-03-06 | 13F | Hsbc Holdings Plc | 28.791 | 19,50 | 779 | 4,56 | ||||
| 2026-02-12 | 13F | Callan Family Office, LLC | 0 | -100,00 | 0 | |||||
| 2026-04-06 | 13F | Versant Capital Management, Inc | 0 | -100,00 | 0 | |||||
| 2026-02-17 | 13F | Lazard Asset Management Llc | 22.815 | -8,57 | 618 | -23,70 | ||||
| 2025-11-13 | 13F | FORA Capital, LLC | 0 | -100,00 | 0 | -100,00 | ||||
| 2026-02-17 | 13F | Engineers Gate Manager LP | 72.531 | 1.965 | ||||||
| 2025-11-14 | 13F | Divisar Capital Management LLC | 0 | -100,00 | 0 | |||||
| 2026-01-28 | 13F | Mowery & Schoenfeld Wealth Management, LLC | 0 | -100,00 | 0 | |||||
| 2026-01-28 | 13F | Universal- Beteiligungs- und Servicegesellschaft mbH | 85.212 | -0,03 | 2.308 | -16,68 | ||||
| 2026-02-17 | 13F | Expect Equity LLC | 55.080 | 0,00 | 1.492 | -16,65 | ||||
| 2026-02-13 | 13F | Verition Fund Management LLC | 42.494 | -9,62 | 1.151 | -24,67 | ||||
| 2026-02-17 | 13F | Tudor Investment Corp Et Al | Call | 21.100 | 572 | |||||
| 2026-02-17 | 13F | Tudor Investment Corp Et Al | 18.306 | 496 | ||||||
| 2026-02-17 | 13F | Tudor Investment Corp Et Al | Put | 21.800 | 591 | |||||
| 2026-02-17 | 13F | Brevan Howard Capital Management LP | 31.914 | 75,83 | 865 | 46,69 | ||||
| 2026-01-30 | 13F | Us Bancorp \de\ | 5.106 | -37,25 | 138 | -47,73 | ||||
| 2025-11-14 | 13F | Virtu Financial LLC | 0 | -100,00 | 0 | |||||
| 2026-01-12 | 13F | Rialto Wealth Management, LLC | 0 | -100,00 | 0 |