Grundlæggende statistik
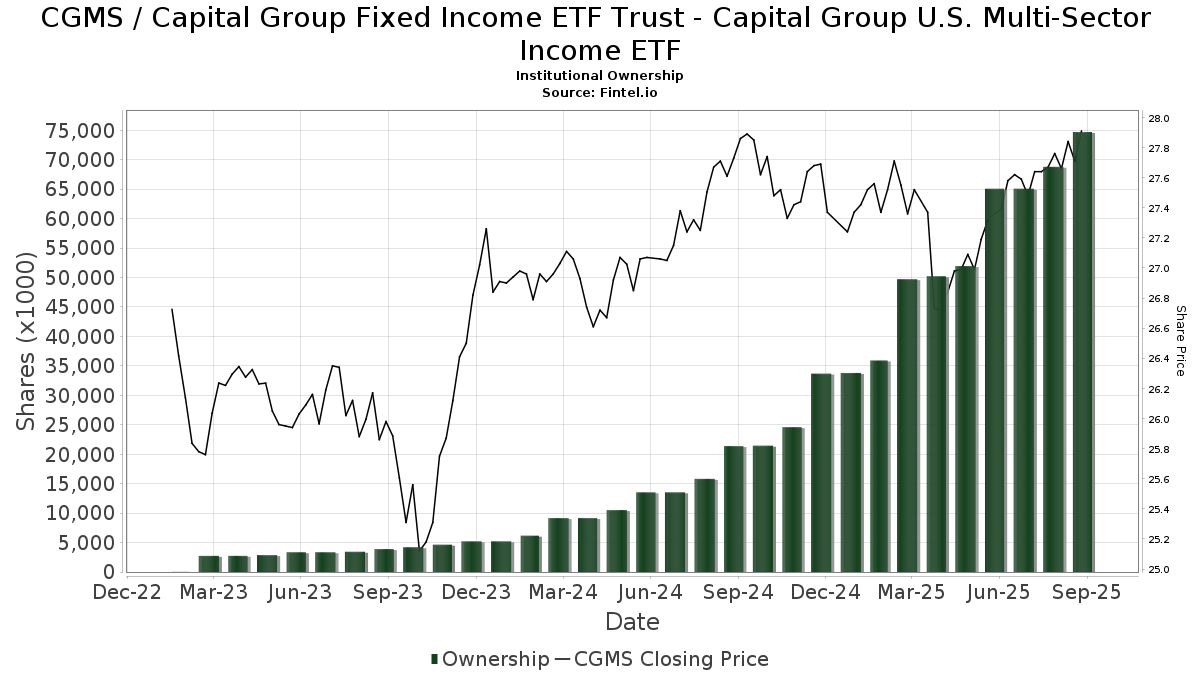
| Institutionelle ejere | 255 total, 255 long only, 0 short only, 0 long/short - change of 6,69% MRQ |
| Gennemsnitlig porteføljeallokering | 0.4635 % - change of -6,83% MRQ |
| Institutionelle aktier (lange) | 74.715.451 (ex 13D/G) - change of 9,63MM shares 14,80% MRQ |
| Institutionel værdi (lang) | $ 1.885.679 USD ($1000) |
Institutionelt ejerskab og aktionærer
Capital Group Fixed Income ETF Trust - Capital Group U.S. Multi-Sector Income ETF (US:CGMS) har 255 institutionelle ejere og aktionærer, der har indsendt 13D/G- eller 13F-formularer til Securities Exchange Commission (SEC). Disse institutioner har i alt 74,715,451 aktier. Største aktionærer omfatter LPL Financial LLC, Morgan Stanley, Envestnet Asset Management Inc, Raymond James Financial Inc, Wells Fargo & Company/mn, Cetera Investment Advisers, Commonwealth Equity Services, Llc, UBS Group AG, Great Valley Advisor Group, Inc., and Capital Advantage, Inc. .
Capital Group Fixed Income ETF Trust - Capital Group U.S. Multi-Sector Income ETF (ARCA:CGMS) institutionel ejerskabsstruktur viser aktuelle positioner i virksomheden efter institutioner og fonde, samt seneste ændringer i positionsstørrelse. Større aktionærer kan omfatte individuelle investorer, investeringsforeninger, hedgefonde eller institutioner. Skema 13D angiver, at investoren besidder (eller besidder) mere end 5 % af virksomheden og har til hensigt (eller har til hensigt at) aktivt at forfølge en ændring i forretningsstrategi. Skema 13G indikerer en passiv investering på over 5%.
The share price as of September 12, 2025 is 27,91 / share. Previously, on September 16, 2024, the share price was 27,90 / share. This represents an increase of 0,04% over that period.
Fondens stemningsscore
Fund Sentiment Score (fka Ownership Accumulation Score) finder de aktier, der bliver mest købt af fonde. Det er resultatet af en sofistikeret, multi-faktor kvantitativ model, der identificerer virksomheder med de højeste niveauer af institutionel akkumulering. Scoringsmodellen bruger en kombination af den samlede stigning i oplyste ejere, ændringerne i porteføljeallokeringer i disse ejere og andre målinger. Tallet går fra 0 til 100, hvor højere tal indikerer et højere niveau af akkumulering for sine jævnaldrende, og 50 er gennemsnittet.
Opdateringsfrekvens: Dagligt
Se Ownership Explorer, som giver en liste over højest rangerende virksomheder.
Institutionel Put/Call-forhold
Ud over at indberette standardaktie- og gældsudstedelser skal institutter med mere end 100 mill. aktiver under forvaltning også oplyse deres put- og call-optionsbeholdninger. Da salgsoptioner generelt indikerer negativ stemning, og købsoptioner indikerer positiv stemning, kan vi få en fornemmelse af den overordnede institutionelle stemning ved at plotte forholdet mellem put og kald. Diagrammet til højre viser det historiske put/call-forhold for dette instrument.
Brug af Put/Call Ratio som en indikator for investorernes stemning overvinder en af de vigtigste mangler ved at bruge totalt institutionelt ejerskab, som er, at en betydelig mængde af aktiver under forvaltning investeres passivt for at spore indekser. Passivt forvaltede fonde køber typisk ikke optioner, så indikatoren for put/call-forholdet følger mere nøje følelsen af aktivt forvaltede fonde.
13F og NPORT arkivering
Detaljer om 13F-arkivering er gratis. Detaljer om NP-ansøgninger kræver et premium-medlemskab. Grønne rækker angiver nye positioner. Røde rækker angiver lukkede positioner. Klik på linket ikon for at se den fulde transaktionshistorik.
Opgrader
for at låse premium-data op og eksportere til Excel ![]() .
.
| Fil dato | Kilde | Investor | Type | Gennemsnitlig pris (Øst) |
Aktier | Δ Aktier (%) |
Rapporteret Værdi ($1000) |
Δ Værdi (%) |
Port Alloc (%) |
|
|---|---|---|---|---|---|---|---|---|---|---|
| 2025-08-12 | 13F | Financial Advocates Investment Management | 16.977 | -4,79 | 469 | -3,70 | ||||
| 2025-07-10 | 13F | Redhawk Wealth Advisors, Inc. | 576.569 | -0,89 | 15.925 | 0,27 | ||||
| 2025-08-12 | 13F | Global Retirement Partners, LLC | 85.299 | 306,42 | 2.356 | 311,71 | ||||
| 2025-07-11 | 13F | Bouvel Investment Partners, LLC | 219.457 | 1,42 | 6.061 | 0,63 | ||||
| 2025-07-14 | 13F | McGlone Suttner Wealth Management, Inc. | 16.579 | -5,66 | 458 | -4,59 | ||||
| 2025-08-11 | 13F | Rothschild Investment Llc | 96.350 | 10,94 | 2.661 | 12,23 | ||||
| 2025-07-16 | 13F | Novem Group | 114.748 | 2,79 | 3.169 | 4,00 | ||||
| 2025-08-05 | 13F | Fullcircle Wealth Llc | 130.658 | 3,73 | 3.609 | 5,37 | ||||
| 2025-07-29 | 13F | Signature Estate & Investment Advisors Llc | 28.749 | 794 | ||||||
| 2025-07-02 | 13F | Crumly & Associates Inc. | 203.641 | 9,28 | 5.625 | 10,56 | ||||
| 2025-07-18 | 13F | Cooper Financial Group | 12.894 | 1,41 | 356 | 2,59 | ||||
| 2025-08-11 | 13F | Private Advisor Group, LLC | 486.797 | -6,24 | 13.445 | -5,14 | ||||
| 2025-05-12 | 13F | Fmr Llc | 0 | -100,00 | 0 | |||||
| 2025-08-11 | 13F | Hexagon Capital Partners LLC | 0 | -100,00 | 0 | |||||
| 2025-08-14 | 13F | UBS Group AG | 2.362.552 | 11,62 | 65.254 | 12,92 | ||||
| 2025-07-23 | 13F | Cannon Wealth Management Services, LLC | 35.257 | -3,01 | 974 | -0,82 | ||||
| 2025-07-11 | 13F | Bond & Devick Financial Network, Inc. | 237.164 | 3,14 | 6.550 | 4,35 | ||||
| 2025-07-22 | 13F | Wealthcare Advisory Partners LLC | 22.884 | 4,46 | 632 | 5,69 | ||||
| 2025-07-29 | 13F | Koshinski Asset Management, Inc. | 40.026 | 4,52 | 1.106 | 5,74 | ||||
| 2025-08-11 | 13F | Principal Securities, Inc. | 23.623 | 59,25 | 652 | 61,39 | ||||
| 2025-07-25 | 13F | Envestnet Portfolio Solutions, Inc. | 49.223 | -67,98 | 1.360 | -67,61 | ||||
| 2025-08-12 | 13F | Jpmorgan Chase & Co | 90.195 | 0,02 | 2.491 | 1,22 | ||||
| 2025-07-23 | 13F | WESPAC Advisors, LLC | 32.239 | 15,51 | 890 | 16,95 | ||||
| 2025-07-16 | 13F | Strategic Investment Solutions, Inc. /IL | 6.472 | 0,00 | 179 | 1,14 | ||||
| 2025-07-29 | 13F | Burford Brothers, Inc. | 33.930 | -3,38 | 937 | -2,19 | ||||
| 2025-08-15 | 13F | Morgan Stanley | 5.604.101 | -5,85 | 154.785 | -4,74 | ||||
| 2025-07-22 | 13F | Merit Financial Group, LLC | 148.581 | 197,78 | 4.104 | 201,25 | ||||
| 2025-04-25 | 13F | Avidian Wealth Solutions, LLC | 0 | -100,00 | 0 | |||||
| 2025-08-12 | 13F | Lodestone Wealth Management LLC | 75.951 | 0,81 | 2.098 | 1,99 | ||||
| 2025-08-13 | 13F | Beacon Pointe Advisors, LLC | 428.134 | 11.825 | ||||||
| 2025-08-11 | 13F | Advisor Resource Council | 0 | -100,00 | 0 | |||||
| 2025-07-11 | 13F | Capital Advantage, Inc. | 2.108.316 | 58.232 | ||||||
| 2025-07-28 | 13F | Sagespring Wealth Partners, Llc | 7.400 | 204 | ||||||
| 2025-08-11 | 13F | Perennial Investment Advisors, LLC | 82.144 | 58,25 | 2.269 | 60,06 | ||||
| 2025-07-29 | 13F | Balboa Wealth Partners | 12.024 | 22,05 | 332 | 23,88 | ||||
| 2025-08-04 | 13F | Arkadios Wealth Advisors | 13.052 | 8,01 | 360 | 9,42 | ||||
| 2025-08-14 | 13F | GWM Advisors LLC | 148.965 | 85,09 | 4.114 | 87,26 | ||||
| 2025-07-22 | 13F | DAVENPORT & Co LLC | 114.237 | 7,55 | 3.155 | 8,83 | ||||
| 2025-07-17 | 13F | KWB Wealth | 100.577 | -40,62 | 2.746 | -40,58 | ||||
| 2025-07-21 | 13F | Capital Planning LLC | 0 | -100,00 | 0 | |||||
| 2025-08-12 | 13F | AlphaCore Capital LLC | 40.380 | -0,22 | 1.115 | 1,00 | ||||
| 2025-08-14 | 13F | Clg Llc | 47.423 | 7,38 | 1.310 | 8,63 | ||||
| 2025-08-14 | 13F | Royal Bank Of Canada | 871.108 | 13,94 | 24.060 | 15,28 | ||||
| 2025-05-08 | 13F | HHM Wealth Advisors, LLC | 0 | -100,00 | 0 | |||||
| 2025-08-14 | 13F | Gotham Asset Management, LLC | 29.430 | 813 | ||||||
| 2025-08-14 | 13F | Wiley Bros.-aintree Capital, Llc | 200.142 | 56,53 | 5.543 | 58,46 | ||||
| 2025-07-10 | 13F | Kmg Fiduciary Partners, Llc | 355.666 | 11,76 | 9.824 | 13,06 | ||||
| 2025-08-08 | 13F | Kingsview Wealth Management, LLC | 251.692 | 19,90 | 6.952 | 21,31 | ||||
| 2025-04-21 | 13F | Ronald Blue Trust, Inc. | 0 | -100,00 | 0 | -100,00 | ||||
| 2025-07-14 | 13F | Main Line Retirement Advisors, LLC | 312.403 | 4,52 | 8.629 | 5,75 | ||||
| 2025-07-25 | 13F | Atria Wealth Solutions, Inc. | 354.998 | -33,64 | 9.806 | -33,14 | ||||
| 2025-07-30 | 13F | TFB Advisors LLC | 7.502 | 207 | ||||||
| 2025-07-31 | 13F | Trademark Financial Management, LLC | 8.419 | -48,34 | 233 | -47,75 | ||||
| 2025-08-18 | 13F/A | Kestra Investment Management, LLC | 59.114 | 20,92 | 1.633 | 22,34 | ||||
| 2025-08-11 | 13F | Aptus Capital Advisors, LLC | 3.223 | 1,42 | 89 | 3,49 | ||||
| 2025-07-31 | 13F | CAP Partners, LLC | 22.091 | 2,24 | 610 | 3,57 | ||||
| 2025-08-14 | 13F | Great Valley Advisor Group, Inc. | 2.150.804 | 4,87 | 59.406 | 6,10 | ||||
| 2025-08-27 | 13F/A | Brinker Capital Investments, LLC | 34.432 | 53,17 | 951 | 55,14 | ||||
| 2025-08-04 | 13F | Bridgewealth Advisory Group, LLC | 17.007 | 470 | ||||||
| 2025-07-21 | 13F | Patriot Financial Group Insurance Agency, LLC | 107.461 | 1,97 | 2.968 | 3,16 | ||||
| 2025-07-21 | 13F | Investment Planning Advisors, Inc. | 17.838 | -34,91 | 493 | -34,22 | ||||
| 2025-08-14 | 13F | Goldman Sachs Group Inc | 331.757 | 9.163 | ||||||
| 2025-04-21 | 13F | Bay Colony Advisory Group, Inc d/b/a Bay Colony Advisors | 0 | -100,00 | 0 | -100,00 | ||||
| 2025-07-16 | 13F | Midwest Heritage Bank, FSB | 10.871 | 34,16 | 300 | 35,75 | ||||
| 2025-08-11 | 13F | Synergy Investment Management, LLC | 0 | -100,00 | 0 | |||||
| 2025-08-11 | 13F | Western Wealth Management, LLC | 7.628 | -0,27 | 211 | 0,96 | ||||
| 2025-08-12 | 13F | Wayfinding Financial, LLC | 105.248 | -1,52 | 3 | 0,00 | ||||
| 2025-08-13 | 13F | Baird Financial Group, Inc. | 689.032 | 1,50 | 19.031 | 2,69 | ||||
| 2025-07-07 | 13F | Thurston, Springer, Miller, Herd & Titak, Inc. | 5.005 | 88,65 | 138 | 91,67 | ||||
| 2025-08-14 | 13F | Benjamin Edwards Inc | 398.486 | 4,55 | 11.006 | 5,78 | ||||
| 2025-08-06 | 13F | Golden State Wealth Management, LLC | 0 | -100,00 | 0 | -100,00 | ||||
| 2025-08-12 | 13F | Steward Partners Investment Advisory, Llc | 20.444 | 7,76 | 565 | 9,09 | ||||
| 2025-07-23 | 13F | Clear Creek Financial Management, LLC | 13.122 | -0,76 | 362 | 0,56 | ||||
| 2025-07-24 | 13F | IFP Advisors, Inc | 4.091 | 38,26 | 113 | 41,25 | ||||
| 2025-08-14 | 13F | Raymond James Financial Inc | 3.978.724 | -0,66 | 109.892 | 0,50 | ||||
| 2025-08-14 | 13F | Sunbelt Securities, Inc. | 237.062 | -9,91 | 6.467 | -9,97 | ||||
| 2025-08-12 | 13F | Marshall & Sterling Wealth Advisors Inc. | 584 | 12,09 | 16 | 14,29 | ||||
| 2025-08-05 | 13F | Mission Wealth Management, Lp | 70.190 | 28,90 | 1.939 | 30,42 | ||||
| 2025-08-14 | 13F | Jane Street Group, Llc | 118.193 | -80,05 | 3.264 | -79,82 | ||||
| 2025-07-16 | 13F | St Germain D J Co Inc | 347.002 | 0,77 | 9.584 | 1,95 | ||||
| 2025-07-24 | 13F | MSH Capital Advisors LLC | 17.791 | 35,46 | 491 | 37,15 | ||||
| 2025-08-14 | 13F | Mariner, LLC | 741.908 | 2,65 | 20.491 | 3,86 | ||||
| 2025-08-08 | 13F | Cetera Investment Advisers | 2.690.563 | 18,97 | 74.313 | 20,37 | ||||
| 2025-08-12 | 13F | J.w. Cole Advisors, Inc. | 36.137 | 8,00 | 998 | 9,31 | ||||
| 2025-08-08 | 13F | Security Financial Services, INC. | 7.471 | 206 | ||||||
| 2025-07-10 | 13F | Wealth Enhancement Advisory Services, Llc | 1.825.546 | 0,40 | 50.403 | 1,54 | ||||
| 2025-07-18 | 13F | Trilogy Capital Inc. | 58.706 | 3,04 | 1.621 | 4,24 | ||||
| 2025-07-16 | 13F | Freestate Advisors LLC | 10.068 | 278 | ||||||
| 2025-08-14 | 13F | Susquehanna International Group, Llp | 56.107 | 1.550 | ||||||
| 2025-08-13 | 13F | Continuum Advisory, LLC | 16.348 | 9,17 | 452 | 10,54 | ||||
| 2025-08-06 | 13F | Prospera Financial Services Inc | 525.656 | -0,67 | 14.519 | 0,50 | ||||
| 2025-08-14 | 13F | Bank Of America Corp /de/ | 0 | -100,00 | 0 | |||||
| 2025-05-09 | 13F | GeoWealth Management, LLC | 0 | -100,00 | 0 | |||||
| 2025-08-13 | 13F | Milestone Investment Advisors LLC | 22.976 | -11,13 | 635 | -10,07 | ||||
| 2025-07-11 | 13F | Farther Finance Advisors, LLC | 8.244 | 174,80 | 228 | 180,25 | ||||
| 2025-08-13 | 13F | Level Four Advisory Services, Llc | 147.583 | 24,98 | 4.076 | 26,47 | ||||
| 2025-07-17 | 13F | Janney Montgomery Scott LLC | 145.898 | 19,74 | 4 | 33,33 | ||||
| 2025-08-05 | 13F | Bank of New York Mellon Corp | 8.032 | 222 | ||||||
| 2025-08-12 | 13F | Calton & Associates, Inc. | 26.589 | 22,07 | 734 | 23,57 | ||||
| 2025-07-23 | 13F | Element Wealth, LLC | 50.022 | 18,45 | 1.382 | 19,88 | ||||
| 2025-08-14 | 13F | Old Mission Capital Llc | 37.367 | -77,84 | 1.032 | -77,58 | ||||
| 2025-08-05 | 13F | Aurdan Capital Management, LLC | 17.571 | 4,75 | 485 | 6,13 | ||||
| 2025-07-21 | 13F | Ameritas Advisory Services, LLC | 42.157 | -7,93 | 1.164 | -6,81 | ||||
| 2025-07-28 | 13F | Rosenberg Matthew Hamilton | 825 | 1.061,97 | 23 | 2.100,00 | ||||
| 2025-08-18 | 13F | Wellington Capital Management, Inc. | 74.041 | 1 | ||||||
| 2025-07-31 | 13F | Cambridge Investment Research Advisors, Inc. | 1.332.030 | 14,62 | 37 | 16,13 | ||||
| 2025-05-12 | 13F | Founders Financial Securities Llc | 0 | -100,00 | 0 | |||||
| 2025-08-15 | 13F | Equitable Holdings, Inc. | 113.391 | 37,70 | 3.132 | 39,28 | ||||
| 2025-08-13 | 13F | Capital Group Private Client Services, Inc. | 407.629 | 391,42 | 11.259 | 397,26 | ||||
| 2025-07-14 | 13F | AdvisorNet Financial, Inc | 4.551 | 67,62 | 126 | 68,92 | ||||
| 2025-07-24 | 13F | Von Berge Wealth Management Group, LLC | 63.478 | 44,27 | 1.756 | 47,48 | ||||
| 2025-08-08 | 13F | Larson Financial Group LLC | 5.727 | 118,50 | 158 | 122,54 | ||||
| 2025-08-13 | 13F | Capital Analysts, Inc. | 1.835 | 0 | ||||||
| 2025-07-16 | 13F | Swisher Financial Concepts, Inc. | 220.873 | -2,59 | 6.101 | -1,45 | ||||
| 2025-04-23 | 13F | VisionPoint Advisory Group, LLC | 0 | -100,00 | 0 | |||||
| 2025-08-14 | 13F | Wells Fargo & Company/mn | 2.779.290 | 13,13 | 76.764 | 14,46 | ||||
| 2025-08-04 | 13F | Creekmur Asset Management LLC | 266.691 | 7.366 | ||||||
| 2025-08-14 | 13F | IHT Wealth Management, LLC | 8.332 | 230 | ||||||
| 2025-07-17 | 13F | LifeGoal Wealth Advisors | 36.160 | -74,56 | 999 | -74,28 | ||||
| 2025-05-02 | 13F | Capital A Wealth Management, LLC | 834 | -7,44 | 23 | -8,33 | ||||
| 2025-08-05 | 13F | 5T Wealth, LLC | 75.557 | -1,14 | 2.087 | 0,00 | ||||
| 2025-07-09 | 13F | Pines Wealth Management, LLC | 28.921 | 20,73 | 799 | 26,47 | ||||
| 2025-07-28 | 13F | Eq Wealth Advisors, Llc | 483.678 | 13,86 | 13.359 | 15,20 | ||||
| 2025-08-12 | 13F | LPL Financial LLC | 9.943.155 | 21,63 | 274.630 | 23,05 | ||||
| 2025-07-10 | 13F | Sharkey, Howes & Javer | 60.723 | -25,12 | 1.677 | -24,22 | ||||
| 2025-08-06 | 13F | Blue Investment Partners LLC | 0 | -100,00 | 0 | |||||
| 2025-08-14 | 13F | Integrated Wealth Concepts LLC | 204.377 | 8,93 | 5.645 | 10,19 | ||||
| 2025-07-31 | 13F | Turning Point Benefit Group, Inc. | 107.849 | -19,00 | 2.979 | -15,83 | ||||
| 2025-08-04 | 13F | IFG Advisory, LLC | 15.213 | 84,29 | 420 | 86,67 | ||||
| 2025-07-07 | 13F | TruWealth Advisors, LLC | 697.947 | 14,22 | 19.277 | 15,56 | ||||
| 2025-07-25 | 13F | Concurrent Investment Advisors, LLC | 188.553 | 21,57 | 5.208 | 22,98 | ||||
| 2025-08-04 | 13F | Creative Financial Designs Inc /adv | 239.126 | -28,67 | 6.605 | -27,84 | ||||
| 2025-08-14 | 13F | Gerber Kawasaki Wealth & Investment Management | 10.494 | -22,35 | 290 | -21,47 | ||||
| 2025-08-14 | 13F | Federation des caisses Desjardins du Quebec | 700 | -72,00 | 19 | -72,06 | ||||
| 2025-08-13 | 13F | Flow Traders U.s. Llc | 0 | -100,00 | 0 | |||||
| 2025-08-04 | 13F | Impact Partnership Wealth, LLC | 18.676 | 516 | ||||||
| 2025-07-16 | 13F | ORG Partners LLC | 7.610 | 409,37 | 210 | 425,00 | ||||
| 2025-07-29 | 13F | Stephens Inc /ar/ | 643.841 | 8,66 | 17.783 | 9,94 | ||||
| 2025-08-14 | 13F | Modern Wealth Management, LLC | 13.250 | 14,64 | 366 | 15,87 | ||||
| 2025-08-12 | 13F | Proequities, Inc. | 0 | 0 | ||||||
| 2025-07-30 | 13F | Financial Perspectives, Inc | 1.853 | 59,60 | 51 | 64,52 | ||||
| 2025-09-04 | 13F/A | Advisor Group Holdings, Inc. | 1.768.762 | 30,24 | 48.855 | 31,77 | ||||
| 2025-07-17 | 13F | Venture Visionary Partners LLC | 12.612 | 348 | ||||||
| 2025-07-21 | 13F | DHJJ Financial Advisors, Ltd. | 70 | 0,00 | 2 | 0,00 | ||||
| 2025-07-09 | 13F | WealthCare Investment Partners, LLC | 20.287 | -2,77 | 560 | 0,72 | ||||
| 2025-07-23 | 13F | Seamount Financial Group Inc | 58.366 | 4,03 | 1.612 | 5,29 | ||||
| 2025-07-11 | 13F | AA Financial Advisors, LLC | 9.906 | 0,00 | 274 | 1,11 | ||||
| 2025-07-31 | 13F | Moloney Securities Asset Management, LLC | 10.960 | -63,35 | 303 | -62,99 | ||||
| 2025-08-07 | 13F | Winch Advisory Services, LLC | 741.436 | 1,17 | 20.478 | 2,35 | ||||
| 2025-07-30 | 13F | Onyx Bridge Wealth Group LLC | 389.717 | 87,31 | 10.764 | 89,49 | ||||
| 2025-07-24 | 13F | Us Bancorp \de\ | 5.229 | 0,00 | 144 | 1,41 | ||||
| 2025-07-23 | 13F | Prime Capital Investment Advisors, LLC | 43.800 | -53,93 | 1.210 | -53,41 | ||||
| 2025-08-15 | 13F | Kestra Advisory Services, LLC | 360.665 | 20,05 | 9.962 | 21,46 | ||||
| 2025-08-14 | 13F | Colony Group, LLC | 36.019 | -6,20 | 995 | -5,15 | ||||
| 2025-07-24 | 13F | MFA Wealth Services | 69.744 | 4,63 | 1.926 | 5,88 | ||||
| 2025-08-14 | 13F | Citadel Advisors Llc | 66.928 | -72,54 | 1.849 | -72,23 | ||||
| 2025-08-01 | 13F | Rossby Financial, LCC | 478 | 13 | ||||||
| 2025-08-04 | 13F | Atria Investments Llc | 418.117 | -10,40 | 11.548 | -9,35 | ||||
| 2025-08-11 | 13F | Inspire Advisors, LLC | 57.332 | 1,96 | 1.584 | 3,13 | ||||
| 2025-07-22 | 13F | Oak Hill Wealth Advisors, Llc | 51.123 | 1.406 | ||||||
| 2025-07-17 | 13F | Tempus Wealth Planning, LLC | 24.845 | 1,76 | 686 | 3,00 | ||||
| 2025-07-11 | 13F | LongView Wealth Management | 84.352 | 26,45 | 2.330 | 27,90 | ||||
| 2025-05-15 | 13F | MAI Capital Management | 0 | -100,00 | 0 | |||||
| 2025-07-14 | 13F | Armstrong Advisory Group, Inc | 0 | -100,00 | 0 | |||||
| 2025-08-15 | 13F | Lantern Wealth Advisors, LLC | 10.059 | 278 | ||||||
| 2025-07-30 | 13F | Eqis Capital Management, Inc. | 0 | -100,00 | 0 | |||||
| 2025-08-13 | 13F | RPg Family Wealth Advisory, LLC | 140.717 | 3.887 | ||||||
| 2025-08-18 | 13F | Geneos Wealth Management Inc. | 22.070 | 43,08 | 610 | 44,66 | ||||
| 2025-08-12 | 13F | Barnes Pettey Financial Advisors, Llc | 16.250 | 16,05 | 449 | 17,28 | ||||
| 2025-07-30 | 13F | Klingman & Associates, LLC | 12.381 | 0,00 | 342 | 0,89 | ||||
| 2025-08-12 | 13F | Wealth Advisors of Iowa, LLC | 16.918 | -16,47 | 467 | -15,40 | ||||
| 2025-08-14 | 13F | Mercer Global Advisors Inc /adv | 14.646 | -69,58 | 405 | -69,25 | ||||
| 2025-08-12 | 13F | BlueStem Wealth Partners, LLC | 747.841 | 6,05 | 20.655 | 7,30 | ||||
| 2025-07-09 | 13F | Dynamic Advisor Solutions LLC | 141.617 | 12,10 | 3.911 | 13,43 | ||||
| 2025-07-29 | 13F | Carmel Capital Partners, LLC | 215.493 | 8,74 | 5.952 | 10,02 | ||||
| 2025-07-25 | 13F | Apollon Wealth Management, LLC | 55.424 | -6,50 | 1.531 | -5,44 | ||||
| 2025-08-08 | 13F | Thoroughbred Financial Services, Llc | 38.744 | -19,17 | 1 | 0,00 | ||||
| 2025-08-15 | 13F | Captrust Financial Advisors | 52.367 | 0,51 | 1.446 | 1,69 | ||||
| 2025-07-15 | 13F | Hartmann Taylor Wealth Management, LLC | 89.293 | -35,08 | 2.466 | -34,31 | ||||
| 2025-08-13 | 13F | Renaissance Technologies Llc | 177.100 | 56,25 | 4.892 | 58,08 | ||||
| 2025-08-04 | 13F | Spire Wealth Management | 13.870 | 0,27 | 383 | 1,59 | ||||
| 2025-07-15 | 13F | Regatta Capital Group, Llc | 10.245 | 283 | ||||||
| 2025-08-07 | 13F | Kestra Private Wealth Services, Llc | 18.169 | -16,00 | 502 | -15,08 | ||||
| 2025-07-22 | 13F | Beacon Financial Advisory LLC | 11.150 | 0,70 | 308 | 1,66 | ||||
| 2025-07-03 | 13F | TrueWealth Advisors, LLC | 779.709 | 6,32 | 21.536 | 7,57 | ||||
| 2025-08-07 | 13F | PFG Advisors | 30.400 | 1,64 | 840 | 2,82 | ||||
| 2025-08-12 | 13F | Tradition Wealth Management, LLC | 11.400 | -0,87 | 315 | 0,32 | ||||
| 2025-08-14 | 13F/A | Rockefeller Capital Management L.P. | 288.712 | 7.974 | ||||||
| 2025-08-11 | 13F | HighTower Advisors, LLC | 17.001 | 52,01 | 470 | 53,77 | ||||
| 2025-08-13 | 13F | Strategic Family Wealth Counselors, L.L.C. | 183.258 | 17,43 | 5.062 | 18,80 | ||||
| 2025-08-06 | 13F | Souders Financial Advisors | 332.556 | 6,79 | 9.185 | 8,05 | ||||
| 2025-07-11 | 13F | SILVER OAK SECURITIES, Inc | 177.141 | 4,95 | 4.893 | 6,16 | ||||
| 2025-08-01 | 13F | Brookwood Investment Group LLC | 14.070 | 1,04 | 389 | 2,11 | ||||
| 2025-04-22 | 13F | RFP Financial Group LLC | 0 | -100,00 | 0 | |||||
| 2025-07-29 | 13F | DeDora Capital, Inc. | 43.161 | -90,54 | 1.192 | -90,43 | ||||
| 2025-07-28 | 13F | RFG Advisory, LLC | 10.106 | -71,09 | 279 | -70,75 | ||||
| 2025-07-28 | 13F | Harbour Investments, Inc. | 271.768 | 4,41 | 7.506 | 5,63 | ||||
| 2025-07-22 | 13F | Olistico Wealth, LLC | 1.947 | 18,86 | 54 | 20,45 | ||||
| 2025-07-30 | 13F | Cullen/frost Bankers, Inc. | 121.889 | 28,84 | 3.367 | 30,36 | ||||
| 2025-08-11 | 13F | Nations Financial Group Inc, /ia/ /adv | 33.465 | 7,83 | 924 | 9,09 | ||||
| 2025-07-25 | 13F | Transcendent Capital Group LLC | 69.788 | 3,25 | 1.928 | 4,44 | ||||
| 2025-07-14 | 13F | Opal Wealth Advisors, LLC | 7.336 | 0,81 | 203 | 2,02 | ||||
| 2025-08-04 | 13F | Pensionmark Financial Group, Llc | 18.189 | 17,05 | 502 | 18,40 | ||||
| 2025-08-13 | 13F | Capital International Investors | 122.892 | 33,73 | 3.394 | 35,33 | ||||
| 2025-08-14 | 13F | CoreCap Advisors, LLC | 6.779 | -87,27 | 187 | -87,13 | ||||
| 2025-05-12 | 13F | Independent Advisor Alliance | 0 | -100,00 | 0 | |||||
| 2025-08-05 | 13F | GPS Wealth Strategies Group, LLC | 14.990 | -1,64 | 414 | -0,48 | ||||
| 2025-09-09 | 13F | NWF Advisory Services Inc. | 176.937 | -1,02 | 4.887 | 0,14 | ||||
| 2025-08-12 | 13F | OneAscent Financial Services LLC | 104.656 | -22,38 | 3 | -33,33 | ||||
| 2025-08-04 | 13F | Integrity Alliance, Llc. | 0 | -100,00 | 0 | |||||
| 2025-08-13 | 13F | Argyle Capital Partners, LLC | 28.240 | 29,00 | 780 | 30,49 | ||||
| 2025-08-14 | 13F | Comerica Bank | 15.348 | 23,36 | 424 | 24,78 | ||||
| 2025-08-14 | 13F | Smartleaf Asset Management LLC | 424.123 | 7,88 | 11.663 | 8,66 | ||||
| 2025-07-23 | 13F | Valmark Advisers, Inc. | 514.219 | 13,85 | 14.203 | 15,19 | ||||
| 2025-08-14 | 13F | Keystone Financial Services, LLC | 113.482 | 4,40 | 3.134 | 5,63 | ||||
| 2025-07-30 | 13F | Bleakley Financial Group, LLC | 10.325 | -15,18 | 285 | -14,16 | ||||
| 2025-08-05 | 13F | Bank Of Montreal /can/ | 9.300 | 18,47 | 257 | 19,63 | ||||
| 2025-07-08 | 13F | Nbc Securities, Inc. | 1.230 | 0,00 | 0 | |||||
| 2025-08-04 | 13F | Assetmark, Inc | 256.056 | 5.070,76 | 7.072 | 5.138,52 | ||||
| 2025-07-14 | 13F | Oliver Luxxe Assets LLC | 0 | -100,00 | 0 | |||||
| 2025-08-04 | 13F | Waterfront Wealth Inc. | 26.632 | -0,07 | 736 | 1,10 | ||||
| 2025-08-06 | 13F | Commonwealth Equity Services, Llc | 2.400.798 | 13,21 | 66 | 15,79 | ||||
| 2025-08-06 | 13F | Financial Advisory Corp /ut/ /adv | 52.720 | 5,94 | 1 | 0,00 | ||||
| 2025-08-14 | 13F | Betterment LLC | 320.413 | 1,06 | 9 | 0,00 | ||||
| 2025-08-01 | 13F | Schmidt P J Investment Management Inc | 29.217 | -0,28 | 807 | 0,88 | ||||
| 2025-07-16 | 13F | Owen LaRue, LLC | 33.775 | -1,42 | 933 | -0,32 | ||||
| 2025-08-14 | 13F | Mml Investors Services, Llc | 893.794 | 18,60 | 25 | 20,00 | ||||
| 2025-08-08 | 13F | Good Life Advisors, LLC | 21.898 | -27,21 | 605 | -26,43 | ||||
| 2025-08-19 | 13F | Cape Investment Advisory, Inc. | 503 | 14 | ||||||
| 2025-07-10 | 13F | Sovran Advisors, LLC | 35.353 | -30,58 | 972 | -28,63 | ||||
| 2025-07-31 | 13F | Richards, Merrill & Peterson, Inc. | 46.804 | 43,82 | 1.293 | 45,50 | ||||
| 2025-05-15 | 13F/A | Orion Portfolio Solutions, LLC | 22.480 | 63,42 | 614 | 63,47 | ||||
| 2025-07-11 | 13F | Skyline Advisors, Inc. | 481.421 | 1,77 | 13.297 | 2,96 | ||||
| 2025-07-29 | 13F | Uhlmann Price Securities, Llc | 22.637 | 93,48 | 625 | 95,92 | ||||
| 2025-08-13 | 13F | EverSource Wealth Advisors, LLC | 11.284 | 312 | ||||||
| 2025-08-14 | 13F | Herold Advisors, Inc. | 10.059 | 278 | ||||||
| 2025-05-16 | 13F | American Trust | 0 | -100,00 | 0 | -100,00 | ||||
| 2025-07-14 | 13F | Sowell Financial Services LLC | 112.270 | 140,56 | 3.101 | 143,33 | ||||
| 2025-08-06 | 13F | Wedbush Securities Inc | 32.957 | 13,96 | 1 | |||||
| 2025-07-07 | 13F | Peterson Wealth Advisors, LLC | 25.514 | -1,82 | 705 | 2,03 | ||||
| 2025-07-18 | 13F | Truist Financial Corp | 67.256 | 36,99 | 1.831 | 36,64 | ||||
| 2025-07-22 | 13F | Confluence Wealth Services, Inc. | 216.749 | 0,16 | 5.987 | 3,06 | ||||
| 2025-08-14 | 13F | Ausdal Financial Partners, Inc. | 49.114 | 0,62 | 1.357 | 1,80 | ||||
| 2025-07-25 | 13F | M.e. Allison & Co., Inc. | 25.880 | 71,93 | 715 | 74,15 | ||||
| 2025-08-13 | 13F | Jones Financial Companies Lllp | 840.932 | 18,62 | 23.126 | 19,48 | ||||
| 2025-07-17 | 13F | Centennial Wealth Advisory LLC | 146.061 | 145,86 | 4.030 | 148,55 | ||||
| 2025-07-25 | 13F | Cwm, Llc | 929.285 | 441,89 | 26 | 525,00 | ||||
| 2025-08-12 | 13F | Insigneo Advisory Services, Llc | 10.723 | 0,00 | 296 | 1,37 | ||||
| 2025-08-12 | 13F | Entruity Wealth, LLC | 184.650 | 11,43 | 5.100 | 12,76 | ||||
| 2025-08-14 | 13F | Stifel Financial Corp | 1.240.773 | 25,22 | 34.270 | 26,68 | ||||
| 2025-08-04 | 13F | Cottage Street Advisors LLC | 42.928 | 1,39 | 1.186 | 2,60 | ||||
| 2025-08-13 | 13F | VestGen Advisors, LLC | 302.078 | -0,19 | 8.343 | 0,98 | ||||
| 2025-07-30 | 13F | D.a. Davidson & Co. | 193.473 | 9,08 | 5.344 | 10,35 | ||||
| 2025-08-12 | 13F | SRS Capital Advisors, Inc. | 1.723 | 54,81 | 48 | 56,67 | ||||
| 2025-07-29 | 13F | Stratos Wealth Partners, LTD. | 42.904 | 1.185 | ||||||
| 2025-07-17 | 13F | LexAurum Advisors, LLC | 11.342 | 11,27 | 313 | 12,59 | ||||
| 2025-08-05 | 13F | Sigma Planning Corp | 19.002 | -1,92 | 525 | -0,76 | ||||
| 2025-07-17 | 13F | Johnson Bixby & Associates, LLC | 0 | -100,00 | 0 | |||||
| 2025-07-28 | 13F | Mutual Advisors, LLC | 11.590 | -55,10 | 321 | -54,35 | ||||
| 2025-07-29 | 13F | Private Trust Co Na | 42.543 | 0,00 | 1.175 | 1,21 | ||||
| 2025-05-15 | 13F | Advisory Services Network, LLC | 0 | -100,00 | 0 | |||||
| 2025-07-10 | 13F | SK Wealth Management, LLC | 44.929 | 14,85 | 1.240 | 18,79 | ||||
| 2025-08-04 | 13F | Daymark Wealth Partners, Llc | 28.267 | -2,04 | 781 | -0,89 | ||||
| 2025-08-13 | 13F | Gateway Wealth Partners, LLC | 22.482 | 52,47 | 621 | 54,23 | ||||
| 2025-07-09 | 13F | Fiduciary Alliance LLC | 117.756 | 3.252 | ||||||
| 2025-08-06 | 13F | Mascagni Wealth Management, Inc. | 74.162 | 14,05 | 2.048 | 15,38 | ||||
| 2025-08-13 | 13F | Vermillion & White Wealth Management Group, LLC | 3.329 | 6,46 | 92 | 7,06 | ||||
| 2025-07-24 | 13F | Endeavor Private Wealth, Inc. | 56.640 | 31,35 | 1.564 | 32,88 | ||||
| 2025-07-30 | 13F | Brookstone Capital Management | 16.533 | -5,63 | 457 | -4,60 | ||||
| 2025-08-08 | 13F | Avantax Advisory Services, Inc. | 79.125 | 41,60 | 2.185 | 43,28 | ||||
| 2025-08-12 | 13F | Jacobi Capital Management LLC | 78.638 | 1,51 | 2.172 | 2,70 | ||||
| 2025-08-13 | 13F | Forthright Family Wealth Advisory LLC | 114.201 | -1,44 | 3.154 | -0,28 | ||||
| 2025-07-18 | 13F | Vicus Capital | 259.927 | -12,82 | 7.179 | -11,80 | ||||
| 2025-07-25 | 13F | Total Clarity Wealth Management, Inc. | 105.399 | 9,63 | 2.911 | 11,02 | ||||
| 2025-08-08 | 13F | Pnc Financial Services Group, Inc. | 0 | -100,00 | 0 | |||||
| 2025-08-25 | 13F | Fulcrum Equity Management | 0 | -100,00 | 0 | |||||
| 2025-07-10 | 13F | Global Financial Private Client, LLC | 15.607 | 0,00 | 431 | 1,17 | ||||
| 2025-08-12 | 13F | Cornerstone Wealth Management, LLC | 11.329 | 10,35 | 313 | 11,43 | ||||
| 2025-08-13 | 13F | Northwestern Mutual Wealth Management Co | 654.276 | 111,55 | 18.071 | 114,04 | ||||
| 2025-08-08 | 13F | Capital Investment Advisory Services, LLC | 7.080 | 0,00 | 196 | 1,04 | ||||
| 2025-08-14 | 13F | Snowden Capital Advisors LLC | 18.955 | 6,29 | 524 | 7,61 | ||||
| 2025-08-01 | 13F | Envestnet Asset Management Inc | 4.244.651 | 16,71 | 117.237 | 18,08 | ||||
| 2025-07-17 | 13F | Beacon Capital Management, LLC | 94 | 1,08 | 3 | 0,00 | ||||
| 2025-07-01 | 13F | Kera Capital Partners, Inc. | 12.674 | 0,00 | 350 | 1,16 |