Grundlæggende statistik
| Institutionelle ejere | 242 total, 242 long only, 0 short only, 0 long/short - change of 11,52% MRQ |
| Gennemsnitlig porteføljeallokering | 0.3505 % - change of 3,61% MRQ |
| Institutionelle aktier (lange) | 51.850.474 (ex 13D/G) - change of 11,79MM shares 29,42% MRQ |
| Institutionel værdi (lang) | $ 1.502.591 USD ($1000) |
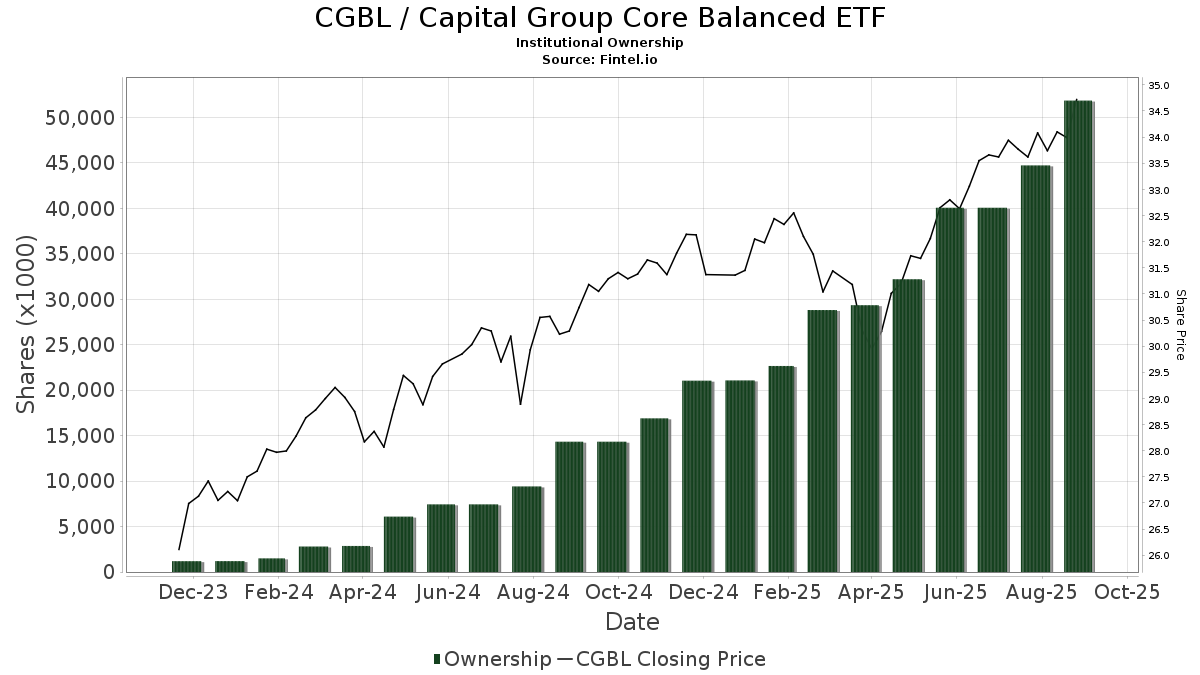
Institutionelt ejerskab og aktionærer
Capital Group Core Balanced ETF (US:CGBL) har 242 institutionelle ejere og aktionærer, der har indsendt 13D/G- eller 13F-formularer til Securities Exchange Commission (SEC). Disse institutioner har i alt 51,850,474 aktier. Største aktionærer omfatter LPL Financial LLC, Envestnet Asset Management Inc, Advance Capital Management, Inc., Morgan Stanley, Cwm, Llc, Raymond James Financial Inc, Commonwealth Equity Services, Llc, Wealth Enhancement Advisory Services, Llc, Cetera Investment Advisers, and Cambridge Investment Research Advisors, Inc. .
Capital Group Core Balanced ETF (ARCA:CGBL) institutionel ejerskabsstruktur viser aktuelle positioner i virksomheden efter institutioner og fonde, samt seneste ændringer i positionsstørrelse. Større aktionærer kan omfatte individuelle investorer, investeringsforeninger, hedgefonde eller institutioner. Skema 13D angiver, at investoren besidder (eller besidder) mere end 5 % af virksomheden og har til hensigt (eller har til hensigt at) aktivt at forfølge en ændring i forretningsstrategi. Skema 13G indikerer en passiv investering på over 5%.
The share price as of September 17, 2025 is 34,77 / share. Previously, on September 18, 2024, the share price was 30,74 / share. This represents an increase of 13,11% over that period.
Fondens stemningsscore
Fund Sentiment Score (fka Ownership Accumulation Score) finder de aktier, der bliver mest købt af fonde. Det er resultatet af en sofistikeret, multi-faktor kvantitativ model, der identificerer virksomheder med de højeste niveauer af institutionel akkumulering. Scoringsmodellen bruger en kombination af den samlede stigning i oplyste ejere, ændringerne i porteføljeallokeringer i disse ejere og andre målinger. Tallet går fra 0 til 100, hvor højere tal indikerer et højere niveau af akkumulering for sine jævnaldrende, og 50 er gennemsnittet.
Opdateringsfrekvens: Dagligt
Se Ownership Explorer, som giver en liste over højest rangerende virksomheder.
Institutionel Put/Call-forhold
Ud over at indberette standardaktie- og gældsudstedelser skal institutter med mere end 100 mill. aktiver under forvaltning også oplyse deres put- og call-optionsbeholdninger. Da salgsoptioner generelt indikerer negativ stemning, og købsoptioner indikerer positiv stemning, kan vi få en fornemmelse af den overordnede institutionelle stemning ved at plotte forholdet mellem put og kald. Diagrammet til højre viser det historiske put/call-forhold for dette instrument.
Brug af Put/Call Ratio som en indikator for investorernes stemning overvinder en af de vigtigste mangler ved at bruge totalt institutionelt ejerskab, som er, at en betydelig mængde af aktiver under forvaltning investeres passivt for at spore indekser. Passivt forvaltede fonde køber typisk ikke optioner, så indikatoren for put/call-forholdet følger mere nøje følelsen af aktivt forvaltede fonde.
13F og NPORT arkivering
Detaljer om 13F-arkivering er gratis. Detaljer om NP-ansøgninger kræver et premium-medlemskab. Grønne rækker angiver nye positioner. Røde rækker angiver lukkede positioner. Klik på linket ikon for at se den fulde transaktionshistorik.
Opgrader
for at låse premium-data op og eksportere til Excel ![]() .
.
| Fil dato | Kilde | Investor | Type | Gennemsnitlig pris (Øst) |
Aktier | Δ Aktier (%) |
Rapporteret Værdi ($1000) |
Δ Værdi (%) |
Port Alloc (%) |
|
|---|---|---|---|---|---|---|---|---|---|---|
| 2025-07-29 | 13F | Burford Brothers, Inc. | 38.845 | 18,69 | 1.299 | 28,13 | ||||
| 2025-08-15 | 13F | First Heartland Consultants, Inc. | 56.571 | 59,51 | 1.892 | 72,22 | ||||
| 2025-07-22 | 13F | Merit Financial Group, LLC | 156.348 | 119,34 | 5.228 | 136,78 | ||||
| 2025-07-29 | 13F | Stratos Wealth Advisors, LLC | 40.162 | 40,47 | 1.343 | 51,75 | ||||
| 2025-08-13 | 13F | Certior Financial Group, Llc | 13.308 | 9,51 | 445 | 18,35 | ||||
| 2025-08-14 | 13F | UBS Group AG | 113.689 | 24,39 | 3.802 | 34,26 | ||||
| 2025-08-19 | 13F | National Asset Management, Inc. | 384.074 | 514,41 | 12.843 | 557,27 | ||||
| 2025-08-14 | 13F | TCG Advisory Services, LLC | 35.093 | -52,27 | 1.173 | -48,48 | ||||
| 2025-08-12 | 13F | Financial Advocates Investment Management | 34.722 | -8,52 | 1.161 | -1,19 | ||||
| 2025-07-29 | 13F | Signature Estate & Investment Advisors Llc | 89.976 | 13,75 | 3.009 | 22,78 | ||||
| 2025-07-14 | 13F | Sweeney & Michel, Llc | 6.437 | 216 | ||||||
| 2025-07-16 | 13F | Kiley Juergens Wealth Management, Llc | 15.061 | 32,73 | 504 | 43,30 | ||||
| 2025-07-09 | 13F | Keystone Wealth Services, LLC | 30.000 | -16,86 | 1.003 | -10,21 | ||||
| 2025-08-11 | 13F | Bell Investment Advisors, Inc | 46 | 0,00 | 2 | 0,00 | ||||
| 2025-08-08 | 13F | Gts Securities Llc | 15.693 | 525 | ||||||
| 2025-08-14 | 13F | Diversify Wealth Management, Llc | 11.911 | 14,05 | 405 | 25,39 | ||||
| 2025-08-11 | 13F | Private Advisor Group, LLC | 444.601 | 20,12 | 14.867 | 29,66 | ||||
| 2025-07-29 | 13F | Koshinski Asset Management, Inc. | 64.610 | 4,76 | 2.161 | 13,09 | ||||
| 2025-07-29 | 13F | Balboa Wealth Partners | 14.723 | 492 | ||||||
| 2025-07-29 | 13F | Private Trust Co Na | 9.866 | 0,00 | 330 | 7,87 | ||||
| 2025-07-28 | 13F | Sagespring Wealth Partners, Llc | 119.313 | 27,27 | 3.990 | 37,36 | ||||
| 2025-08-12 | 13F | Lodestone Wealth Management LLC | 12.927 | 0,32 | 432 | 8,27 | ||||
| 2025-08-07 | 13F | Cvfg Llc | 103.662 | 17,84 | 3.466 | 27,19 | ||||
| 2025-08-06 | 13F | Vantage Financial Partners, LLC | 33.821 | 1.131 | ||||||
| 2025-08-11 | 13F | Principal Securities, Inc. | 1.985 | 66 | ||||||
| 2025-05-02 | 13F | Capital A Wealth Management, LLC | 1.858 | -8,92 | 58 | -9,52 | ||||
| 2025-07-22 | 13F | Simplicity Wealth,LLC | 6.402 | 214 | ||||||
| 2025-08-12 | 13F | Jpmorgan Chase & Co | 8.040 | 269 | ||||||
| 2025-08-18 | 13F | Tyler-Stone Wealth Management | 20.990 | 15,20 | 702 | 24,29 | ||||
| 2025-07-10 | 13F | Financial Management Network Inc | 7.614 | -8,78 | 257 | 6,22 | ||||
| 2025-08-04 | 13F | Mesirow Financial Investment Management, Inc. | 289.500 | 10,40 | 9.681 | 19,15 | ||||
| 2025-08-12 | 13F | SRS Capital Advisors, Inc. | 4.453 | 85,08 | 149 | 100,00 | ||||
| 2025-07-25 | 13F | McNamara Financial Services, Inc. | 10.271 | -54,94 | 343 | -51,42 | ||||
| 2025-08-14 | 13F | Wells Fargo & Company/mn | 612.948 | 369.145,78 | 20.497 | 409.820,00 | ||||
| 2025-08-14 | 13F | GWM Advisors LLC | 133.638 | 293,72 | 4.469 | 325,12 | ||||
| 2025-08-14 | 13F | IHT Wealth Management, LLC | 15.668 | 77,92 | 524 | 92,28 | ||||
| 2025-08-13 | 13F | Bare Financial Services, Inc | 36.522 | 22,55 | 1.221 | 32,29 | ||||
| 2025-07-22 | 13F | DAVENPORT & Co LLC | 47.186 | 74,80 | 1.578 | 88,64 | ||||
| 2025-08-14 | 13F | Wiley Bros.-aintree Capital, Llc | 164.127 | 46,97 | 5.527 | 58,59 | ||||
| 2025-07-17 | 13F | KWB Wealth | 232.371 | 68,01 | 7.199 | 66,47 | ||||
| 2025-07-28 | 13F | Holistic Planning, LLC | 6.398 | -39,56 | 214 | -34,86 | ||||
| 2025-07-25 | 13F | Atria Wealth Solutions, Inc. | 60.108 | -59,28 | 2.020 | -56,00 | ||||
| 2025-08-14 | 13F | Great Valley Advisor Group, Inc. | 344.272 | 25,35 | 11.513 | 35,31 | ||||
| 2025-07-25 | 13F | Cwm, Llc | 2.207.565 | 208,62 | 74 | 231,82 | ||||
| 2025-05-08 | 13F | Plante Moran Financial Advisors, LLC | 0 | -100,00 | 0 | |||||
| 2025-08-15 | 13F | High Falls Advisors, Inc | 9.635 | 0,00 | 322 | 8,05 | ||||
| 2025-08-14 | 13F | Tudor Financial Inc. | 11.394 | 50,75 | 381 | 62,82 | ||||
| 2025-08-08 | 13F | Kingsview Wealth Management, LLC | 27.787 | -12,25 | 929 | -5,30 | ||||
| 2025-08-08 | 13F | Creative Planning | 6.530 | 218 | ||||||
| 2025-08-14 | 13F | Clg Llc | 92.348 | 125,22 | 3.088 | 143,15 | ||||
| 2025-07-21 | 13F | Patriot Financial Group Insurance Agency, LLC | 55.705 | 27,74 | 1.863 | 37,93 | ||||
| 2025-08-08 | 13F | CWS Financial Advisors, LLC | 93.389 | 32,24 | 3.123 | 42,75 | ||||
| 2025-08-14 | 13F | Mpwm Advisory Solutions, Llc | 444 | 1,83 | 15 | 7,69 | ||||
| 2025-08-04 | 13F | Bridgewealth Advisory Group, LLC | 16.631 | 5,96 | 556 | 14,40 | ||||
| 2025-08-14 | 13F | Benjamin Edwards Inc | 265.893 | 40,89 | 8.891 | 52,09 | ||||
| 2025-08-13 | 13F | Baird Financial Group, Inc. | 203.993 | 3,58 | 6.822 | 11,80 | ||||
| 2025-08-01 | 13F | Gwn Securities Inc. | 0 | -100,00 | 0 | |||||
| 2025-08-11 | 13F | United Advisor Group, LLC | 28.694 | 69,85 | 960 | 83,37 | ||||
| 2025-08-11 | 13F | Regal Investment Advisors LLC | 9.166 | 307 | ||||||
| 2025-07-24 | 13F | IFP Advisors, Inc | 210.471 | 16,47 | 7.038 | 25,72 | ||||
| 2025-07-08 | 13F | Advance Capital Management, Inc. | 2.707.404 | 24,39 | 90.536 | 34,27 | ||||
| 2025-07-29 | 13F | Latitude Advisors, LLC | 16.433 | 7,70 | 550 | 16,31 | ||||
| 2025-08-12 | 13F | Steward Partners Investment Advisory, Llc | 51.829 | 14,97 | 1.733 | 24,14 | ||||
| 2025-07-23 | 13F | Clear Creek Financial Management, LLC | 89.959 | 6,48 | 3.008 | 14,94 | ||||
| 2025-08-14 | 13F | Royal Bank Of Canada | 1.533.507 | 1,59 | 51.281 | 9,66 | ||||
| 2025-07-10 | 13F | High Net Worth Advisory Group LLC | 164.745 | 18,93 | 5.509 | 28,38 | ||||
| 2025-08-04 | 13F | Flagship Harbor Advisors, Llc | 194.959 | 6.519 | ||||||
| 2025-08-15 | 13F | Morgan Stanley | 2.402.025 | 9,23 | 80.324 | 17,91 | ||||
| 2025-08-12 | 13F | Proequities, Inc. | 0 | 0 | ||||||
| 2025-07-30 | 13F | Financial Perspectives, Inc | 5.821 | 225,92 | 195 | 252,73 | ||||
| 2025-08-14 | 13F | Visionary Wealth Advisors | 18.078 | 6,66 | 605 | 15,05 | ||||
| 2025-07-23 | 13F | Capital Management Associates, Inc | 186.189 | -40,48 | 6.226 | -35,75 | ||||
| 2025-08-14 | 13F | Susquehanna International Group, Llp | 304.914 | 10.196 | ||||||
| 2025-08-08 | 13F | Thoroughbred Financial Services, Llc | 112.179 | 27,12 | 4 | 50,00 | ||||
| 2025-08-12 | 13F | Franklin Resources Inc | 61.621 | 2.061 | ||||||
| 2025-07-15 | 13F | Colonial River Wealth Management, LLC | 12.173 | 22,00 | 411 | 32,69 | ||||
| 2025-08-13 | 13F | Continuum Advisory, LLC | 24.225 | 23,00 | 810 | 32,79 | ||||
| 2025-07-10 | 13F | Wealth Enhancement Advisory Services, Llc | 1.796.522 | 3,42 | 60.543 | 12,50 | ||||
| 2025-08-08 | 13F | Security Financial Services, INC. | 23.733 | 794 | ||||||
| 2025-07-24 | 13F | MSH Capital Advisors LLC | 0 | -100,00 | 0 | |||||
| 2025-08-12 | 13F | J.w. Cole Advisors, Inc. | 22.544 | 61,09 | 754 | 73,90 | ||||
| 2025-08-14 | 13F | Challenger Wealth Management | 109.258 | -6,08 | 3.654 | 1,39 | ||||
| 2025-07-07 | 13F | Thurston, Springer, Miller, Herd & Titak, Inc. | 9.916 | 110,58 | 332 | 128,28 | ||||
| 2025-07-16 | 13F | Strategic Investment Solutions, Inc. /IL | 2.437 | 0,00 | 81 | 8,00 | ||||
| 2025-07-30 | 13F | Smith Thornton Advisors LLC | 20.073 | 50,45 | 671 | 62,47 | ||||
| 2025-05-15 | 13F | Fft Wealth Management Llc | 0 | -100,00 | 0 | |||||
| 2025-07-09 | 13F | Pines Wealth Management, LLC | 19.984 | 11,18 | 673 | 30,93 | ||||
| 2025-08-15 | 13F | Captrust Financial Advisors | 81.796 | 20,32 | 2.735 | 29,87 | ||||
| 2025-08-26 | 13F | Nautilus Advisors LLC | 33.518 | -27,19 | 1.121 | -21,46 | ||||
| 2025-08-08 | 13F | Cetera Investment Advisers | 1.744.688 | 12,21 | 58.342 | 21,12 | ||||
| 2025-08-06 | 13F | Prospera Financial Services Inc | 87.584 | 42,44 | 2.929 | 53,75 | ||||
| 2025-07-21 | 13F | Ameritas Advisory Services, LLC | 33.764 | -39,72 | 1.129 | -35,26 | ||||
| 2025-08-14 | 13F | Old Mission Capital Llc | 261.722 | 563,04 | 8.752 | 616,12 | ||||
| 2025-08-11 | 13F | TD Waterhouse Canada Inc. | 5.645 | 0,00 | 188 | 7,43 | ||||
| 2025-08-07 | 13F | Allworth Financial LP | 4.666 | 9,12 | 156 | 19,08 | ||||
| 2025-08-12 | 13F | Leigh Baldwin & Co., Llc | 30.925 | 56,34 | 1.034 | 68,95 | ||||
| 2025-07-16 | 13F | Essex Financial Services, Inc. | 85.482 | 48,78 | 2.859 | 60,56 | ||||
| 2025-08-15 | 13F | Equitable Holdings, Inc. | 89.923 | 353,79 | 3.007 | 390,54 | ||||
| 2025-08-13 | 13F | Keystone Financial Group | 9.071 | 21,06 | 303 | 30,60 | ||||
| 2025-05-14 | 13F | Oarsman Capital, Inc. | 0 | -100,00 | 0 | |||||
| 2025-07-22 | 13F | Iron Horse Wealth Management, LLC | 1.000 | 0,00 | 33 | 10,00 | ||||
| 2025-07-28 | 13F | Axxcess Wealth Management, Llc | 12.173 | 22,00 | 407 | 31,72 | ||||
| 2025-04-14 | 13F | Strategic Wealth Designers | 0 | -100,00 | 0 | -100,00 | ||||
| 2025-07-21 | 13F | Warner Financial, Inc | 7.289 | -10,98 | 0 | |||||
| 2025-08-13 | 13F | Capital Group Private Client Services, Inc. | 173.825 | 9,23 | 5.813 | 17,89 | ||||
| 2025-07-30 | 13F | Strategic Blueprint, LLC | 131.834 | 316,20 | 4.409 | 349,34 | ||||
| 2025-08-05 | 13F | Dahring | Cusmano Llc | 49.786 | -6,38 | 1.665 | 1,03 | ||||
| 2025-08-06 | 13F | Mark Sheptoff Financial Planning, Llc | 2.088 | 0,00 | 70 | 7,81 | ||||
| 2025-07-17 | 13F | Janney Montgomery Scott LLC | 310.430 | 69,54 | 10 | 100,00 | ||||
| 2025-07-14 | 13F | Ai Financial Services Llc | 8.179 | 0,00 | 274 | 7,91 | ||||
| 2025-08-14 | 13F | Gerber Kawasaki Wealth & Investment Management | 91.327 | 23,10 | 3.054 | 32,90 | ||||
| 2025-07-31 | 13F | Cambridge Investment Research Advisors, Inc. | 1.636.062 | 5,62 | 55 | 14,89 | ||||
| 2025-08-14 | 13F | Integrated Wealth Concepts LLC | 106.710 | 32,59 | 3.568 | 43,12 | ||||
| 2025-08-13 | 13F | Cary Street Partners Financial Llc | 367.032 | 4.825,94 | 12.274 | 5.236,09 | ||||
| 2025-07-16 | 13F | St Germain D J Co Inc | 652.940 | -7,48 | 21.834 | -0,13 | ||||
| 2025-08-12 | 13F | LPL Financial LLC | 7.448.979 | 35,32 | 249.094 | 46,06 | ||||
| 2025-08-14 | 13F | Modern Wealth Management, LLC | 9.480 | -0,42 | 317 | 7,82 | ||||
| 2025-08-13 | 13F | Smith, Moore & Co. | 153.168 | 23,59 | 5.122 | 33,39 | ||||
| 2025-08-06 | 13F | Founders Financial Securities Llc | 182.165 | 11,98 | 6.092 | 21,31 | ||||
| 2025-08-14 | 13F | Tennessee Valley Asset Management Partners | 0 | -100,00 | 0 | |||||
| 2025-08-14 | 13F | Raymond James Financial Inc | 1.838.766 | 75,56 | 61.488 | 89,50 | ||||
| 2025-07-25 | 13F | Concurrent Investment Advisors, LLC | 355.793 | 78,57 | 11.898 | 92,76 | ||||
| 2025-07-29 | 13F | Stephens Inc /ar/ | 11.695 | 391 | ||||||
| 2025-07-31 | 13F | Buckingham Strategic Partners | 16.144 | 30,73 | 540 | 41,10 | ||||
| 2025-08-14 | 13F | Hilltop Holdings Inc. | 9.750 | 0,00 | 326 | 7,95 | ||||
| 2025-08-14 | 13F | Jane Street Group, Llc | 140.000 | -50,23 | 4.682 | -46,28 | ||||
| 2025-07-16 | 13F | ORG Partners LLC | 27.604 | 4.700,70 | 921 | 5.317,65 | ||||
| 2025-07-16 | 13F | Spinnaker Investment Group, LLC | 12.541 | 419 | ||||||
| 2025-08-11 | 13F | Advisor Resource Council | 6.533 | -96,04 | 218 | -95,73 | ||||
| 2025-05-14 | 13F | Orion Portfolio Solutions, LLC | 8.450 | 0,00 | 264 | 0,00 | ||||
| 2025-07-10 | 13F | Worth Asset Management, LLC | 161.429 | 70,43 | 5.398 | 83,98 | ||||
| 2025-07-11 | 13F | AA Financial Advisors, LLC | 57.599 | -2,21 | 1.926 | 5,59 | ||||
| 2025-07-28 | 13F | SFG Wealth Management, LLC. | 0 | -100,00 | 0 | |||||
| 2025-07-09 | 13F | Massmutual Trust Co Fsb/adv | 11 | 0,00 | 0 | |||||
| 2025-08-14 | 13F | Colony Group, LLC | 7.472 | 250 | ||||||
| 2025-07-24 | 13F | Us Bancorp \de\ | 540 | 0,00 | 18 | 12,50 | ||||
| 2025-09-04 | 13F/A | Advisor Group Holdings, Inc. | 1.432.969 | -12,18 | 47.923 | -5,20 | ||||
| 2025-07-23 | 13F | Seamount Financial Group Inc | 126.907 | 19,54 | 4.244 | 29,05 | ||||
| 2025-08-12 | 13F | Richmond Investment Services, LLC | 24.583 | 91,52 | 822 | 107,05 | ||||
| 2025-04-10 | 13F | Eclectic Associates Inc /adv | 0 | -100,00 | 0 | |||||
| 2025-07-17 | 13F | Venture Visionary Partners LLC | 85.405 | 52,55 | 2.856 | 64,65 | ||||
| 2025-08-04 | 13F | Northwest Financial Advisors | 13.195 | 441 | ||||||
| 2025-08-14 | 13F | Citadel Advisors Llc | 255.847 | 469,08 | 8.556 | 514,58 | ||||
| 2025-07-15 | 13F | tru Independence LLC | 8.370 | 7,85 | 280 | 16,25 | ||||
| 2025-07-15 | 13F | Hartmann Taylor Wealth Management, LLC | 287.133 | -1,53 | 9.602 | 6,29 | ||||
| 2025-05-14 | 13F | Capital Analysts, Inc. | 0 | -100,00 | 0 | |||||
| 2025-07-09 | 13F | Dynamic Advisor Solutions LLC | 8.107 | -3,57 | 271 | 4,23 | ||||
| 2025-05-12 | 13F | WealthPLAN Partners, LLC | 0 | -100,00 | 0 | |||||
| 2025-07-25 | 13F | Apollon Wealth Management, LLC | 57.599 | 1.926 | ||||||
| 2025-08-12 | 13F | Summit Global Investments | 13.015 | 10,13 | 0 | |||||
| 2025-05-15 | 13F | MAI Capital Management | 0 | -100,00 | 0 | |||||
| 2025-07-31 | 13F | Moloney Securities Asset Management, LLC | 28.516 | 9,02 | 954 | 17,65 | ||||
| 2025-08-01 | 13F | Taylor Financial Group, Inc. | 104.370 | 11,05 | 3.490 | 19,89 | ||||
| 2025-08-15 | 13F | Kestra Advisory Services, LLC | 807.188 | 19,99 | 26.992 | 29,51 | ||||
| 2025-07-28 | 13F | Eq Wealth Advisors, Llc | 280 | 0,36 | 9 | 12,50 | ||||
| 2025-08-13 | 13F | VestGen Advisors, LLC | 277.245 | 5,15 | 9.271 | 13,50 | ||||
| 2025-07-14 | 13F | Armstrong Advisory Group, Inc | 0 | -100,00 | 0 | |||||
| 2025-07-31 | 13F | Richards, Merrill & Peterson, Inc. | 0 | -100,00 | 0 | |||||
| 2025-04-30 | 13F | J Hagan Capital, Inc. | 120.264 | 3.761 | ||||||
| 2025-07-02 | 13F | HBW Advisory Services LLC | 18.755 | 134,53 | 627 | 153,85 | ||||
| 2025-08-15 | 13F | Lantern Wealth Advisors, LLC | 18.220 | 609 | ||||||
| 2025-07-25 | 13F | We Are One Seven, LLC | 31.293 | 6,46 | 1.046 | 14,95 | ||||
| 2025-07-17 | 13F | Prepared Retirement Institute LLC | 9.528 | 0,40 | 319 | 8,16 | ||||
| 2025-07-21 | 13F | Ashton Thomas Securities, Llc | 29.780 | 64,43 | 996 | 77,36 | ||||
| 2025-07-25 | 13F | Transcendent Capital Group LLC | 8.592 | -11,01 | 287 | -4,01 | ||||
| 2025-07-25 | 13F | Quantum Financial Planning Services, Inc. | 237.715 | 2.113,77 | 7.949 | 2.294,28 | ||||
| 2025-08-14 | 13F | Evergreen Wealth Solutions, LLC | 6.850 | 229 | ||||||
| 2025-07-17 | 13F | Tempus Wealth Planning, LLC | 134.649 | 2,51 | 4.503 | 10,64 | ||||
| 2025-08-05 | 13F | Claro Advisors LLC | 6.675 | 0,60 | 223 | 8,78 | ||||
| 2025-07-11 | 13F | LongView Wealth Management | 158.837 | 18,21 | 5.312 | 27,61 | ||||
| 2025-08-07 | 13F | Clarity Wealth Advisors, LLC | 106.568 | 19,67 | 3.564 | 29,19 | ||||
| 2025-08-13 | 13F | Renaissance Technologies Llc | 93.100 | 3.113 | ||||||
| 2025-07-17 | 13F | Johnson Bixby & Associates, LLC | 206.975 | -0,59 | 6.921 | 7,30 | ||||
| 2025-08-05 | 13F | Magnolia Capital Advisors Llc | 10.738 | 0,00 | 359 | 8,13 | ||||
| 2025-08-11 | 13F | Rothschild Investment Llc | 7.620 | 0,86 | 255 | 8,55 | ||||
| 2025-07-03 | 13F | Arvest Investments, Inc. | 1.765 | 0,00 | 59 | 9,26 | ||||
| 2025-07-22 | 13F | Beacon Financial Advisory LLC | 39.538 | 25,39 | 1.322 | 35,45 | ||||
| 2025-08-13 | 13F | RIA Advisory Group LLC | 30.785 | 3,83 | 1.029 | 12,09 | ||||
| 2025-07-23 | 13F | Valmark Advisers, Inc. | 64.442 | 35,59 | 2.155 | 46,33 | ||||
| 2025-07-28 | 13F | RFG Advisory, LLC | 82.545 | 76,79 | 2.760 | 90,87 | ||||
| 2025-08-04 | 13F | Spire Wealth Management | 4.845 | -43,87 | 162 | -39,33 | ||||
| 2025-08-07 | 13F | Kestra Private Wealth Services, Llc | 459.776 | 125,94 | 15.375 | 143,88 | ||||
| 2025-07-31 | 13F | Hobart Private Capital, LLC | 6.549 | -1,00 | 219 | 6,86 | ||||
| 2025-08-11 | 13F | HighTower Advisors, LLC | 184.414 | 8,68 | 6.167 | 17,29 | ||||
| 2025-08-01 | 13F | Brookwood Investment Group LLC | 20.367 | -2,61 | 681 | 5,26 | ||||
| 2025-08-11 | 13F | Synergy Investment Management, LLC | 0 | -100,00 | 0 | |||||
| 2025-07-28 | 13F | Harbour Investments, Inc. | 436.456 | 37,28 | 14.595 | 48,19 | ||||
| 2025-08-05 | 13F | Carson Advisory Inc. | 13.075 | 0,00 | 437 | 7,90 | ||||
| 2025-08-07 | 13F | PFG Advisors | 49.998 | 54,59 | 1.672 | 66,93 | ||||
| 2025-08-14 | 13F | Harmony Asset Management Llc | 5.993 | 200 | ||||||
| 2025-08-05 | 13F | Westside Investment Management, Inc. | 108.068 | 8,57 | 3.614 | 17,19 | ||||
| 2025-08-04 | 13F | WNY Asset Management, LLC | 42.077 | -12,17 | 1.407 | -5,19 | ||||
| 2025-08-14 | 13F | Comerica Bank | 56.672 | -9,92 | 1.895 | -2,72 | ||||
| 2025-07-14 | 13F | Golden State Equity Partners | 0 | -100,00 | 0 | |||||
| 2025-08-19 | 13F | Advisory Services Network, LLC | 121.134 | -34,49 | 4.074 | -28,89 | ||||
| 2025-07-14 | 13F | Opal Wealth Advisors, LLC | 1.372 | 106,94 | 46 | 125,00 | ||||
| 2025-08-29 | 13F | Centaurus Financial, Inc. | 93.507 | 28,06 | 3 | 50,00 | ||||
| 2025-08-14 | 13F | Bank Of America Corp /de/ | 1 | 0 | ||||||
| 2025-07-10 | 13F | Sovran Advisors, LLC | 75.663 | 1.024,26 | 2.529 | 1.158,21 | ||||
| 2025-08-01 | 13F | Envestnet Asset Management Inc | 4.140.219 | 31,55 | 138.449 | 42,00 | ||||
| 2025-08-13 | 13F | Capital International Investors | 21.704 | -31,43 | 726 | -26,02 | ||||
| 2025-07-30 | 13F | Bleakley Financial Group, LLC | 94.682 | 52,48 | 3.166 | 64,64 | ||||
| 2025-08-11 | 13F | Nations Financial Group Inc, /ia/ /adv | 15.490 | 101,14 | 518 | 117,65 | ||||
| 2025-09-09 | 13F | NWF Advisory Services Inc. | 18.124 | 1,73 | 606 | 9,98 | ||||
| 2025-08-27 | 13F/A | Brinker Capital Investments, LLC | 6.385 | 214 | ||||||
| 2025-08-04 | 13F | Pensionmark Financial Group, Llc | 132.554 | 25,74 | 4.433 | 35,74 | ||||
| 2025-07-29 | 13F | Creekside Partners | 12.456 | 417 | ||||||
| 2025-08-14 | 13F | Mml Investors Services, Llc | 706.202 | 24,75 | 24 | 35,29 | ||||
| 2025-08-14 | 13F | Smartleaf Asset Management LLC | 336.809 | 13,43 | 11.263 | 22,43 | ||||
| 2025-08-12 | 13F | Global Retirement Partners, LLC | 9.683 | 289,81 | 324 | 319,48 | ||||
| 2025-07-16 | 13F | Owen LaRue, LLC | 22.420 | -48,80 | 750 | -44,76 | ||||
| 2025-07-16 | 13F | Independent Wealth Network Inc. | 25.006 | 18,18 | 836 | 27,63 | ||||
| 2025-07-16 | 13F | Dakota Wealth Management | 23.184 | -6,69 | 779 | 0,78 | ||||
| 2025-08-14 | 13F | Herold Advisors, Inc. | 18.220 | 609 | ||||||
| 2025-08-04 | 13F | Creative Financial Designs Inc /adv | 1.300 | 0,00 | 43 | 7,50 | ||||
| 2025-07-30 | 13F | Cullen/frost Bankers, Inc. | 155.280 | 41,37 | 5.193 | 52,62 | ||||
| 2025-08-04 | 13F | Assetmark, Inc | 22.668 | 758 | ||||||
| 2025-08-01 | 13F | Rossby Financial, LCC | 29 | 1 | ||||||
| 2025-07-17 | 13F | Greenbush Financial Group, LLC | 435.176 | 30,55 | 14.552 | 40,93 | ||||
| 2025-08-05 | 13F | Strategic Financial Concepts, LLC | 9.602 | -23,58 | 321 | -17,48 | ||||
| 2025-08-07 | 13F | Midwest Trust Co | 9.783 | 327 | ||||||
| 2025-07-14 | 13F | AdvisorNet Financial, Inc | 26.163 | 26,27 | 875 | 36,35 | ||||
| 2025-07-29 | 13F | Uhlmann Price Securities, Llc | 16.032 | 18,81 | 536 | 28,23 | ||||
| 2025-07-21 | 13F | Ameriflex Group, Inc. | 0 | -100,00 | 0 | |||||
| 2025-08-06 | 13F | Commonwealth Equity Services, Llc | 1.818.806 | -0,16 | 61 | 7,14 | ||||
| 2025-08-18 | 13F | N.E.W. Advisory Services LLC | 4.287 | -49,80 | 143 | -45,83 | ||||
| 2025-08-14 | 13F | Stifel Financial Corp | 439.413 | 56,41 | 14.694 | 68,84 | ||||
| 2025-07-29 | 13F | Stratos Wealth Partners, LTD. | 83.082 | 237,25 | 2.778 | 264,09 | ||||
| 2025-08-13 | 13F | Rockport Wealth LLC | 0 | -100,00 | 0 | |||||
| 2025-07-23 | 13F | Armstrong, Fleming & Moore, Inc | 15.918 | 532 | ||||||
| 2025-08-14 | 13F | Ausdal Financial Partners, Inc. | 13.665 | 17,62 | 457 | 27,02 | ||||
| 2025-08-14 | 13F | Sunbelt Securities, Inc. | 156.919 | 0,29 | 4.907 | 1,22 | ||||
| 2025-08-18 | 13F | Geneos Wealth Management Inc. | 110.417 | 439,12 | 3.692 | 482,33 | ||||
| 2025-07-09 | 13F | Divergent Planning, LLC | 66.782 | 2.233 | ||||||
| 2025-07-30 | 13F/A | KPP Advisory Services LLC | 17.533 | 0,00 | 586 | 7,92 | ||||
| 2025-05-12 | 13F | Independent Advisor Alliance | 0 | -100,00 | 0 | |||||
| 2025-07-18 | 13F | Truist Financial Corp | 79.312 | 9,60 | 2.652 | 18,34 | ||||
| 2025-08-13 | 13F | Jones Financial Companies Lllp | 644.046 | 103,28 | 21.537 | 119,42 | ||||
| 2025-07-28 | 13F | Mutual Advisors, LLC | 32.788 | -11,04 | 1.113 | -1,85 | ||||
| 2025-08-14 | 13F | Acas, Llc | 127.742 | 9,35 | 4.353 | 19,92 | ||||
| 2025-08-08 | 13F | Davies Financial Advisors, Inc. | 55.223 | -2,11 | 1.847 | 5,67 | ||||
| 2025-08-13 | 13F | Gateway Wealth Partners, LLC | 24.810 | 28,40 | 830 | 38,63 | ||||
| 2025-08-13 | 13F | Vermillion & White Wealth Management Group, LLC | 8.120 | 4,09 | 272 | 12,45 | ||||
| 2025-08-14 | 13F | Advisor OS, LLC | 19.521 | 1,50 | 653 | 9,58 | ||||
| 2025-07-22 | 13F | Confluence Wealth Services, Inc. | 271.820 | 3,49 | 9.090 | 14,30 | ||||
| 2025-07-25 | 13F | Envestnet Portfolio Solutions, Inc. | 85.501 | -54,70 | 2.859 | -51,10 | ||||
| 2025-08-06 | 13F | Mascagni Wealth Management, Inc. | 67.080 | -12,85 | 2.243 | -5,91 | ||||
| 2025-07-30 | 13F | D.a. Davidson & Co. | 263.062 | 11,33 | 8.797 | 20,16 | ||||
| 2025-07-24 | 13F | Endeavor Private Wealth, Inc. | 183.381 | 24,83 | 6.162 | 34,87 | ||||
| 2025-07-09 | 13F | StrongBox Wealth, LLC | 66.782 | 4,39 | 2.233 | 12,72 | ||||
| 2025-08-04 | 13F | Savvy Advisors, Inc. | 6.069 | 203 | ||||||
| 2025-08-14 | 13F | Mariner, LLC | 560.777 | 6,75 | 18.752 | 15,22 | ||||
| 2025-07-29 | 13F | Nicholson Wealth Management Group, LLC | 6.392 | 214 | ||||||
| 2025-08-05 | 13F | Sigma Planning Corp | 100.967 | 35,03 | 3.376 | 45,77 | ||||
| 2025-08-13 | 13F | Fi3 FINANCIAL ADVISORS, LLC | 7.351 | 247 | ||||||
| 2025-08-13 | 13F | Northwestern Mutual Wealth Management Co | 22.545 | 194,24 | 754 | 217,72 | ||||
| 2025-07-18 | 13F | Vicus Capital | 16.578 | 61,47 | 554 | 74,21 | ||||
| 2025-08-05 | 13F | GPS Wealth Strategies Group, LLC | 49.010 | 26,71 | 1.639 | 36,73 | ||||
| 2025-08-08 | 13F | Capital Investment Advisory Services, LLC | 9.176 | 20,72 | 307 | 30,21 | ||||
| 2025-08-08 | 13F | Avantax Advisory Services, Inc. | 58.702 | 38,02 | 1.963 | 48,97 | ||||
| 2025-07-30 | 13F | Onyx Bridge Wealth Group LLC | 6.280 | 210 | ||||||
| 2025-08-07 | 13F | PCG Wealth Advisors, LLC | 0 | -100,00 | 0 | |||||
| 2025-08-12 | 13F | Wisconsin Wealth Advisors, LLC | 7.955 | 266 |