Grundlæggende statistik
| Institutionelle ejere | 167 total, 164 long only, 0 short only, 3 long/short - change of 23,70% MRQ |
| Gennemsnitlig porteføljeallokering | 0.1421 % - change of 7,53% MRQ |
| Institutionelle aktier (lange) | 28.671.717 (ex 13D/G) - change of 8,72MM shares 43,69% MRQ |
| Institutionel værdi (lang) | $ 346.216 USD ($1000) |
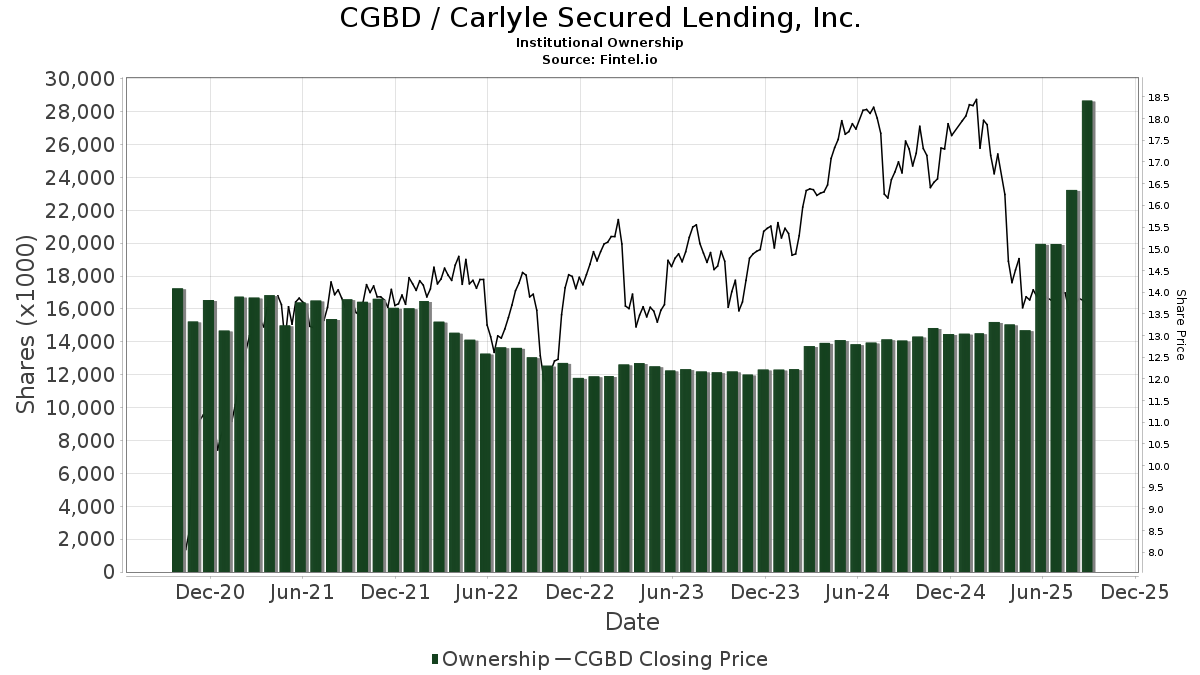
Institutionelt ejerskab og aktionærer
Carlyle Secured Lending, Inc. (US:CGBD) har 167 institutionelle ejere og aktionærer, der har indsendt 13D/G- eller 13F-formularer til Securities Exchange Commission (SEC). Disse institutioner har i alt 28,671,717 aktier. Største aktionærer omfatter Creative Planning, Morgan Stanley, Prime Capital Investment Advisors, LLC, Van Eck Associates Corp, BIZD - VanEck Vectors BDC Income ETF, Rsm Us Wealth Management Llc, Lsv Asset Management, Bank Of America Corp /de/, Invesco Ltd., and KBWD - Invesco KBW High Dividend Yield Financial ETF .
Carlyle Secured Lending, Inc. (NasdaqGS:CGBD) institutionel ejerskabsstruktur viser aktuelle positioner i virksomheden efter institutioner og fonde, samt seneste ændringer i positionsstørrelse. Større aktionærer kan omfatte individuelle investorer, investeringsforeninger, hedgefonde eller institutioner. Skema 13D angiver, at investoren besidder (eller besidder) mere end 5 % af virksomheden og har til hensigt (eller har til hensigt at) aktivt at forfølge en ændring i forretningsstrategi. Skema 13G indikerer en passiv investering på over 5%.
The share price as of September 15, 2025 is 13,36 / share. Previously, on September 16, 2024, the share price was 17,57 / share. This represents a decline of 23,96% over that period.
Fondens stemningsscore
Fund Sentiment Score (fka Ownership Accumulation Score) finder de aktier, der bliver mest købt af fonde. Det er resultatet af en sofistikeret, multi-faktor kvantitativ model, der identificerer virksomheder med de højeste niveauer af institutionel akkumulering. Scoringsmodellen bruger en kombination af den samlede stigning i oplyste ejere, ændringerne i porteføljeallokeringer i disse ejere og andre målinger. Tallet går fra 0 til 100, hvor højere tal indikerer et højere niveau af akkumulering for sine jævnaldrende, og 50 er gennemsnittet.
Opdateringsfrekvens: Dagligt
Se Ownership Explorer, som giver en liste over højest rangerende virksomheder.
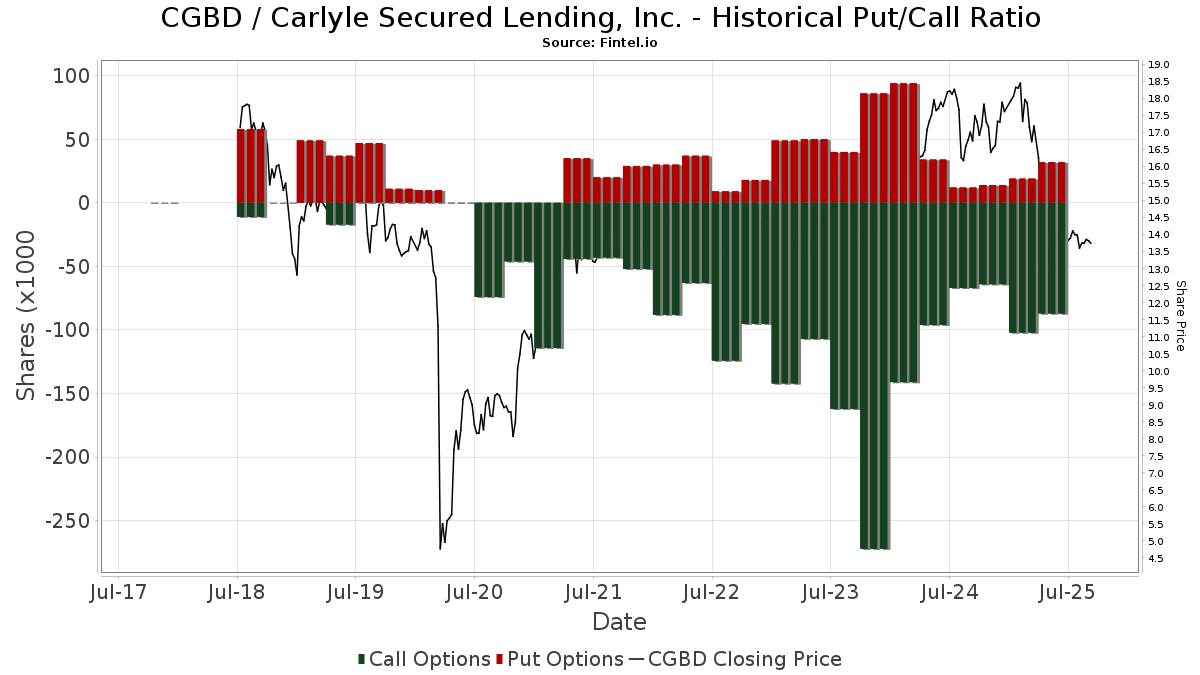
Institutionel Put/Call-forhold
Ud over at indberette standardaktie- og gældsudstedelser skal institutter med mere end 100 mill. aktiver under forvaltning også oplyse deres put- og call-optionsbeholdninger. Da salgsoptioner generelt indikerer negativ stemning, og købsoptioner indikerer positiv stemning, kan vi få en fornemmelse af den overordnede institutionelle stemning ved at plotte forholdet mellem put og kald. Diagrammet til højre viser det historiske put/call-forhold for dette instrument.
Brug af Put/Call Ratio som en indikator for investorernes stemning overvinder en af de vigtigste mangler ved at bruge totalt institutionelt ejerskab, som er, at en betydelig mængde af aktiver under forvaltning investeres passivt for at spore indekser. Passivt forvaltede fonde køber typisk ikke optioner, så indikatoren for put/call-forholdet følger mere nøje følelsen af aktivt forvaltede fonde.
13F og NPORT arkivering
Detaljer om 13F-arkivering er gratis. Detaljer om NP-ansøgninger kræver et premium-medlemskab. Grønne rækker angiver nye positioner. Røde rækker angiver lukkede positioner. Klik på linket ikon for at se den fulde transaktionshistorik.
Opgrader
for at låse premium-data op og eksportere til Excel ![]() .
.
| Fil dato | Kilde | Investor | Type | Gennemsnitlig pris (Øst) |
Aktier | Δ Aktier (%) |
Rapporteret Værdi ($1000) |
Δ Værdi (%) |
Port Alloc (%) |
|
|---|---|---|---|---|---|---|---|---|---|---|
| 2025-08-14 | 13F | Brevan Howard Capital Management LP | 10.592 | 145 | ||||||
| 2025-08-06 | 13F | Smh Capital Advisors Inc | 21.925 | 300 | ||||||
| 2025-05-14 | 13F | Virtus ETF Advisers LLC | 0 | -100,00 | 0 | |||||
| 2025-07-08 | 13F | Nbc Securities, Inc. | 400 | 0,00 | 0 | |||||
| 2025-08-11 | 13F | United Advisor Group, LLC | 26.115 | 9,18 | 357 | -7,75 | ||||
| 2025-08-12 | 13F | Pathstone Holdings, LLC | 76.065 | 2,19 | 1.041 | -13,62 | ||||
| 2025-08-11 | 13F | Heritage Wealth Advisors | 2.100 | 0,00 | 29 | -15,15 | ||||
| 2025-08-14 | 13F | Sunbelt Securities, Inc. | 8.797 | -14,57 | 158 | -5,42 | ||||
| 2025-07-17 | 13F | Janney Montgomery Scott LLC | 35.804 | -0,78 | 0 | |||||
| 2025-07-25 | 13F | GFS Advisors, LLC | 49.700 | 680 | ||||||
| 2025-08-13 | 13F | Cerity Partners LLC | 10.698 | 1,84 | 146 | -13,61 | ||||
| 2025-07-09 | 13F | Triumph Capital Management | 49.845 | 19,73 | 682 | 1,19 | ||||
| 2025-08-15 | 13F | Tower Research Capital LLC (TRC) | 4.313 | 1.011,60 | 59 | 883,33 | ||||
| 2025-08-06 | 13F | Round Rock Advisors, LLC | 46.562 | 1,66 | 637 | -14,17 | ||||
| 2025-06-10 | 13F | Birchbrook, Inc. | 0 | -100,00 | 0 | -100,00 | ||||
| 2025-08-12 | 13F | Jpmorgan Chase & Co | 22.216 | -31,70 | 304 | -42,40 | ||||
| 2025-08-14 | 13F | Tudor Investment Corp Et Al | 219.146 | 376,09 | 2.998 | 302,82 | ||||
| 2025-05-14 | 13F | Group One Trading, L.p. | 0 | -100,00 | 0 | -100,00 | ||||
| 2025-08-14 | 13F | Macquarie Group Ltd | 12.900 | -80,03 | 176 | -83,16 | ||||
| 2025-07-10 | 13F | Wealth Enhancement Advisory Services, Llc | 15.341 | -19,89 | 214 | -34,26 | ||||
| 2025-07-31 | 13F | Caitong International Asset Management Co., Ltd | 227 | 440,48 | 3 | |||||
| 2025-08-04 | 13F | Muzinich & Co., Inc. | 352.617 | 81,09 | 4.824 | 53,11 | ||||
| 2025-07-30 | 13F | Denali Advisors Llc | 132.433 | -2,65 | 1.812 | -17,72 | ||||
| 2025-07-23 | 13F | Prime Capital Investment Advisors, LLC | 2.204.508 | 30.158 | ||||||
| 2025-08-08 | 13F | Creative Planning | 4.916.335 | 0,90 | 67.255 | -14,69 | ||||
| 2025-08-15 | 13F | WealthCollab, LLC | 0 | -100,00 | 0 | |||||
| 2025-08-13 | 13F | Advisory Research Inc | 10.387 | 142 | ||||||
| 2025-08-14 | 13F | Group One Trading, L.p. | Put | 2.200 | 120,00 | 30 | 87,50 | |||
| 2025-08-14 | 13F | Group One Trading, L.p. | Call | 18.700 | 46,09 | 256 | 23,19 | |||
| 2025-08-14 | 13F | Ieq Capital, Llc | 45.745 | 26,54 | 626 | 7,02 | ||||
| 2025-08-28 | NP | Cliffwater Corporate Lending Fund | 548.617 | 7.505 | ||||||
| 2025-08-14 | 13F | UBS Group AG | 567.546 | 37,89 | 7.764 | 16,59 | ||||
| 2025-08-14 | 13F | Keebeck Wealth Management, LLC | 31.000 | 0,00 | 436 | -12,97 | ||||
| 2025-07-17 | 13F | Patton Albertson Miller Group, Llc | 25.114 | 344 | ||||||
| 2025-07-18 | 13F | Trust Co Of Vermont | 1.080 | 0,00 | 15 | -17,65 | ||||
| 2025-07-10 | 13F | Redhawk Wealth Advisors, Inc. | 0 | -100,00 | 0 | |||||
| 2025-08-05 | 13F | Simplex Trading, Llc | 1.199 | 184,80 | 0 | |||||
| 2025-08-05 | 13F | Simplex Trading, Llc | Call | 7.300 | -26,26 | 0 | ||||
| 2025-07-29 | 13F | International Assets Investment Management, Llc | 18.125 | 0,00 | 248 | -15,70 | ||||
| 2025-08-05 | 13F | Simplex Trading, Llc | Put | 6.000 | 25,00 | 0 | ||||
| 2025-08-28 | NP | TRIFX - Catalyst/SMH Total Return Income Fund Class A | 7.087 | 97 | ||||||
| 2025-08-14 | 13F | Ameriprise Financial Inc | 190.921 | 2,48 | 2.612 | -13,37 | ||||
| 2025-05-02 | 13F | BluePointe Capital Management, LLC | 61.517 | 4,86 | 1.024 | -5,01 | ||||
| 2025-07-28 | 13F | Naviter Wealth, LLC | 90.991 | 1.277 | ||||||
| 2025-07-14 | 13F | Gries Financial Llc | 197.240 | 0,00 | 2.698 | -15,45 | ||||
| 2025-08-11 | 13F | FineMark National Bank & Trust | 40.381 | -2,99 | 552 | -17,98 | ||||
| 2025-04-22 | 13F | Bright Futures Wealth Management, LLC. | 57.064 | -6,92 | 805 | -28,28 | ||||
| 2025-08-13 | 13F | Mackenzie Financial Corp | 25.898 | 3,22 | 354 | -12,59 | ||||
| 2025-07-11 | 13F | Kingstone Capital Partners Texas, LLC | 410.472 | 6 | ||||||
| 2025-08-18 | 13F/A | National Bank Of Canada /fi/ | 12.424 | 3.608,66 | 170 | 3.280,00 | ||||
| 2025-08-13 | 13F | PharVision Advisers, LLC | 14.041 | 192 | ||||||
| 2025-08-14 | 13F | GWM Advisors LLC | 161 | 0,00 | 2 | 0,00 | ||||
| 2025-08-14 | 13F | Great Valley Advisor Group, Inc. | 11.100 | -4,84 | 152 | -19,68 | ||||
| 2025-08-12 | 13F | Proequities, Inc. | Put | 0 | 0 | |||||
| 2025-08-12 | 13F | Proequities, Inc. | Call | 0 | 0 | |||||
| 2025-08-12 | 13F | Proequities, Inc. | 0 | 0 | ||||||
| 2025-08-13 | 13F | Quantbot Technologies LP | 10.664 | 146 | ||||||
| 2025-08-13 | 13F | Virtus Investment Advisers, Inc. | 63.217 | 21,59 | 865 | 2,73 | ||||
| 2025-05-15 | 13F | Talon Private Wealth, LLC | 0 | -100,00 | 0 | -100,00 | ||||
| 2025-08-07 | 13F | Acadian Asset Management Llc | 11 | 0,00 | 0 | |||||
| 2025-08-11 | 13F | Lsv Asset Management | 860.563 | -31,49 | 12 | -45,00 | ||||
| 2025-08-14 | 13F | BI Asset Management Fondsmaeglerselskab A/S | 219.176 | 9.270,50 | 3 | |||||
| 2025-08-12 | 13F | Virtu Financial LLC | 33.023 | 74,11 | 0 | |||||
| 2025-07-24 | 13F | Us Bancorp \de\ | 50.000 | 0,00 | 684 | -15,45 | ||||
| 2025-08-14 | 13F | Goldman Sachs Group Inc | 22.529 | 308 | ||||||
| 2025-08-13 | 13F | Jump Financial, LLC | 13.100 | 179 | ||||||
| 2025-08-13 | 13F | Fisher Asset Management, LLC | 22.461 | 0,89 | 307 | -14,72 | ||||
| 2025-08-04 | 13F | Arkadios Wealth Advisors | 32.410 | 0,00 | 443 | -15,46 | ||||
| 2025-08-05 | 13F | Dunhill Financial, LLC | 498 | 0,00 | 7 | -25,00 | ||||
| 2025-08-08 | 13F | Cetera Investment Advisers | 67.124 | 15,34 | 918 | -2,44 | ||||
| 2025-04-29 | 13F | Raleigh Capital Management Inc. | 0 | -100,00 | 0 | |||||
| 2025-08-13 | 13F | ExodusPoint Capital Management, LP | 0 | -100,00 | 0 | |||||
| 2025-08-14 | 13F | Aquatic Capital Management LLC | 34.407 | 33,84 | 471 | 13,25 | ||||
| 2025-08-12 | 13F | Putnam Fl Investment Management Co | 34.483 | 472 | ||||||
| 2025-08-14 | 13F | Royal Bank Of Canada | 266.213 | -3,41 | 3.642 | -18,34 | ||||
| 2025-08-12 | 13F | SRS Capital Advisors, Inc. | 716 | 0,00 | 10 | -18,18 | ||||
| 2025-05-30 | NP | SMVIX - Simt Small Cap Value Fund Class I | 17.503 | -8,56 | 283 | -17,49 | ||||
| 2025-08-27 | NP | OASVX - Optimum Small-mid Cap Value Fund Class A | 13.100 | -79,72 | 179 | -82,87 | ||||
| 2025-08-14 | 13F | MGB Wealth Management, LLC | 0 | -100,00 | 0 | |||||
| 2025-08-14 | 13F | Van Eck Associates Corp | 1.785.996 | 48,36 | 24 | 26,32 | ||||
| 2025-07-21 | 13F | Ameritas Advisory Services, LLC | 750 | 10 | ||||||
| 2025-08-13 | 13F | Cliffwater LLC | 548.617 | 7.505 | ||||||
| 2025-08-13 | 13F | Quadrature Capital Ltd | 0 | -100,00 | 0 | |||||
| 2025-08-14 | 13F | Summit Trail Advisors, Llc | 146.027 | 2.056 | ||||||
| 2025-08-14 | 13F | Mariner, LLC | 543.376 | 7.433 | ||||||
| 2025-07-23 | 13F | Hager Investment Management Services, Llc | 236.263 | 4,46 | 3.232 | -11,67 | ||||
| 2025-08-14 | 13F | Raymond James Financial Inc | 177.462 | -3,63 | 2.428 | -18,53 | ||||
| 2025-08-14 | 13F | Stifel Financial Corp | 30.820 | -32,36 | 422 | -42,88 | ||||
| 2025-07-25 | 13F | Cwm, Llc | 6.836 | 0,50 | 0 | |||||
| 2025-08-14 | 13F | Rivernorth Capital Management, Llc | 357.013 | 4.884 | ||||||
| 2025-05-12 | 13F | Eagle Global Advisors Llc | 0 | -100,00 | 0 | |||||
| 2025-08-13 | 13F | Northern Trust Corp | 19.401 | 265 | ||||||
| 2025-08-15 | 13F | Caxton Associates Llp | 29.445 | 0,00 | 403 | -15,55 | ||||
| 2025-07-28 | NP | KBWD - Invesco KBW High Dividend Yield Financial ETF This fund is a listed as child fund of Invesco Ltd. and if that institution has disclosed ownership in this security, then these positions will not be double counted when calculating total shares and total value | 615.591 | -1,86 | 8.649 | -22,40 | ||||
| 2025-08-11 | 13F | Citigroup Inc | 577 | -92,10 | 8 | -94,07 | ||||
| 2025-08-12 | 13F | XTX Topco Ltd | 0 | -100,00 | 0 | |||||
| 2025-04-02 | 13F | Marcum Wealth, LLC | 11.314 | 0,00 | 183 | -9,41 | ||||
| 2025-07-23 | 13F | Eagle Strategies LLC | 14.863 | 203 | ||||||
| 2025-08-12 | 13F | LPL Financial LLC | 90.409 | 9,64 | 1.237 | -7,35 | ||||
| 2025-08-14 | 13F | Bnp Paribas Arbitrage, Sa | 12.650 | 173 | ||||||
| 2025-08-12 | 13F | Aigen Investment Management, Lp | 14.436 | 197 | ||||||
| 2025-03-28 | NP | DVDN - Kingsbarn Dividend Opportunity ETF | 0 | -100,00 | 0 | -100,00 | ||||
| 2025-07-14 | 13F | Toth Financial Advisory Corp | 0 | -100,00 | 0 | |||||
| 2025-08-14 | 13F | Wells Fargo & Company/mn | 34.053 | -0,69 | 466 | -16,06 | ||||
| 2025-07-11 | 13F | Farther Finance Advisors, LLC | 1.050 | 14 | ||||||
| 2025-08-08 | 13F | Condor Capital Management | 175.506 | -36,27 | 2.401 | -46,14 | ||||
| 2025-06-26 | NP | LSVQX - LSV Small Cap Value Fund Institutional Class Shares | 95.900 | 6,20 | 1.416 | -15,46 | ||||
| 2025-06-26 | NP | LSVGX - LSV Global Value Fund Institutional Class Shares | 17.200 | 0,00 | 254 | -20,38 | ||||
| 2025-05-06 | 13F | Kovack Advisors, Inc. | 0 | -100,00 | 0 | |||||
| 2025-07-18 | 13F | Truist Financial Corp | 64.957 | 0,00 | 889 | -15,51 | ||||
| 2025-07-31 | 13F | Cambridge Investment Research Advisors, Inc. | 15.391 | 0,27 | 0 | |||||
| 2025-08-12 | 13F | Legal & General Group Plc | 459.870 | 38,44 | 6.291 | 17,13 | ||||
| 2025-07-29 | 13F | Novare Capital Management Llc | 194.680 | 10,64 | 2.663 | -6,43 | ||||
| 2025-08-07 | 13F | Cascade Financial Partners, LLC | 43.840 | 600 | ||||||
| 2025-07-14 | 13F | U.S. Capital Wealth Advisors, LLC | 13.850 | 34,34 | 189 | 13,86 | ||||
| 2025-07-25 | 13F | 1858 Wealth Management, Llc | 41.343 | 566 | ||||||
| 2025-08-07 | 13F | Allworth Financial LP | 2.528 | 0,00 | 35 | -5,56 | ||||
| 2025-08-14 | 13F | Oxford Asset Management Llp | 37.198 | 509 | ||||||
| 2025-08-06 | 13F | Savant Capital, LLC | 18.874 | 3,15 | 258 | -12,84 | ||||
| 2025-07-31 | 13F | Sumitomo Mitsui Trust Holdings, Inc. | 264.138 | 44,02 | 3.613 | 21,77 | ||||
| 2025-07-31 | 13F/A | Avion Wealth | 500 | 0,00 | 0 | |||||
| 2025-04-11 | 13F | Herbst Group, Llc | 0 | -100,00 | 0 | |||||
| 2025-07-17 | 13F | HB Wealth Management, LLC | 11.790 | 0,00 | 161 | -15,26 | ||||
| 2025-08-14 | 13F | Two Sigma Advisers, Lp | 334.700 | -35,24 | 4.579 | -45,25 | ||||
| 2025-08-13 | 13F | Rsm Us Wealth Management Llc | 1.458.028 | 20.529 | ||||||
| 2025-08-12 | 13F | MAI Capital Management | 20.797 | 285 | ||||||
| 2025-07-14 | 13F | AdvisorNet Financial, Inc | 11.163 | -57,17 | 153 | -63,90 | ||||
| 2025-08-07 | 13F | Hennion & Walsh Asset Management, Inc. | 116.342 | -0,25 | 1.592 | -15,69 | ||||
| 2025-08-14 | 13F | Quarry LP | 4.636 | 130,99 | 63 | 96,88 | ||||
| 2025-08-01 | 13F | Y-Intercept (Hong Kong) Ltd | 180.466 | 2.469 | ||||||
| 2025-08-04 | 13F | Canton Hathaway, LLC | 0 | -100,00 | 0 | |||||
| 2025-07-31 | 13F | MQS Management LLC | 38.917 | 532 | ||||||
| 2025-07-02 | 13F | Doliver Advisors, Lp | 122.581 | 1.677 | ||||||
| 2025-08-12 | 13F | BlackRock, Inc. | 264.185 | 33,88 | 3.614 | 13,22 | ||||
| 2025-06-27 | NP | LBO - WHITEWOLF Publicly Listed Private Equity ETF | 5.481 | 14,26 | 81 | -10,11 | ||||
| 2025-07-23 | 13F | PARK CIRCLE Co | 71.225 | 0,00 | 974 | -15,45 | ||||
| 2025-08-12 | 13F | Magnetar Financial LLC | 34.727 | 475 | ||||||
| 2025-08-11 | 13F | Greenland Capital Management LP | 0 | -100,00 | 0 | |||||
| 2025-08-14 | 13F | Mercer Global Advisors Inc /adv | 17.890 | 245 | ||||||
| 2025-08-13 | 13F | Lido Advisors, LLC | 52.234 | 735 | ||||||
| 2025-08-14 | 13F | Susquehanna International Group, Llp | Call | 10.700 | -75,40 | 146 | -79,23 | |||
| 2025-08-18 | 13F | Wolverine Trading, Llc | Call | 0 | -100,00 | 0 | ||||
| 2025-05-15 | 13F | Parvin Asset Management, LLC | 0 | -100,00 | 0 | |||||
| 2025-08-14 | 13F | Susquehanna International Group, Llp | 50.389 | 689 | ||||||
| 2025-07-29 | 13F | Arista Wealth Management, LLC | 17.573 | 240 | ||||||
| 2025-07-15 | 13F | Clarus Group, Inc. | 21.291 | 0,00 | 291 | -15,41 | ||||
| 2025-07-25 | 13F | Apollon Wealth Management, LLC | 32.590 | 36,46 | 446 | 15,28 | ||||
| 2025-08-11 | 13F | HighTower Advisors, LLC | 70.945 | 0,77 | 971 | -14,84 | ||||
| 2025-07-29 | 13F | Activest Wealth Management | 8.125 | -40,80 | 111 | -50,00 | ||||
| 2025-08-11 | 13F | EMC Capital Management | 6.521 | -49,92 | 0 | |||||
| 2025-07-21 | 13F | Catalina Capital Group, LLC | 19.239 | 263 | ||||||
| 2025-08-14 | 13F | Qube Research & Technologies Ltd | 152.607 | 376,17 | 2.088 | 302,90 | ||||
| 2025-08-12 | 13F | Trexquant Investment LP | 0 | -100,00 | 0 | |||||
| 2025-08-01 | 13F | Transcend Wealth Collective, Llc | 25.015 | 342 | ||||||
| 2025-08-12 | 13F | YANKCOM Partnership | 64 | 0,00 | 1 | -100,00 | ||||
| 2025-04-17 | 13F | Grimes & Company, Inc. | 0 | -100,00 | 0 | -100,00 | ||||
| 2025-08-04 | 13F | Assetmark, Inc | 0 | -100,00 | 0 | |||||
| 2025-08-14 | 13F | Two Sigma Investments, Lp | 242.989 | -29,73 | 3.324 | -40,59 | ||||
| 2025-08-13 | 13F | Invesco Ltd. | 779.586 | 18,50 | 10.665 | 0,19 | ||||
| 2025-08-21 | NP | BIZD - VanEck Vectors BDC Income ETF | 1.651.647 | 47,15 | 22.595 | 24,42 | ||||
| 2025-08-12 | 13F | Steward Partners Investment Advisory, Llc | 32.249 | 71,99 | 441 | 45,54 | ||||
| 2025-08-14 | 13F | AllSquare Wealth Management LLC | 1.400 | 0,00 | 19 | -13,64 | ||||
| 2025-07-17 | 13F | Sound Income Strategies, LLC | 1.191 | 0,00 | 16 | -15,79 | ||||
| 2025-08-12 | 13F | Dynamic Technology Lab Private Ltd | 37.061 | 507 | ||||||
| 2025-08-15 | 13F | Morgan Stanley | 2.295.522 | -2,29 | 31.403 | -17,38 | ||||
| 2025-08-13 | 13F | Northwestern Mutual Wealth Management Co | 2.630 | 71,90 | 36 | 45,83 | ||||
| 2025-05-15 | 13F | Glenmede Trust Co Na | 32.175 | -7,62 | 521 | -16,67 | ||||
| 2025-08-29 | 13F | Total Investment Management Inc | 1 | 0 | ||||||
| 2025-09-04 | 13F/A | Advisor Group Holdings, Inc. | 54.125 | -11,47 | 741 | -25,18 | ||||
| 2025-08-11 | 13F | Universal- Beteiligungs- und Servicegesellschaft mbH | 102.650 | -21,34 | 1.404 | -33,49 | ||||
| 2025-07-31 | 13F | Whipplewood Advisors, LLC | 34.802 | 476 | ||||||
| 2025-08-06 | 13F | Commonwealth Equity Services, Llc | 34.003 | 9,31 | 0 | |||||
| 2025-08-14 | 13F | Comerica Bank | 88.367 | 0,00 | 1.209 | -15,47 | ||||
| 2025-06-25 | NP | VPC - Virtus Private Credit Strategy ETF | 47.489 | -10,15 | 701 | -28,54 | ||||
| 2025-08-28 | NP | AOG Institutional Diversified Fund | 34.483 | 472 | ||||||
| 2025-05-13 | 13F | Aptus Capital Advisors, LLC | 0 | -100,00 | 0 | |||||
| 2025-08-28 | NP | RNCOX - RiverNorth Core Opportunity Fund Class R | 17.446 | 239 | ||||||
| 2025-08-13 | 13F | Truvestments Capital Llc | 487 | 0,00 | 7 | -14,29 | ||||
| 2025-08-12 | 13F | Global Retirement Partners, LLC | 81.453 | 62,60 | 1.114 | 24,05 | ||||
| 2025-07-01 | 13F | Harbor Investment Advisory, Llc | 450 | -89,31 | 6 | -91,18 | ||||
| 2025-08-14 | 13F | Glenmede Investment Management, LP | 32.175 | 440 | ||||||
| 2025-08-14 | 13F | Bank Of America Corp /de/ | 795.522 | -25,08 | 10.883 | -36,66 | ||||
| 2025-08-07 | 13F | Connor, Clark & Lunn Investment Management Ltd. | 0 | -100,00 | 0 | |||||
| 2025-08-28 | NP | Rivernorth Opportunities Fund, Inc. | 126.873 | 1.736 | ||||||
| 2025-08-14 | 13F/A | Rockefeller Capital Management L.P. | 68.681 | 43,17 | 940 | 21,01 | ||||
| 2025-08-15 | 13F | Great West Life Assurance Co /can/ | 45.932 | 4,65 | 1 | |||||
| 2025-08-06 | 13F | Ethos Financial Group, LLC | 174.172 | 1,34 | 2.383 | -14,32 | ||||
| 2025-08-15 | 13F | CI Private Wealth, LLC | 167.300 | 2.289 | ||||||
| 2025-08-12 | 13F | Advisors Asset Management, Inc. | 223.857 | -9,86 | 3.062 | -23,79 | ||||
| 2025-08-06 | 13F | Financial Alternatives, Inc | 17.591 | 0,00 | 241 | -15,49 | ||||
| 2025-08-14 | 13F | Harwood Advisory Group, LLC | 0 | -100,00 | 0 | -100,00 | ||||
| 2025-08-15 | 13F | Northeast Financial Consultants Inc | 102.219 | 139,00 | 1.398 | 102,02 | ||||
| 2025-08-13 | 13F | Jones Financial Companies Lllp | 180 | 3 | ||||||
| 2025-08-14 | 13F | Citadel Advisors Llc | Call | 50.800 | 98,44 | 695 | 67,63 | |||
| 2025-08-14 | 13F | Citadel Advisors Llc | 41.015 | -76,64 | 561 | -80,25 | ||||
| 2025-08-14 | 13F | Citadel Advisors Llc | Put | 24.300 | 80,00 | 332 | 52,29 | |||
| 2025-08-28 | NP | RNDLX - RiverNorth/DoubleLine Strategic Income Fund Class R | 172.931 | 2.366 | ||||||
| 2025-07-18 | 13F | Chelsea Counsel Co | 340 | 0,00 | 5 | -20,00 | ||||
| 2025-08-01 | 13F | Envestnet Asset Management Inc | 67.308 | 9,07 | 921 | -7,82 | ||||
| 2025-07-31 | 13F | Catalyst Capital Advisors LLC | 7.087 | 97 | ||||||
| 2025-08-13 | 13F | SCS Capital Management LLC | 11.314 | 0,00 | 159 | -15,43 | ||||
| 2025-07-25 | 13F | Verdence Capital Advisors LLC | 40.413 | -1,35 | 553 | -16,62 |