Grundlæggende statistik
| Institutionelle ejere | 199 total, 195 long only, 2 short only, 2 long/short - change of 2,05% MRQ |
| Gennemsnitlig porteføljeallokering | 0.1591 % - change of -26,76% MRQ |
| Institutionelle aktier (lange) | 31.469.947 (ex 13D/G) - change of -4,24MM shares -11,86% MRQ |
| Institutionel værdi (lang) | $ 323.839 USD ($1000) |
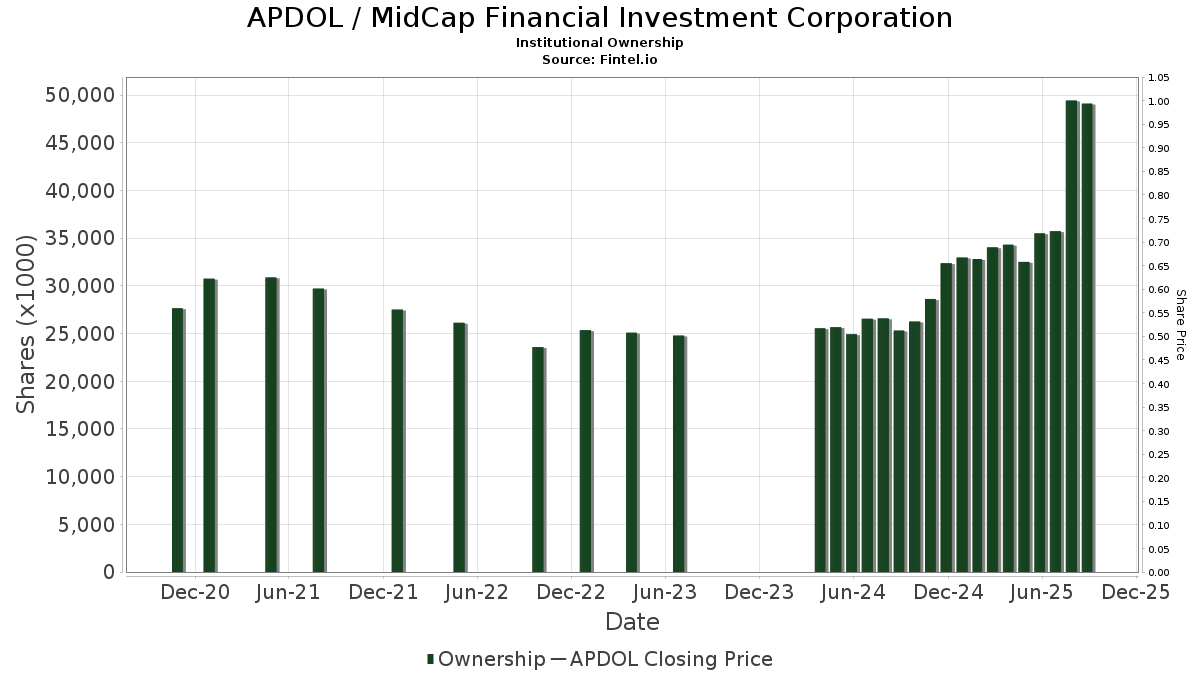
Institutionelt ejerskab og aktionærer
MidCap Financial Investment Corporation (US:APDOL) har 199 institutionelle ejere og aktionærer, der har indsendt 13D/G- eller 13F-formularer til Securities Exchange Commission (SEC). Disse institutioner har i alt 31,469,947 aktier. Største aktionærer omfatter Thornburg Investment Management Inc, Apollo Management Holdings, L.P., Van Eck Associates Corp, UBS Group AG, Morgan Stanley, Next Capital Management LLC, Diameter Capital Partners LP, Invesco Ltd., Muzinich & Co., Inc., and Legal & General Group Plc .
MidCap Financial Investment Corporation (OTCPK:APDOL) institutionel ejerskabsstruktur viser aktuelle positioner i virksomheden efter institutioner og fonde, samt seneste ændringer i positionsstørrelse. Større aktionærer kan omfatte individuelle investorer, investeringsforeninger, hedgefonde eller institutioner. Skema 13D angiver, at investoren besidder (eller besidder) mere end 5 % af virksomheden og har til hensigt (eller har til hensigt at) aktivt at forfølge en ændring i forretningsstrategi. Skema 13G indikerer en passiv investering på over 5%.
Fondens stemningsscore
Fund Sentiment Score (fka Ownership Accumulation Score) finder de aktier, der bliver mest købt af fonde. Det er resultatet af en sofistikeret, multi-faktor kvantitativ model, der identificerer virksomheder med de højeste niveauer af institutionel akkumulering. Scoringsmodellen bruger en kombination af den samlede stigning i oplyste ejere, ændringerne i porteføljeallokeringer i disse ejere og andre målinger. Tallet går fra 0 til 100, hvor højere tal indikerer et højere niveau af akkumulering for sine jævnaldrende, og 50 er gennemsnittet.
Opdateringsfrekvens: Dagligt
Se Ownership Explorer, som giver en liste over højest rangerende virksomheder.
AI+ Ask Fintel’s AI assistant about MidCap Financial Investment Corporation.
Select a question to share a public post with an AI-crafted answer.
Thinking of good questions…
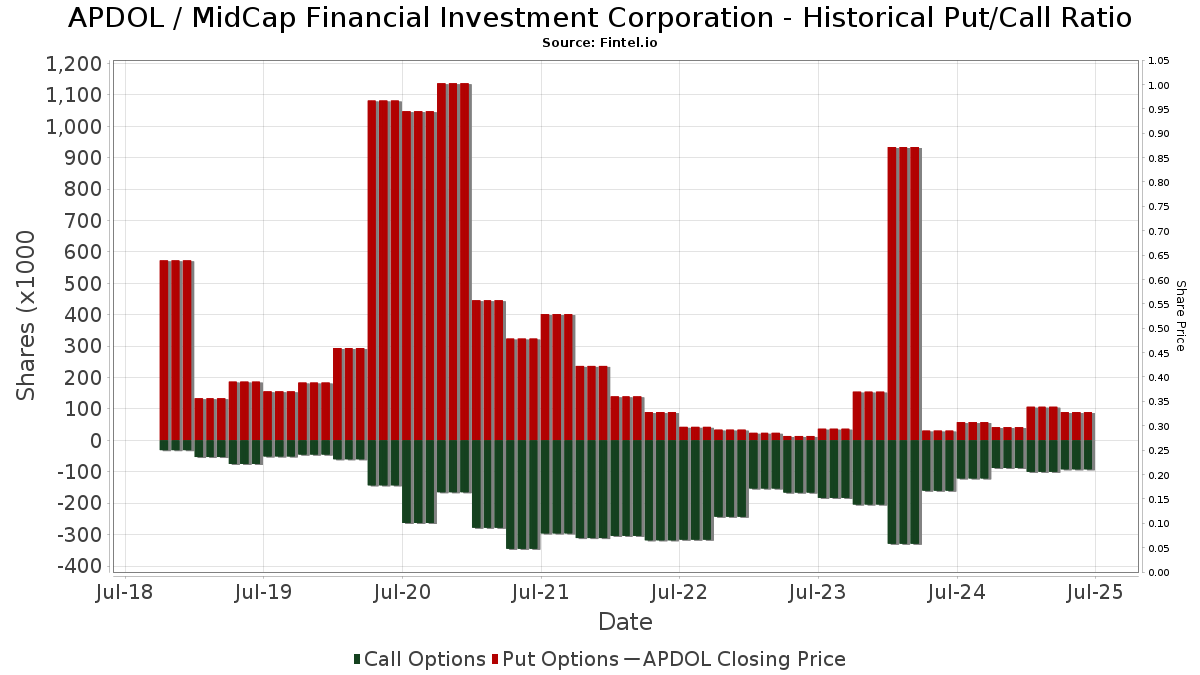
Institutionel Put/Call-forhold
Ud over at indberette standardaktie- og gældsudstedelser skal institutter med mere end 100 mill. aktiver under forvaltning også oplyse deres put- og call-optionsbeholdninger. Da salgsoptioner generelt indikerer negativ stemning, og købsoptioner indikerer positiv stemning, kan vi få en fornemmelse af den overordnede institutionelle stemning ved at plotte forholdet mellem put og kald. Diagrammet til højre viser det historiske put/call-forhold for dette instrument.
Brug af Put/Call Ratio som en indikator for investorernes stemning overvinder en af de vigtigste mangler ved at bruge totalt institutionelt ejerskab, som er, at en betydelig mængde af aktiver under forvaltning investeres passivt for at spore indekser. Passivt forvaltede fonde køber typisk ikke optioner, så indikatoren for put/call-forholdet følger mere nøje følelsen af aktivt forvaltede fonde.
13F og NPORT arkivering
Detaljer om 13F-arkivering er gratis. Detaljer om NP-ansøgninger kræver et premium-medlemskab. Grønne rækker angiver nye positioner. Røde rækker angiver lukkede positioner. Klik på linket ikon for at se den fulde transaktionshistorik.
Opgrader
for at låse premium-data op og eksportere til Excel ![]() .
.
| Fil dato | Kilde | Investor | Type | Gennemsnitlig pris (Øst) |
Aktier | Δ Aktier (%) |
Rapporteret Værdi ($1000) |
Δ Værdi (%) |
Port Alloc (%) |
|
|---|---|---|---|---|---|---|---|---|---|---|
| 2026-02-17 | 13F | Cetera Investment Advisers | 28.415 | -14,14 | 325 | -17,93 | ||||
| 2025-09-29 | NP | VPC - Virtus Private Credit Strategy ETF | 69.513 | 7,03 | 876 | 13,64 | ||||
| 2026-02-18 | 13F | GWM Advisors LLC | 23.927 | -0,83 | 274 | -5,54 | ||||
| 2026-02-17 | 13F | Wiley Bros.-aintree Capital, Llc | 16.652 | 13,89 | 175 | 0,00 | ||||
| 2026-02-12 | 13F | Jane Street Group, Llc | Call | 0 | -100,00 | 0 | -100,00 | |||
| 2026-02-17 | 13F | Diameter Capital Partners LP | 1.013.005 | 11.589 | ||||||
| 2026-01-16 | 13F | Trust Co Of Vermont | 0 | -100,00 | 0 | |||||
| 2026-02-11 | 13F | Closed-End Fund Advisors, Inc. | 183.892 | 2.104 | ||||||
| 2026-02-05 | 13F | Panoramic Investment Advisors, Llc | 53.630 | 0,00 | 614 | -4,67 | ||||
| 2026-02-04 | 13F | Ameritas Advisory Services, LLC | 0 | -100,00 | 0 | |||||
| 2026-02-03 | 13F | Garner Asset Management Corp | 148.905 | -12,55 | 1.703 | -16,89 | ||||
| 2026-01-29 | 13F | D.a. Davidson & Co. | 350.071 | 1,75 | 4.005 | -2,93 | ||||
| 2026-02-13 | 13F | Williams Jones Wealth Management, LLC. | 10.901 | 0,00 | 125 | -4,62 | ||||
| 2026-01-26 | 13F | United Advisor Group, LLC | 255.718 | -5,58 | 2.925 | -9,92 | ||||
| 2026-02-09 | 13F | Hantz Financial Services, Inc. | 722 | 44,40 | 0 | |||||
| 2026-02-17 | 13F | Creative Planning | 14.142 | -16,34 | 162 | -20,30 | ||||
| 2026-01-20 | 13F | Meridian Investment Counsel Inc. | 37.713 | 4,72 | 431 | 0,00 | ||||
| 2026-02-12 | 13F | Triumph Capital Management | 360 | -45,45 | 4 | -42,86 | ||||
| 2026-02-06 | 13F | HighTower Advisors, LLC | 74.877 | -16,66 | 857 | -20,52 | ||||
| 2026-02-13 | 13F | SRS Capital Advisors, Inc. | 2.424 | 0,00 | 28 | -6,90 | ||||
| 2026-02-17 | 13F | Alpine Global Management, LLC | 316.086 | 138,56 | 3.616 | 127,71 | ||||
| 2026-02-13 | 13F/A | Virtus ETF Advisers LLC | 0 | -100,00 | 0 | |||||
| 2026-02-12 | 13F | Advocate Investing Services LLC | 3.133 | 36 | ||||||
| 2026-01-23 | 13F | Tyche Wealth Partners LLC | 11.500 | -51,06 | 132 | -53,38 | ||||
| 2026-02-13 | 13F | Callodine Capital Management, LP | 483.408 | -5,36 | 5.530 | -9,70 | ||||
| 2026-02-12 | 13F | Jane Street Group, Llc | 250.307 | 2.864 | ||||||
| 2025-11-13 | 13F | Promus Capital, LLC | 5.300 | 0,00 | 64 | -4,55 | ||||
| 2026-02-06 | 13F | Larson Financial Group LLC | 0 | -100,00 | 0 | |||||
| 2026-02-10 | 13F | Nomura Asset Management Co Ltd | 1.138 | -84,23 | 13 | -84,88 | ||||
| 2025-11-05 | 13F | Bessemer Group Inc | 0 | -100,00 | 0 | |||||
| 2026-02-11 | 13F | BI Asset Management Fondsmaeglerselskab A/S | 241.364 | 3 | ||||||
| 2026-02-11 | 13F | LeClair Wealth Partners LLC | 40.885 | 0,00 | 468 | -4,69 | ||||
| 2026-02-05 | 13F | Millennium Capital Advisors, LLC | 57.223 | 0,00 | 655 | -4,66 | ||||
| 2026-01-22 | 13F | Ransom Advisory, Ltd | 2.148 | 0,00 | 29 | 0,00 | ||||
| 2025-10-16 | 13F | Kingstone Capital Partners Texas, LLC | 0 | -100,00 | 0 | -100,00 | ||||
| 2026-02-17 | 13F | VARCOV Co. | 23.732 | 271 | ||||||
| 2026-02-17 | 13F | Two Sigma Investments, Lp | 387.499 | 119,47 | 4.433 | 109,45 | ||||
| 2026-01-15 | 13F | Orrstown Financial Services Inc | 13.640 | 0,00 | 156 | -4,29 | ||||
| 2026-02-12 | 13F | Commonwealth Equity Services, Llc | 34.648 | -92,70 | 396 | 7.820,00 | ||||
| 2026-01-20 | 13F | Signaturefd, Llc | 3.447 | 1,77 | 39 | -2,50 | ||||
| 2026-02-13 | 13F | Stifel Financial Corp | 55.629 | -63,14 | 636 | -64,84 | ||||
| 2026-02-17 | 13F | Trexquant Investment LP | 101.212 | 101,73 | 1.158 | 92,51 | ||||
| 2026-01-20 | 13F | Ethos Financial Group, LLC | 393.598 | -6,99 | 4.503 | -11,26 | ||||
| 2026-01-05 | 13F | Confluence Investment Management Llc | 123.357 | -6,34 | 1.411 | -10,64 | ||||
| 2026-02-12 | 13F | CIBC Private Wealth Group, LLC | 3.675 | 0,00 | 42 | -4,55 | ||||
| 2026-02-13 | 13F | Arkadios Wealth Advisors | 102.945 | -1,51 | 1.178 | -6,07 | ||||
| 2026-02-10 | 13F | Easterly Investment Partners Llc | 12.148 | 5,86 | 139 | 0,73 | ||||
| 2026-02-18 | 13F | Garton & Associates Financial Advisors LLC | 480 | 5 | ||||||
| 2026-01-23 | 13F | State of Alaska, Department of Revenue | 3.871 | 0,00 | 0 | |||||
| 2026-02-17 | 13F | Jones Financial Companies Lllp | 3.884 | 24,73 | 44 | 18,92 | ||||
| 2026-02-06 | 13F | Condor Capital Management | 456.217 | 6,25 | 5.219 | 1,38 | ||||
| 2026-02-13 | 13F | Parkside Financial Bank & Trust | 7.751 | 3,31 | 89 | -1,12 | ||||
| 2026-02-13 | 13F | Pinnacle Wealth Planning Services, Inc. | 1.253 | 14 | ||||||
| 2025-09-26 | NP | LBO - WHITEWOLF Publicly Listed Private Equity ETF | 6.581 | 8,33 | 83 | 13,89 | ||||
| 2026-02-10 | 13F | Foundations Investment Advisors, LLC | 486.444 | 21,53 | 5.565 | 15,94 | ||||
| 2026-02-09 | 13F | Harbour Investments, Inc. | 6.409 | -5,50 | 73 | -9,88 | ||||
| 2026-01-26 | 13F | Cwm, Llc | 1.190 | 16,32 | 0 | |||||
| 2026-02-09 | 13F | MQS Management LLC | 52.193 | 597 | ||||||
| 2026-02-17 | 13F | Northern Trust Corp | 40.242 | -11,46 | 460 | -15,44 | ||||
| 2026-02-17 | 13F | Guggenheim Capital Llc | 10.377 | -0,01 | 119 | -4,84 | ||||
| 2026-02-17 | 13F | D. E. Shaw & Co., Inc. | 119.977 | 700,43 | 1.373 | 666,48 | ||||
| 2026-01-14 | 13F | TrueMark Investments, LLC | 24.108 | 276 | ||||||
| 2026-01-14 | 13F | Hennion & Walsh Asset Management, Inc. | 159.675 | -4,51 | 1.827 | -8,88 | ||||
| 2026-02-03 | 13F | Denali Advisors Llc | 61.762 | -17,02 | 707 | -20,85 | ||||
| 2026-01-12 | 13F | DKM Wealth Management, Inc. | 23.500 | 0,00 | 269 | -4,63 | ||||
| 2026-01-29 | 13F | Camelot Portfolios, LLC | 59.051 | -6,66 | 676 | -10,95 | ||||
| 2026-01-21 | 13F | Naviter Wealth, LLC | 167.014 | -18,17 | 1.911 | -21,95 | ||||
| 2026-03-03 | 13F/A | Caitong International Asset Management Co., Ltd | 3 | 0 | ||||||
| 2026-02-13 | 13F | Verition Fund Management LLC | 30.400 | 0,00 | 348 | -4,67 | ||||
| 2026-02-13 | 13F | Westchester Capital Management, LLC | 7.702 | 0,00 | 88 | -4,35 | ||||
| 2026-01-14 | 13F | Generali Investments CEE, investicni spolecnost, a.s. | 22.281 | 0,00 | 255 | -4,87 | ||||
| 2026-02-13 | 13F | Kestra Advisory Services, LLC | 9.490 | 109 | ||||||
| 2026-02-12 | 13F | Founders Financial Alliance, LLC | 11.987 | -11,78 | 137 | -15,43 | ||||
| 2026-02-17 | 13F | Citadel Advisors Llc | Put | 10.500 | 120 | |||||
| 2025-10-01 | 13F | Caldwell Trust Co | 0 | -100,00 | 0 | -100,00 | ||||
| 2026-01-29 | 13F | Comerica Bank | 86.137 | -0,28 | 985 | -4,83 | ||||
| 2026-02-17 | 13F | Hbk Investments L P | Put | 205.500 | 2.351 | |||||
| 2026-02-17 | 13F | Citadel Advisors Llc | Call | 44.500 | -53,45 | 509 | -55,58 | |||
| 2026-02-11 | 13F | Jpmorgan Chase & Co | 44.466 | -14,86 | 509 | -18,85 | ||||
| 2026-02-17 | 13F | Oxford Asset Management Llp | 34.889 | 58,11 | 399 | 51,14 | ||||
| 2026-02-06 | 13F | Americana Partners, LLC | 16.952 | 194 | ||||||
| 2026-02-17 | 13F | Apollo Management Holdings, L.P. | 2.388.870 | 0,00 | 27.329 | -4,59 | ||||
| 2026-02-12 | 13F | BlackRock, Inc. | 316.204 | -2,67 | 3.617 | -7,14 | ||||
| 2026-02-13 | 13F | Arete Wealth Advisors, LLC | 17.333 | 10,87 | 0 | |||||
| 2026-02-13 | 13F | Morgan Stanley | 1.743.681 | -9,03 | 19.948 | -13,21 | ||||
| 2025-11-14 | 13F | Evoke Wealth, Llc | 0 | -100,00 | 0 | |||||
| 2026-02-17 | 13F | Lazard Asset Management Llc | 125.395 | 35,22 | 1.435 | 29,07 | ||||
| 2026-02-06 | 13F | Lsv Asset Management | 96.100 | 0,00 | 1 | 0,00 | ||||
| 2026-02-05 | 13F | Allworth Financial LP | 3.356 | 4,13 | 38 | 0,00 | ||||
| 2026-02-17 | 13F | Advisory Services Network, LLC | 13.576 | -42,36 | 155 | -45,04 | ||||
| 2026-02-17 | 13F | NCP Inc. | 823 | 9 | ||||||
| 2026-02-19 | 13F | Invesco Ltd. | 911.041 | 3,48 | 10.422 | -1,27 | ||||
| 2026-02-13 | 13F | Wells Fargo & Company/mn | 304.699 | -43,90 | 3.486 | -46,48 | ||||
| 2025-11-13 | 13F | M Holdings Securities, Inc. | 0 | -100,00 | 0 | |||||
| 2026-02-11 | 13F | J.w. Cole Advisors, Inc. | 133.221 | 5,40 | 1.524 | 0,59 | ||||
| 2025-11-06 | 13F | Westbourne Investments, Inc. | 0 | -100,00 | 0 | |||||
| 2026-02-03 | 13F | International Assets Investment Management, Llc | 25.861 | -0,52 | 296 | -8,67 | ||||
| 2026-02-18 | 13F | Onyx Bridge Wealth Group LLC | 18.092 | 1,62 | 207 | -3,29 | ||||
| 2026-02-04 | 13F | Pensionmark Financial Group, Llc | 13.075 | 71 | ||||||
| 2026-02-12 | 13F | Principal Securities, Inc. | 0 | -100,00 | 0 | |||||
| 2025-11-14 | 13F | StoneX Group Inc. | 0 | -100,00 | 0 | -100,00 | ||||
| 2026-02-13 | 13F | Resources Investment Advisors, LLC. | 11.936 | -23,56 | 137 | -27,27 | ||||
| 2026-02-02 | 13F | Oppenheimer & Co Inc | 10.730 | -33,20 | 123 | -36,46 | ||||
| 2026-02-26 | 13F | Anchor Investment Management, LLC | 1.145 | -55,57 | 13 | -56,67 | ||||
| 2026-01-07 | 13F | Sovereign Financial Group, Inc. | 11.112 | -0,89 | 127 | -5,22 | ||||
| 2026-01-15 | 13F | Founders Capital Management | 1.500 | 0,00 | 17 | 0,00 | ||||
| 2026-02-10 | 13F | Lido Advisors, LLC | 64.821 | 8,63 | 774 | 8,11 | ||||
| 2026-02-13 | 13F | Tcfg Wealth Management, Llc | 41.656 | -4,65 | 477 | -8,99 | ||||
| 2026-02-17 | 13F | Susquehanna International Group, Llp | Put | 71.000 | 396,50 | 812 | 374,85 | |||
| 2026-02-17 | 13F | Susquehanna International Group, Llp | Call | 29.700 | 340 | |||||
| 2026-02-17 | 13F | Russell Investments Group, Ltd. | 264.315 | 3.024 | ||||||
| 2026-02-10 | 13F | Envestnet Asset Management Inc | 54.735 | -3,88 | 626 | -8,21 | ||||
| 2026-02-17 | 13F | Decision Investments, Inc | 10.430 | 119 | ||||||
| 2026-02-09 | 13F | Frazier Financial Advisors, LLC | 1 | 0,00 | 0 | |||||
| 2026-02-05 | 13F | DnB Asset Management AS | 153.358 | -6,55 | 1.753 | -10,89 | ||||
| 2026-02-10 | 13F | Quantbot Technologies LP | 67.607 | 773 | ||||||
| 2026-02-17 | 13F | Susquehanna International Group, Llp | 32.841 | 376 | ||||||
| 2025-11-12 | 13F | Transce3nd, LLC | 0 | -100,00 | 0 | |||||
| 2026-02-02 | 13F | Access Investment Management LLC | 4.000 | 0,00 | 48 | 0,00 | ||||
| 2026-02-17 | 13F | Cape Investment Advisory, Inc. | 1.784 | 20 | ||||||
| 2026-01-26 | 13F | Decker Retirement Planning Inc. | 875 | 10 | ||||||
| 2026-02-17 | 13F | Millennium Management Llc | 0 | -100,00 | 0 | |||||
| 2026-02-12 | 13F | Wealthspire Advisors, LLC | 0 | -100,00 | 0 | |||||
| 2026-02-13 | 13F | Great West Life Assurance Co /can/ | 44.668 | -0,20 | 1 | |||||
| 2026-02-17 | 13F | Ameriprise Financial Inc | 173.655 | -58,37 | 1.987 | -60,29 | ||||
| 2026-02-12 | 13F | Advisors Asset Management, Inc. | 248.193 | -14,24 | 2.839 | -18,18 | ||||
| 2026-02-04 | 13F | Global Wealth Management Investment Advisory, Inc. | 97.234 | 6,93 | 1.112 | 2,02 | ||||
| 2026-02-03 | 13F | Anfield Capital Management, LLC | 14.065 | 59,76 | 161 | 52,38 | ||||
| 2026-02-13 | 13F | Thornburg Investment Management Inc | 3.137.783 | 0,00 | 35.896 | -4,59 | ||||
| 2026-02-13 | 13F | Marshall Wace, Llp | 0 | -100,00 | 0 | |||||
| 2026-02-17 | 13F | Price T Rowe Associates Inc /md/ | 0 | -100,00 | 0 | |||||
| 2026-01-16 | 13F | Morris Retirement Advisors, LLC | 10.554 | 3,30 | 121 | -1,64 | ||||
| 2026-01-21 | 13F | Muzinich & Co., Inc. | 714.776 | 25,07 | 8.177 | 19,34 | ||||
| 2026-02-13 | 13F | Van Eck Associates Corp | 2.321.600 | -7,57 | 27 | -13,33 | ||||
| 2026-02-17 | 13F | XTX Topco Ltd | 135.297 | 1.548 | ||||||
| 2026-02-17 | 13F | Crawford Fund Management, LLC | Put | 80.000 | -13,98 | 915 | -17,94 | |||
| 2026-02-18 | 13F | Papamarkou Wellner Asset Management inc. | 16.941 | 194 | ||||||
| 2026-02-17 | 13F | Advisor Group Holdings, Inc. | 146.759 | 4,61 | 1.679 | -6,47 | ||||
| 2026-01-23 | 13F | Smallwood Wealth Investment Management, LLC | 1 | 0,00 | 0 | |||||
| 2026-02-12 | 13F | Wedbush Securities Inc | 30.427 | -15,37 | 0 | |||||
| 2026-02-10 | 13F | Castlekeep Investment Advisors Llc | 384.937 | -3,45 | 4.404 | -7,89 | ||||
| 2026-02-11 | 13F | Private Management Group Inc | 0 | -100,00 | 0 | |||||
| 2026-02-12 | 13F | Lansforsakringar Fondforvaltning AB (publ) | 119.214 | 1.364 | ||||||
| 2026-01-22 | 13F | Financial Consulate, Inc | 3.968 | 3,31 | 45 | -2,17 | ||||
| 2026-02-11 | 13F | LPL Financial LLC | 317.470 | -37,43 | 3.632 | -40,31 | ||||
| 2026-01-28 | 13F | N.E.W. Advisory Services LLC | 50 | 4,17 | 1 | |||||
| 2026-02-13 | 13F | Ares Management Llc | 0 | -100,00 | 0 | |||||
| 2026-02-17 | 13F | Raymond James Financial Inc | 486.406 | 337,05 | 5.564 | 317,09 | ||||
| 2026-02-04 | 13F | Shade Tree Advisors LLC | 17.099 | 196 | ||||||
| 2026-02-17 | 13F | Rivernorth Capital Management, Llc | 414.430 | 4.741 | ||||||
| 2026-02-06 | 13F | IFP Advisors, Inc | 1.515 | 0,07 | 17 | -5,56 | ||||
| 2025-11-05 | 13F | Axim Planning & Wealth | 0 | -100,00 | 0 | |||||
| 2026-02-12 | 13F | Walled Lake Planning & Wealth Management, Llc | 0 | -100,00 | 0 | |||||
| 2026-01-30 | 13F | Activest Wealth Management | 2.266 | 0,00 | 26 | -7,41 | ||||
| 2026-01-23 | 13F | Cura Wealth Advisors, Llc | 641.918 | 3,88 | 7.344 | -0,88 | ||||
| 2026-02-06 | 13F | Pnc Financial Services Group, Inc. | 14.142 | 0,00 | 162 | -4,73 | ||||
| 2026-02-11 | 13F | Group One Trading, L.p. | 99 | -94,79 | 1 | -95,45 | ||||
| 2026-02-12 | 13F | CF Capital LLC | 651.326 | 160,53 | 7.451 | 148,62 | ||||
| 2025-11-14 | 13F | Credit Agricole S A | 0 | -100,00 | 0 | -100,00 | ||||
| 2026-01-21 | 13F | Capital Advisory Group Advisory Services, LLC | 0 | -100,00 | 0 | |||||
| 2026-02-10 | 13F | Bnp Paribas Arbitrage, Sa | 65.100 | 1.317,68 | 745 | 1.252,73 | ||||
| 2026-02-14 | 13F | Rockefeller Capital Management L.P. | 5.480 | -93,13 | 63 | -93,51 | ||||
| 2026-01-13 | 13F | CoreCap Advisors, LLC | 1.465 | 29,42 | 17 | 23,08 | ||||
| 2026-02-10 | 13F | Goldman Sachs Group Inc | 16.795 | -22,86 | 192 | -26,44 | ||||
| 2026-02-17 | 13F | Brevan Howard Capital Management LP | 34.964 | 102,87 | 400 | 93,69 | ||||
| 2026-01-23 | 13F | Sumitomo Mitsui Trust Holdings, Inc. | 549.575 | 9,18 | 6.287 | 4,18 | ||||
| 2025-11-14 | 13F | Ausdal Financial Partners, Inc. | 0 | -100,00 | 0 | |||||
| 2026-02-06 | 13F | Redmont Wealth Advisors Llc | 5.574 | -57,30 | 64 | -59,62 | ||||
| 2026-02-09 | 13F | Legal & General Group Plc | 651.851 | 12,81 | 7.447 | 7,68 | ||||
| 2026-02-06 | 13F | ProShare Advisors LLC | 18.531 | -5,56 | 212 | -10,21 | ||||
| 2026-01-21 | 13F | Sowell Financial Services LLC | 11.808 | 135 | ||||||
| 2026-02-17 | 13F | Jump Financial, LLC | 48.637 | 556 | ||||||
| 2026-01-20 | 13F | Stratos Wealth Partners, LTD. | 22.200 | 42,31 | 254 | 35,29 | ||||
| 2026-02-05 | 13F | Everstar Asset Management, LLC | 20.150 | -3,36 | 231 | -7,63 | ||||
| 2026-02-03 | 13F | Cheviot Value Management, LLC | 333 | 0,00 | 4 | -25,00 | ||||
| 2026-02-11 | 13F | Franklin Resources Inc | 445.302 | -42,23 | 5.094 | -44,88 | ||||
| 2026-01-13 | 13F | Stablepoint Partners, LLC | 0 | -100,00 | 0 | |||||
| 2026-02-02 | 13F | Truist Financial Corp | 19.250 | -27,22 | 220 | -30,60 | ||||
| 2026-02-06 | 13F | Global Retirement Partners, LLC | 445 | 0,00 | 5 | 0,00 | ||||
| 2026-02-17 | 13F | First Commonwealth Financial Corp /pa/ | 24.927 | 285 | ||||||
| 2026-02-17 | 13F | Two Sigma Advisers, Lp | 24.254 | -57,16 | 277 | -59,14 | ||||
| 2025-11-14 | 13F | Two Sigma Securities, Llc | 0 | -100,00 | 0 | -100,00 | ||||
| 2026-02-10 | 13F/A | Northwestern Mutual Wealth Management Co | 896 | 59,15 | 10 | 66,67 | ||||
| 2026-02-17 | 13F | Permanens Capital L.P. | 11.029 | 0,00 | 126 | -4,55 | ||||
| 2026-02-20 | 13F | Kovitz Investment Group Partners, LLC | 0 | -100,00 | 0 | |||||
| 2026-02-05 | 13F | Stephens Inc /ar/ | 79.954 | -5,64 | 915 | -9,95 | ||||
| 2026-02-17 | 13F | Almitas Capital LLC | 135.477 | 46,12 | 1.550 | 39,42 | ||||
| 2026-02-10 | 13F | Essex Financial Services, Inc. | 0 | -100,00 | 0 | |||||
| 2026-01-30 | 13F | Us Bancorp \de\ | 21.026 | 0,00 | 241 | -4,76 | ||||
| 2026-02-13 | 13F | Sofos Investments, Inc. | 750 | -25,00 | 9 | -27,27 | ||||
| 2026-01-28 | 13F | HB Wealth Management, LLC | 13.667 | 3,30 | 156 | -1,27 | ||||
| 2026-02-17 | 13F | Tower Research Capital LLC (TRC) | 7.161 | 24,37 | 82 | 17,39 | ||||
| 2026-02-13 | 13F | Colony Group, LLC | 102.066 | 1.168 | ||||||
| 2026-01-21 | 13F | Newbridge Financial Services Group, Inc. | 276 | 0,00 | 3 | 0,00 | ||||
| 2026-02-09 | 13F | Shufro Rose & Co Llc | 37.267 | -10,92 | 426 | -20,67 | ||||
| 2026-02-17 | 13F | Aquatic Capital Management LLC | 32.824 | 39,13 | 376 | 32,98 | ||||
| 2025-11-14 | 13F | Citadel Advisors Llc | 0 | -100,00 | 0 | -100,00 | ||||
| 2026-01-29 | 13F | UMA Financial Services, Inc. | 3.500 | 0,00 | 40 | -2,44 | ||||
| 2026-01-30 | 13F | Sigma Planning Corp | 71.842 | 0,82 | 822 | -3,86 | ||||
| 2026-02-11 | 13F | Parallel Advisors, LLC | 4.669 | -37,89 | 53 | -41,11 | ||||
| 2026-02-04 | 13F | Atlantic Union Bankshares Corp | 10.500 | 0,00 | 120 | -4,00 | ||||
| 2026-02-12 | 13F | Steward Partners Investment Advisory, Llc | 34.497 | -3,93 | 395 | -8,37 | ||||
| 2026-01-29 | 13F | UBS Group AG | 2.024.312 | 18,99 | 23.158 | 13,54 | ||||
| 2026-02-05 | 13F | Security National Bank | 0 | -100,00 | 0 | |||||
| 2026-02-13 | 13F | Peak6 Llc | Call | 0 | -100,00 | 0 | ||||
| 2025-11-14 | 13F | Wolverine Trading, Llc | Call | 13.800 | 165 | |||||
| 2026-01-21 | 13F | Sound Income Strategies, LLC | 2.989 | 167,35 | 35 | 183,33 | ||||
| 2026-02-17 | 13F | Virtus Investment Advisers, Inc. | 60.236 | -14,23 | 689 | -18,17 | ||||
| 2025-11-13 | 13F | Acadian Asset Management Llc | 0 | -100,00 | 0 | |||||
| 2026-02-17 | 13F | Royal Bank Of Canada | 219.049 | -3,00 | 2.506 | -7,46 | ||||
| 2026-01-23 | 13F | Farther Finance Advisors, LLC | 620 | 6,16 | 7 | 0,00 | ||||
| 2026-02-13 | 13F | Squarepoint Ops LLC | 18.322 | 210 | ||||||
| 2026-02-23 | 13F | Virtu Financial LLC | 26.960 | 21,97 | 0 | |||||
| 2026-02-17 | 13F | National Asset Management, Inc. | 19.303 | 1,05 | 221 | -3,93 | ||||
| 2026-02-05 | 13F | Cambridge Investment Research Advisors, Inc. | 10.825 | 0 | ||||||
| 2026-02-11 | 13F | Fox Run Management, L.l.c. | 0 | -100,00 | 0 | |||||
| 2026-02-11 | 13F | Hilton Head Capital Partners, LLC | 919 | 11 | ||||||
| 2026-01-16 | 13F | Melfa Wealth Management, Llc | 13.718 | 0,00 | 157 | -4,88 | ||||
| 2026-02-11 | 13F | Cerity Partners LLC | 199.049 | 2.277 | ||||||
| 2025-11-13 | 13F | Connor, Clark & Lunn Investment Management Ltd. | 0 | -100,00 | 0 | |||||
| 2026-02-05 | 13F | AlphaCore Capital LLC | 12.914 | 8,62 | 148 | 3,52 | ||||
| 2026-01-20 | 13F | Accel Wealth Management | 0 | -100,00 | 0 | |||||
| 2026-02-17 | 13F | Bank Of America Corp /de/ | 141.045 | -6,02 | 1.614 | -10,34 | ||||
| 2026-02-14 | 13F | Whipplewood Advisors, LLC | 39 | -99,91 | 0 | -100,00 | ||||
| 2026-02-11 | 13F | Janney Montgomery Scott LLC | 364.142 | -8,01 | 4 | 0,00 | ||||
| 2026-01-23 | 13F | Assetmark, Inc | 500 | 0,00 | 6 | 0,00 | ||||
| 2026-02-09 | 13F | Kingsview Wealth Management, LLC | 10.049 | 115 | ||||||
| 2026-02-13 | 13F | Dynamic Technology Lab Private Ltd | 18.153 | 208 | ||||||
| 2026-02-13 | 13F | Neuberger Berman Group LLC | 205.660 | -10,32 | 2.353 | -14,44 | ||||
| 2026-01-29 | 13F | Nbc Securities, Inc. | 300 | 0,00 | 3 | 0,00 | ||||
| 2026-02-06 | 13F | GPS Wealth Strategies Group, LLC | 1.114 | 3,24 | 13 | 0,00 | ||||
| 2026-02-13 | 13F | Caxton Associates Llp | 22.441 | 0,00 | 257 | -4,83 | ||||
| 2026-02-11 | 13F | Next Capital Management LLC | 1.484.349 | 10,64 | 16.981 | 5,56 | ||||
| 2026-01-13 | 13F | Capital Investment Advisors, LLC | 62.205 | -4,30 | 712 | -8,73 | ||||
| 2026-02-11 | 13F | Sharpepoint Llc | 103.569 | 1.185 | ||||||
| 2026-01-20 | 13F | AdvisorNet Financial, Inc | 12.213 | -13,08 | 140 | -17,26 | ||||
| 2026-02-09 | 13F | Key FInancial Inc | 150 | 0,00 | 2 | 0,00 | ||||
| 2026-01-07 | 13F | Aventura Private Wealth, LLC | 619 | 3,34 | 7 | 0,00 |
Other Listings
| US:MFIC | 10,22 $ |