Grundlæggende statistik
| Institutionelle ejere | 462 total, 457 long only, 0 short only, 5 long/short - change of -44,22% MRQ |
| Gennemsnitlig porteføljeallokering | 0.2374 % - change of -33,07% MRQ |
| Institutionelle aktier (lange) | 101.006.992 (ex 13D/G) - change of -26,23MM shares -20,61% MRQ |
| Institutionel værdi (lang) | $ 6.207.540 USD ($1000) |
Institutionelt ejerskab og aktionærer
Air Lease Corporation (US:AL) har 462 institutionelle ejere og aktionærer, der har indsendt 13D/G- eller 13F-formularer til Securities Exchange Commission (SEC). Disse institutioner har i alt 101,006,992 aktier. Største aktionærer omfatter BlackRock, Inc., Vanguard Group Inc, Hbk Investments L P, FIL Ltd, Dimensional Fund Advisors Lp, State Street Corp, American Century Companies Inc, UBS Group AG, Aqr Capital Management Llc, and Glazer Capital, Llc .
Air Lease Corporation (NYSE:AL) institutionel ejerskabsstruktur viser aktuelle positioner i virksomheden efter institutioner og fonde, samt seneste ændringer i positionsstørrelse. Større aktionærer kan omfatte individuelle investorer, investeringsforeninger, hedgefonde eller institutioner. Skema 13D angiver, at investoren besidder (eller besidder) mere end 5 % af virksomheden og har til hensigt (eller har til hensigt at) aktivt at forfølge en ændring i forretningsstrategi. Skema 13G indikerer en passiv investering på over 5%.
The share price as of April 8, 2026 is 0,00 / share. Previously, on April 28, 2025, the share price was 46,24 / share. This represents a decline of 100,00% over that period.

Fondens stemningsscore
Fund Sentiment Score (fka Ownership Accumulation Score) finder de aktier, der bliver mest købt af fonde. Det er resultatet af en sofistikeret, multi-faktor kvantitativ model, der identificerer virksomheder med de højeste niveauer af institutionel akkumulering. Scoringsmodellen bruger en kombination af den samlede stigning i oplyste ejere, ændringerne i porteføljeallokeringer i disse ejere og andre målinger. Tallet går fra 0 til 100, hvor højere tal indikerer et højere niveau af akkumulering for sine jævnaldrende, og 50 er gennemsnittet.
Opdateringsfrekvens: Dagligt
Se Ownership Explorer, som giver en liste over højest rangerende virksomheder.
AI+ Ask Fintel’s AI assistant about Air Lease Corporation.
Select a question to share a public post with an AI-crafted answer.
Thinking of good questions…
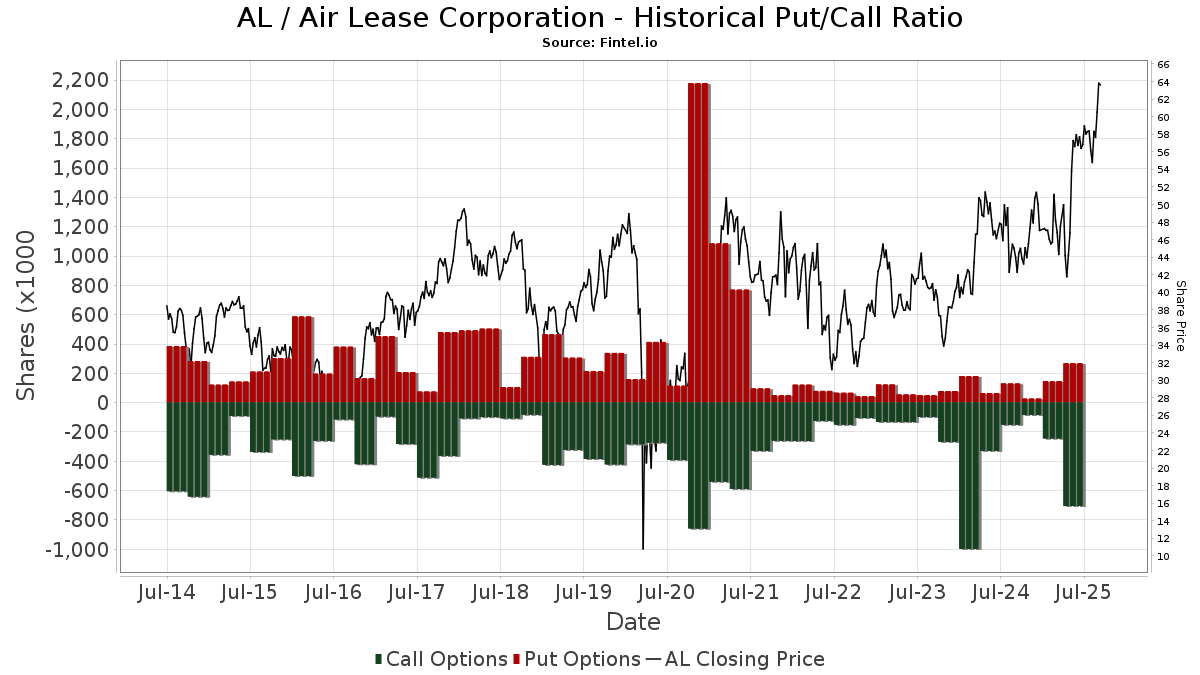
Institutionel Put/Call-forhold
Ud over at indberette standardaktie- og gældsudstedelser skal institutter med mere end 100 mill. aktiver under forvaltning også oplyse deres put- og call-optionsbeholdninger. Da salgsoptioner generelt indikerer negativ stemning, og købsoptioner indikerer positiv stemning, kan vi få en fornemmelse af den overordnede institutionelle stemning ved at plotte forholdet mellem put og kald. Diagrammet til højre viser det historiske put/call-forhold for dette instrument.
Brug af Put/Call Ratio som en indikator for investorernes stemning overvinder en af de vigtigste mangler ved at bruge totalt institutionelt ejerskab, som er, at en betydelig mængde af aktiver under forvaltning investeres passivt for at spore indekser. Passivt forvaltede fonde køber typisk ikke optioner, så indikatoren for put/call-forholdet følger mere nøje følelsen af aktivt forvaltede fonde.
13D/G-arkivering
Vi præsenterer 13D/G ansøgninger separat fra 13F ansøgninger på grund af den forskellige behandling af SEC. 13D/G-ansøgninger kan indgives af grupper af investorer (med én ledende), hvorimod 13F-ansøgninger ikke kan. Dette resulterer i situationer, hvor en investor kan indsende en 13D/G, der rapporterer én værdi for de samlede aktier (der repræsenterer alle de aktier, der ejes af investorgruppen), men derefter indsender en 13F, der rapporterer en anden værdi for de samlede aktier (der udelukkende repræsenterer deres egne) ejendomsret). Det betyder, at aktieejerskab af 13D/G-arkiver og 13F-arkiveringer ofte ikke er direkte sammenlignelige, så vi præsenterer dem separat.
Bemærk: Fra den 16. maj 2021 viser vi ikke længere ejere, der ikke har indsendt en 13D/G inden for det seneste år. Tidligere viste vi den fulde historie af 13D/G-arkiver. Generelt skal enheder, der er forpligtet til at indgive 13D/G-ansøgninger, indgive mindst årligt, før de indsender en afsluttende ansøgning. Dog forlader fonde nogle gange positioner uden at indsende en afsluttende ansøgning (dvs. de afvikler), så visning af den fulde historie resulterede nogle gange i forvirring om det nuværende ejerskab. For at undgå forvirring viser vi nu kun 'aktuelle' ejere - det vil sige - ejere, der har anmeldt inden for det seneste år.
Upgrade to unlock premium data.
| Fil dato | Form | Investor | Forrige Aktier |
Seneste Aktier |
Δ Aktier (Procent) |
Ejendomsret (Procent) |
Δ Ejerskab (Procent) |
|
|---|---|---|---|---|---|---|---|---|
| 2026-01-30 | VANGUARD GROUP INC | 12,578,106 | 11,424,772 | -9.17 | 10.22 | -9.48 | ||
| 2026-01-22 | UDVAR-HAZY STEVEN F | 5,811,047 | 5,340,156 | -8.10 | 4.76 | -8.99 | ||
| 2026-01-21 | DIMENSIONAL FUND ADVISORS LP | 6,835,595 | 3,783,714 | -44.65 | 3.40 | -45.16 | ||
| 2025-04-29 | BlackRock, Inc. | 13,862,881 | 12,440,887 | -10.26 | 11.10 | -10.48 |
13F og NPORT arkivering
Detaljer om 13F-arkivering er gratis. Detaljer om NP-ansøgninger kræver et premium-medlemskab. Grønne rækker angiver nye positioner. Røde rækker angiver lukkede positioner. Klik på linket ikon for at se den fulde transaktionshistorik.
Opgrader
for at låse premium-data op og eksportere til Excel ![]() .
.
| Fil dato | Kilde | Investor | Type | Gennemsnitlig pris (Øst) |
Aktier | Δ Aktier (%) |
Rapporteret Værdi ($1000) |
Δ Værdi (%) |
Port Alloc (%) |
|
|---|---|---|---|---|---|---|---|---|---|---|
| 2026-01-30 | 13F | Us Bancorp \de\ | 17.805 | -75,14 | 1.144 | -74,92 | ||||
| 2026-02-05 | 13F | HFM Investment Advisors, LLC | 12 | 0,00 | 1 | |||||
| 2026-02-12 | 13F | Cibc World Markets Corp | 63.797 | 4.098 | ||||||
| 2026-02-17 | 13F | Polymer Capital Management (US) LLC | 6.713 | -45,12 | 431 | -44,60 | ||||
| 2026-02-17 | 13F | Jain Global LLC | 20.262 | 1.301 | ||||||
| 2026-02-17 | 13F | VR Advisory Services Ltd | 0 | -100,00 | 0 | |||||
| 2025-11-14 | 13F | Knightsbridge Asset Management, Llc | 0 | -100,00 | 0 | -100,00 | ||||
| 2026-01-27 | 13F | TD Waterhouse Canada Inc. | 362 | -24,58 | 23 | -23,33 | ||||
| 2026-03-06 | 13F | Hsbc Holdings Plc | 0 | -100,00 | 0 | |||||
| 2026-02-06 | 13F | Tortoise Investment Management, LLC | 0 | -100,00 | 0 | |||||
| 2026-02-17 | 13F | Diameter Capital Partners LP | 0 | -100,00 | 0 | |||||
| 2026-02-17 | 13F | Css Llc/il | Put | 1.100 | 71 | |||||
| 2026-02-17 | 13F | Css Llc/il | 15.234 | 978 | ||||||
| 2026-02-12 | 13F | New York State Common Retirement Fund | 45.980 | -88,69 | 2.953 | -88,59 | ||||
| 2026-02-13 | 13F | Landscape Capital Management, L.l.c. | 4.695 | 302 | ||||||
| 2026-02-06 | 13F | Pnc Financial Services Group, Inc. | 9.267 | -16,91 | 595 | -16,08 | ||||
| 2026-02-03 | 13F | Sequoia Financial Advisors, LLC | 95.522 | 16,05 | 6.135 | 17,10 | ||||
| 2026-01-09 | 13F | Assenagon Asset Management S.A. | 0 | -100,00 | 0 | |||||
| 2026-02-13 | 13F | Umb Bank N A/mo | 703 | 24,87 | 45 | 28,57 | ||||
| 2026-02-17 | 13F | VARCOV Co. | 5.824 | 374 | ||||||
| 2026-02-17 | 13F | Wellington Management Group Llp | 278.231 | -41,69 | 17.871 | -41,16 | ||||
| 2026-02-02 | 13F | Oppenheimer Asset Management Inc. | 0 | -100,00 | 0 | |||||
| 2026-02-12 | 13F | Ankerstar Wealth, LLC | 24 | 2 | ||||||
| 2026-02-12 | 13F | Steward Partners Investment Advisory, Llc | 778 | -12,49 | 50 | -12,50 | ||||
| 2026-01-28 | 13F | Quent Long Short Global Small Cap Fund, LP | 3.651 | 235 | ||||||
| 2026-02-13 | 13F | Kopernik Global Investors, LLC | 285.013 | 0,00 | 18.306 | 0,91 | ||||
| 2026-02-11 | 13F | Vestcor Inc | 99.454 | 3,32 | 6 | 0,00 | ||||
| 2025-11-14 | 13F | Resolute Capital Asset Partners LLC | 0 | -100,00 | 0 | |||||
| 2026-01-29 | 13F | Sanctuary Advisors, LLC | 15.151 | -20,17 | 973 | -19,45 | ||||
| 2026-02-09 | 13F | Hartland & Co., LLC | 395 | -68,87 | 25 | -68,75 | ||||
| 2026-04-27 | 13F | New York State Teachers Retirement System | 37.822 | -8,27 | 2 | 0,00 | ||||
| 2026-02-17 | 13F | Russell Investments Group, Ltd. | 140.941 | -45,82 | 9.053 | -45,33 | ||||
| 2025-11-14 | 13F | Walleye Trading LLC | 0 | -100,00 | 0 | -100,00 | ||||
| 2026-02-23 | 13F | Mv Capital Management, Inc. | 1 | 0,00 | 0 | |||||
| 2026-01-20 | 13F | Cromwell Holdings LLC | 12 | 0,00 | 1 | |||||
| 2026-02-03 | 13F | Mitsubishi UFJ Kokusai Asset Management Co., Ltd. | 402 | 0,00 | 26 | 0,00 | ||||
| 2026-02-17 | 13F | Summit Trail Advisors, Llc | 36.445 | 71,90 | 2.344 | 73,56 | ||||
| 2026-02-17 | 13F | Fmr Llc | 64.872 | 1,09 | 4.167 | 2,01 | ||||
| 2025-11-13 | 13F | Boston Partners | 0 | -100,00 | 0 | |||||
| 2026-04-13 | 13F | IFP Advisors, Inc | 623 | -19,82 | 40 | -18,37 | ||||
| 2026-01-26 | 13F | Whittier Trust Co | 153 | 0,00 | 10 | 0,00 | ||||
| 2026-02-13 | 13F | Soros Fund Management Llc | 1.109.293 | 879,27 | 71.250 | 888,20 | ||||
| 2026-02-09 | 13F | Shufro Rose & Co Llc | 11.200 | -64,95 | 719 | -53,40 | ||||
| 2026-01-28 | 13F | Salomon & Ludwin, LLC | 807 | 1,64 | 52 | 2,00 | ||||
| 2026-02-13 | 13F | Bridgefront Capital, LLC | 7.227 | -35,54 | 464 | -34,92 | ||||
| 2026-02-13 | 13F | Caxton Associates Llp | 0 | -100,00 | 0 | |||||
| 2026-02-17 | 13F | Aqr Capital Management Llc | 2.477.264 | 8,49 | 159.115 | 9,49 | ||||
| 2026-04-24 | 13F | Profund Advisors Llc | 3.158 | -48,83 | 205 | -48,23 | ||||
| 2026-02-26 | 13F | TD Capital Management LLC | 56 | 0,00 | 4 | 0,00 | ||||
| 2026-02-13 | 13F | First Trust Advisors Lp | 159.067 | -65,72 | 10.217 | -65,41 | ||||
| 2026-02-11 | 13F | Los Angeles Capital Management Llc | 501 | 32 | ||||||
| 2026-02-12 | 13F | Wealthspire Advisors, LLC | 0 | -100,00 | 0 | |||||
| 2026-04-09 | 13F | Overbrook Management Corp | 16.416 | 0,00 | 1.066 | 1,14 | ||||
| 2026-02-10 | 13F | English Capital Management Llc | 44.746 | 0,00 | 2.874 | 0,91 | ||||
| 2026-02-13 | 13F | Verition Fund Management LLC | 295.409 | -27,14 | 18.974 | -26,47 | ||||
| 2025-11-13 | 13F | Ensign Peak Advisors, Inc | 0 | -100,00 | 0 | |||||
| 2026-02-12 | 13F | Hrt Financial Lp | 39.550 | 317,81 | 3 | |||||
| 2026-01-14 | 13F | Pallas Capital Advisors LLC | 0 | -100,00 | 0 | |||||
| 2026-02-13 | 13F | Healthcare Of Ontario Pension Plan Trust Fund | 232.000 | 209,33 | 14.901 | 212,19 | ||||
| 2026-02-17 | 13F | Tudor Investment Corp Et Al | 40.303 | 2.589 | ||||||
| 2026-02-09 | 13F | William Blair Investment Management, Llc | 139.279 | -60,01 | 8.946 | -59,65 | ||||
| 2026-02-19 | 13F | CI Private Wealth, LLC | 96.563 | -13,79 | 5.848 | -17,97 | ||||
| 2026-04-06 | 13F | Versant Capital Management, Inc | 1.106 | 49,06 | 72 | 51,06 | ||||
| 2026-02-13 | 13F | Walleye Trading LLC | Call | 0 | -100,00 | 0 | -100,00 | |||
| 2026-02-10 | 13F | Godfrey Financial Associates, Inc. | 20 | 1 | ||||||
| 2026-02-03 | 13F | Credit Industriel Et Commercial | 21.500 | 7,50 | 1.381 | 8,41 | ||||
| 2026-01-28 | 13F | Klp Kapitalforvaltning As | 22.800 | 4,11 | 1.469 | 5,01 | ||||
| 2026-02-17 | 13F | Ancora Advisors, LLC | 2.400 | 0,00 | 154 | 1,32 | ||||
| 2026-04-07 | 13F | Farther Finance Advisors, LLC | 1.514 | 14,09 | 98 | 15,29 | ||||
| 2026-02-13 | 13F | Headlands Technologies LLC | 13.005 | 835 | ||||||
| 2026-02-17 | 13F | Cresset Asset Management, LLC | 9.849 | -6,61 | 635 | -5,79 | ||||
| 2026-02-17 | 13F | Greenland Capital Management LP | 22.543 | -2,00 | 1.448 | -1,16 | ||||
| 2025-10-31 | 13F | Symphony Financial, Ltd. Co. | 0 | -100,00 | 0 | -100,00 | ||||
| 2026-01-21 | 13F | Flagship Harbor Advisors, Llc | 39 | 3 | ||||||
| 2025-11-13 | 13F | Loomis Sayles & Co L P | 0 | -100,00 | 0 | |||||
| 2026-02-13 | 13F | Pathstone Holdings, LLC | 17.543 | 7,29 | 1.128 | 8,36 | ||||
| 2026-02-12 | 13F | Voya Investment Management Llc | 36.507 | 2,43 | 2.345 | 3,35 | ||||
| 2026-02-12 | 13F | Jane Street Group, Llc | Call | 0 | -100,00 | 0 | -100,00 | |||
| 2026-02-11 | 13F | Cerity Partners LLC | 96.398 | 21,34 | 6.192 | 22,45 | ||||
| 2026-02-02 | 13F | Advisors Preferred, LLC | 69.782 | 2.312,10 | 4.477 | 4.929,21 | ||||
| 2026-02-02 | 13F | Ellis Investment Partners, LLC | 32.804 | -47,36 | 2.107 | -46,87 | ||||
| 2026-02-12 | 13F | Jane Street Group, Llc | Put | 0 | -100,00 | 0 | -100,00 | |||
| 2026-02-11 | 13F | Buckingham Strategic Partners | 8.789 | -11,15 | 565 | -10,48 | ||||
| 2026-02-12 | 13F | Quadrant Capital Group Llc | 647 | 3,03 | 42 | 5,13 | ||||
| 2026-04-21 | 13F | Nemes Rush Group LLC | 149 | 0,00 | 10 | 0,00 | ||||
| 2025-11-14 | 13F | Petrus Trust Company, LTA | 0 | -100,00 | 0 | -100,00 | ||||
| 2026-04-24 | 13F | UMA Financial Services, Inc. | 0 | -100,00 | 0 | |||||
| 2026-02-12 | 13F | JPL Wealth Management, LLC | 0 | -100,00 | 0 | |||||
| 2026-01-29 | 13F | Teachers Retirement System Of The State Of Kentucky | 26.325 | -11,04 | 2 | 0,00 | ||||
| 2026-01-27 | 13F | First Horizon Corp | 484 | 0,00 | 31 | 3,33 | ||||
| 2026-04-17 | 13F | CENTRAL TRUST Co | 9 | 0,00 | 1 | |||||
| 2026-02-13 | 13F | Kestra Advisory Services, LLC | 0 | -100,00 | 0 | |||||
| 2026-02-11 | 13F | LPL Financial LLC | 15.805 | -45,87 | 1.015 | -45,37 | ||||
| 2025-11-13 | 13F | Acadian Asset Management Llc | 0 | -100,00 | 0 | |||||
| 2025-10-28 | 13F | Campbell & CO Investment Adviser LLC | 0 | -100,00 | 0 | |||||
| 2026-04-23 | 13F | Oppenheimer & Co Inc | 16.587 | 0,02 | 1.077 | 1,13 | ||||
| 2026-04-24 | 13F | Marathon Asset Mgmt Ltd | 199.048 | 13,55 | 12.961 | 14,72 | ||||
| 2026-02-13 | 13F | Centerpoint Advisors, LLC | 99 | -77,14 | 0 | |||||
| 2026-02-17 | 13F | Two Sigma Advisers, Lp | 2.343.400 | 2.351,26 | 150.517 | 2.373,96 | ||||
| 2026-04-22 | 13F | Janney Montgomery Scott LLC | 0 | -100,00 | 0 | |||||
| 2026-02-13 | 13F | Ieq Capital, Llc | 75.437 | -10,68 | 4.845 | -9,86 | ||||
| 2026-02-12 | 13F | ROSS\JOHNSON & Associates LLC | 1 | 0 | ||||||
| 2026-02-17 | 13F | Schonfeld Strategic Advisors LLC | Call | 100.000 | 400,00 | 6.423 | 404,56 | |||
| 2026-02-09 | 13F | CBIZ Investment Advisory Services, LLC | 418 | -16,40 | 27 | -16,13 | ||||
| 2026-02-17 | 13F | Schonfeld Strategic Advisors LLC | 376 | -99,80 | 24 | -99,80 | ||||
| 2026-02-17 | 13F | State Of Wisconsin Investment Board | 5.825 | -42,36 | 374 | -41,84 | ||||
| 2025-11-13 | 13F | FORA Capital, LLC | 0 | -100,00 | 0 | -100,00 | ||||
| 2026-02-13 | 13F | Prudential Financial Inc | 97.212 | -3,20 | 6.247 | -2,28 | ||||
| 2026-02-13 | 13F | American Century Companies Inc | 2.927.410 | -17,57 | 188.028 | -16,82 | ||||
| 2026-02-17 | 13F | Sagewood Asset Management LP | 18.529 | 1.190 | ||||||
| 2026-02-12 | 13F | Xponance, Inc. | 7.597 | 3,08 | 488 | 3,84 | ||||
| 2026-01-30 | 13F | Caldwell Securities, Inc | 615 | 0,00 | 40 | 0,00 | ||||
| 2026-02-05 | 13F | Elyxium Wealth, LLC | 162 | 10 | ||||||
| 2026-03-04 | 13F | SHP Wealth Management | 36 | 2 | ||||||
| 2026-02-06 | 13F | Redmont Wealth Advisors Llc | 7.242 | -39,07 | 465 | -38,49 | ||||
| 2026-02-03 | 13F | Everence Capital Management Inc | 3.330 | 0,00 | 0 | |||||
| 2026-02-10 | 13F | Commonwealth Of Pennsylvania Public School Empls Retrmt Sys | 176.009 | 42,77 | 11.305 | 44,09 | ||||
| 2026-02-17 | 13F | Omni Event Management Ltd | 860.598 | 55.276 | ||||||
| 2026-01-29 | 13F | Verdence Capital Advisors LLC | 5.707 | -16,17 | 367 | -15,28 | ||||
| 2026-02-04 | 13F | First Eagle Investment Management, LLC | 43.522 | -36,31 | 2.795 | -35,73 | ||||
| 2026-02-17 | 13F | Jones Financial Companies Lllp | 2.128 | -1,39 | 137 | -0,73 | ||||
| 2026-04-27 | 13F | Truist Financial Corp | 0 | -100,00 | 0 | |||||
| 2026-02-10 | 13F | Ellevest, Inc. | 3.985 | -13,76 | 256 | -13,27 | ||||
| 2026-02-13 | 13F | Integrated Wealth Concepts LLC | 5.209 | -12,17 | 335 | -11,41 | ||||
| 2026-02-13 | 13F | Glazer Capital, Llc | 2.414.969 | 1.252,95 | 155 | 1.309,09 | ||||
| 2026-02-13 | 13F | Quarry LP | 254 | 53,94 | 16 | 60,00 | ||||
| 2026-02-05 | 13F | Gamco Investors, Inc. Et Al | 47.096 | -4,30 | 3.025 | -3,45 | ||||
| 2026-02-10 | 13F | Bnp Paribas Arbitrage, Sa | 14.326 | 78,43 | 920 | 80,04 | ||||
| 2026-02-17 | 13F | Brevan Howard Capital Management LP | 56.064 | 28,39 | 3.601 | 29,54 | ||||
| 2026-01-15 | 13F | Nilsine Partners, LLC | 3.202 | -1,60 | 206 | -0,97 | ||||
| 2026-04-27 | 13F | Ethic Inc. | 39.469 | 7,18 | 2.563 | 8,37 | ||||
| 2026-01-28 | 13F | Universal- Beteiligungs- und Servicegesellschaft mbH | 38.380 | 67,10 | 2.466 | 68,72 | ||||
| 2026-04-06 | 13F | CX Institutional | 17 | -52,78 | 0 | |||||
| 2026-02-09 | 13F | Geode Capital Management, Llc | 1.883.450 | 8,33 | 120.999 | 9,32 | ||||
| 2026-02-13 | 13F | Victory Capital Management Inc | 15.637 | -42,40 | 1.004 | -41,86 | ||||
| 2026-02-17 | 13F | Polar Asset Management Partners Inc. | 0 | -100,00 | 0 | |||||
| 2026-02-17 | 13F | Grantham, Mayo, Van Otterloo & Co. LLC | 349.903 | 215,53 | 22.474 | 218,42 | ||||
| 2026-01-30 | 13F | Rachor Investment Advisory Services, LLC | 35 | 2 | ||||||
| 2026-01-29 | 13F | Comerica Bank | 28.311 | -52,89 | 1.818 | -52,47 | ||||
| 2026-02-17 | 13F | Odyssean, LLC | 11.713 | 752 | ||||||
| 2026-04-21 | 13F | Gagnon Advisors, LLC | 0 | -100,00 | 0 | |||||
| 2026-04-08 | 13F | NorthCrest Asset Manangement, LLC | 5.253 | -19,91 | 341 | -18,81 | ||||
| 2026-02-09 | 13F | Accent Capital Management, LLC | 90 | 0,00 | 6 | 0,00 | ||||
| 2026-02-11 | 13F | CenterBook Partners LP | 80.228 | 5.153 | ||||||
| 2026-01-15 | 13F | Alpine Bank Wealth Management | 0 | -100,00 | 0 | |||||
| 2025-11-12 | 13F | Edgestream Partners, L.P. | 0 | -100,00 | 0 | |||||
| 2026-04-07 | 13F | Retirement Wealth Solutions LLC | 318 | -19,29 | 21 | -20,00 | ||||
| 2026-01-29 | 13F | UBS Group AG | 2.818.667 | 269,89 | 181.043 | 273,26 | ||||
| 2025-11-14 | 13F | Point72 Hong Kong Ltd | 0 | -100,00 | 0 | |||||
| 2026-02-13 | 13F | C M Bidwell & Associates Ltd | 73 | 0,00 | 5 | 0,00 | ||||
| 2026-02-17 | 13F | Cnh Partners Llc | 1.485.209 | 47,25 | 95.395 | 48,61 | ||||
| 2026-01-29 | 13F | Quent Capital, LLC | 3.651 | -1,35 | 235 | -0,43 | ||||
| 2026-02-09 | 13F | Morningstar Investment Management LLC | 0 | -100,00 | 0 | |||||
| 2026-02-10 | 13F | Fortis Advisors, LLC | 7.925 | 0,00 | 509 | 0,99 | ||||
| 2026-02-13 | 13F | Police & Firemen's Retirement System of New Jersey | 43.746 | -6,42 | 2.810 | -5,58 | ||||
| 2026-01-20 | 13F | SOA Wealth Advisors, LLC. | 705 | 0,00 | 45 | 2,27 | ||||
| 2026-02-10 | 13F | Rothschild Investment Llc | 2.753 | -16,73 | 177 | -16,19 | ||||
| 2026-03-04 | 13F | Rehmann Capital Advisory Group | 0 | -100,00 | 0 | |||||
| 2026-02-13 | 13F | Great West Life Assurance Co /can/ | 91.604 | -36,07 | 6 | -44,44 | ||||
| 2026-02-13 | 13F | Slotnik Capital, LLC | 0 | -100,00 | 0 | |||||
| 2026-02-13 | 13F | Needham Investment Management Llc | 45.000 | 0,00 | 2.890 | 0,91 | ||||
| 2026-02-20 | 13F | Sunbelt Securities, Inc. | 12 | -72,73 | 1 | -100,00 | ||||
| 2026-02-09 | 13F | Harbour Investments, Inc. | 113 | 0,00 | 7 | 0,00 | ||||
| 2026-01-20 | 13F | Harbor Capital Advisors, Inc. | 2.699 | -90,90 | 0 | -100,00 | ||||
| 2026-02-06 | 13F | Envestnet Portfolio Solutions, Inc. | 15.154 | -36,02 | 973 | -35,43 | ||||
| 2026-02-13 | 13F | Vivaldi Asset Management, LLC | 17.040 | 1.094 | ||||||
| 2025-11-14 | 13F | Corton Capital Inc. | 0 | -100,00 | 0 | |||||
| 2026-04-22 | 13F | Sterling Capital Management LLC | 3.495 | -43,27 | 227 | -42,78 | ||||
| 2026-04-08 | 13F | Wealth Enhancement Advisory Services, Llc | 35.201 | -7,88 | 1.945 | -20,74 | ||||
| 2026-02-17 | 13F | Alpine Global Management, LLC | Put | 0 | -100,00 | 0 | ||||
| 2026-02-09 | 13F | AIA Group Ltd | 0 | -100,00 | 0 | |||||
| 2026-02-17 | 13F | Water Island Capital Llc | 298.440 | -0,74 | 19.169 | 0,16 | ||||
| 2026-02-17 | 13F | Alpine Global Management, LLC | 0 | -100,00 | 0 | -100,00 | ||||
| 2026-02-17 | 13F | Engineers Gate Manager LP | 0 | -100,00 | 0 | |||||
| 2026-02-02 | 13F | Wolverine Asset Management Llc | 70.476 | 44,22 | 4.527 | 45,53 | ||||
| 2026-04-20 | 13F | Jfs Wealth Advisors, Llc | 104 | 0,00 | 7 | 0,00 | ||||
| 2026-02-12 | 13F | Brown Brothers Harriman & Co | 1.137 | -4,69 | 73 | -2,67 | ||||
| 2025-11-14 | 13F | Slate Path Capital LP | 0 | -100,00 | 0 | |||||
| 2026-04-15 | 13F | Journey Strategic Wealth Llc | 5.359 | 26,03 | 348 | 27,47 | ||||
| 2026-04-27 | 13F | Y-Intercept (Hong Kong) Ltd | 101.046 | 183,72 | 6.562 | 186,88 | ||||
| 2026-02-13 | 13F | Fieldview Capital Management, LLC | 33.260 | 2.136 | ||||||
| 2026-04-07 | 13F | Park Avenue Securities Llc | 0 | -100,00 | 0 | |||||
| 2026-02-10 | 13F | Connor, Clark & Lunn Investment Management Ltd. | 8.353 | -71,41 | 537 | -71,17 | ||||
| 2025-11-14 | 13F | Balyasny Asset Management Llc | 0 | -100,00 | 0 | |||||
| 2026-02-13 | 13F | Thornburg Investment Management Inc | 3.950 | -25,22 | 254 | -24,70 | ||||
| 2025-11-14 | 13F | Point72 Europe (London) LLP | 219 | 14 | ||||||
| 2026-04-07 | 13F | U.S. Capital Wealth Advisors, LLC | 20.956 | 1.361 | ||||||
| 2026-03-26 | 13F/A | Peak6 Llc | 0 | -100,00 | 0 | -100,00 | ||||
| 2026-04-15 | 13F | Fortitude Family Office, LLC | 31 | 0,00 | 2 | 100,00 | ||||
| 2026-02-13 | 13F | Alberta Investment Management Corp | 450.000 | 200,00 | 28.904 | 202,74 | ||||
| 2026-04-20 | 13F | MBM Wealth Consultants, LLC | 797 | 52 | ||||||
| 2026-04-20 | 13F | State of Alaska, Department of Revenue | 51.986 | -2,82 | 3 | 0,00 | ||||
| 2026-02-12 | 13F | State Board Of Administration Of Florida Retirement System | 91.275 | -1,79 | 5.863 | -0,90 | ||||
| 2026-02-13 | 13F | Panagora Asset Management Inc | 3.324 | -13,62 | 214 | -12,70 | ||||
| 2026-02-13 | 13F | JustInvest LLC | 13.323 | -4,86 | 856 | -4,04 | ||||
| 2026-04-08 | 13F | Arlington Trust Co LLC | 4 | 0 | ||||||
| 2026-02-17 | 13F | Laird Norton Trust Company, Llc | 4.794 | 309 | ||||||
| 2026-02-09 | 13F | Huntington National Bank | 251.456 | -0,00 | 16.151 | 0,91 | ||||
| 2026-02-17 | 13F | Royal Bank Of Canada | 101.052 | -73,24 | 6.490 | -73,00 | ||||
| 2026-04-16 | 13F | Meadowbrook Advisors Group, LLC | 4.360 | 0,00 | 283 | 1,07 | ||||
| 2026-02-17 | 13F | Susquehanna International Group, Llp | Put | 0 | -100,00 | 0 | ||||
| 2026-04-27 | 13F | Leonteq Securities AG | 6 | -99,07 | 0 | -100,00 | ||||
| 2025-11-14 | 13F | Aigen Investment Management, Lp | 0 | -100,00 | 0 | |||||
| 2026-04-16 | 13F | Stanley-Laman Group, Ltd. | 0 | -100,00 | 0 | |||||
| 2026-02-17 | 13F | Sagefield Capital LP | 516.695 | 649,92 | 33.187 | 656,83 | ||||
| 2026-04-13 | 13F | Salem Investment Counselors Inc | 400 | 26 | ||||||
| 2026-01-26 | 13F | Private Trust Co Na | 3 | 0,00 | 0 | |||||
| 2026-02-02 | 13F | Cornerstone Planning Group LLC | 214 | 494,44 | 14 | 62,50 | ||||
| 2026-02-12 | 13F | Earnest Partners Llc | 7.851 | -99,56 | 504 | -99,55 | ||||
| 2026-02-17 | 13F | Mercer Global Advisors Inc /adv | 35.349 | 13,05 | 2.270 | 14,07 | ||||
| 2026-02-13 | 13F | Absolute Gestao de Investimentos Ltda. | 446.067 | 28.651 | ||||||
| 2026-02-17 | 13F | Utah Retirement Systems | 5.505 | 0,00 | 354 | 0,86 | ||||
| 2026-02-13 | 13F | Citigroup Inc | 158.121 | 52,29 | 10.156 | 53,69 | ||||
| 2026-02-10 | 13F | Natixis Advisors, L.p. | 34.930 | 1,79 | 2 | 0,00 | ||||
| 2026-02-13 | 13F | Citigroup Inc | Call | 47.100 | 0,00 | 3.025 | 0,93 | |||
| 2026-02-17 | 13F | Mirabella Financial Services Llp | 13.365 | 858 | ||||||
| 2026-02-13 | 13F | Treasurer of the State of North Carolina | 43.634 | -18,49 | 3 | -33,33 | ||||
| 2026-02-12 | 13F | Ci Investments Inc. | 0 | -100,00 | 0 | |||||
| 2025-10-28 | 13F | BRYN MAWR TRUST Co | 10.007 | -44,54 | 637 | -39,72 | ||||
| 2026-02-10 | 13F | State of Wyoming | 0 | -100,00 | 0 | |||||
| 2026-02-10 | 13F | Factorial Partners, Llc | 91.000 | 0,00 | 5.845 | 0,90 | ||||
| 2026-02-13 | 13F | Barclays Plc | 39.616 | -31,23 | 2.545 | -30,61 | ||||
| 2026-02-13 | 13F | Valueworks Llc | 0 | -100,00 | 0 | |||||
| 2026-02-13 | 13F | MAI Capital Management | 74 | -99,44 | 5 | -99,53 | ||||
| 2026-02-17 | 13F | Decagon Asset Management LLP | 0 | -100,00 | 0 | |||||
| 2026-02-17 | 13F | Raymond James Financial Inc | 272.848 | -36,61 | 17.525 | -36,03 | ||||
| 2026-02-17 | 13F | Gotham Asset Management, LLC | 429.626 | 82,86 | 27.595 | 84,53 | ||||
| 2026-02-09 | 13F | Cary Street Partner Investment Advisory Llc | 0 | -100,00 | 0 | |||||
| 2026-02-17 | 13F | Ameriprise Financial Inc | 197.397 | -30,62 | 12.680 | -29,99 | ||||
| 2026-02-13 | 13F | Financial Network Wealth Advisors LLC | 19 | 0,00 | 1 | 0,00 | ||||
| 2025-11-14 | 13F | Sapience Investments, LLC | 0 | -100,00 | 0 | |||||
| 2026-01-23 | 13F | Assetmark, Inc | 237 | 0,00 | 15 | 0,00 | ||||
| 2026-02-12 | 13F | BlackRock, Inc. | 12.484.617 | -7,53 | 801.887 | -6,69 | ||||
| 2026-02-17 | 13F | First Manhattan Co | 8.000 | 0,00 | 516 | 0,98 | ||||
| 2026-01-08 | 13F | Fulton Bank, N.a. | 0 | -100,00 | 0 | |||||
| 2026-04-15 | 13F | Trust Co Of Toledo Na /oh/ | 2.800 | 0,00 | 182 | 1,12 | ||||
| 2026-04-17 | 13F | HHM Wealth Advisors, LLC | 270 | 0,00 | 18 | 0,00 | ||||
| 2026-01-29 | 13F | Dunhill Financial, LLC | 2 | 0 | ||||||
| 2025-11-13 | 13F | Tribune Investment Group LP | 0 | -100,00 | 0 | |||||
| 2025-10-29 | 13F | Massachusetts Financial Services Co /ma/ | 0 | -100,00 | 0 | |||||
| 2026-01-28 | 13F | Arizona State Retirement System | 29.588 | -5,82 | 1.900 | -4,95 | ||||
| 2025-11-19 | 13F | Caitong International Asset Management Co., Ltd | 0 | -100,00 | 0 | |||||
| 2026-02-11 | 13F | Convergence Financial, LLC | 7.371 | 473 | ||||||
| 2026-04-27 | 13F | Td Private Client Wealth Llc | 22 | -29,03 | 1 | 0,00 | ||||
| 2026-02-02 | 13F | Principal Financial Group Inc | 501.123 | -16,98 | 32.187 | -16,23 | ||||
| 2026-02-12 | 13F | Sit Investment Associates Inc | 59.845 | -22,92 | 4 | -25,00 | ||||
| 2026-04-23 | 13F | CWM Advisors, LLC | 1.804 | 3,20 | 117 | 4,46 | ||||
| 2026-02-13 | 13F | Carmignac Gestion | 125.849 | 8.083 | ||||||
| 2026-02-17 | 13F | Angelo Gordon & Co., L.p. | 60.000 | 3.854 | ||||||
| 2026-02-17 | 13F | Susquehanna Fundamental Investments, Llc | 212.586 | 90,32 | 13.654 | 92,07 | ||||
| 2026-02-17 | 13F | SageView Advisory Group, LLC | 1.530 | 98 | ||||||
| 2026-02-13 | 13F | BNP Paribas Asset Management Holding S.A. | 1.669 | 39,08 | 0 | |||||
| 2026-02-24 | 13F | Villanova Investment Management Co LLC | 64.908 | -50,50 | 4.169 | -50,05 | ||||
| 2026-02-13 | 13F | Arvin Capital Management LP | 151.059 | -56,55 | 9.703 | -56,16 | ||||
| 2026-02-17 | 13F | FIL Ltd | 4.470.601 | 0,00 | 287.147 | 0,91 | ||||
| 2026-04-20 | 13F | Ronald Blue Trust, Inc. | 960 | 0,00 | 62 | 1,64 | ||||
| 2026-01-27 | 13F | Pavion Blue Capital, LLC | 5.500 | 0,00 | 353 | 0,86 | ||||
| 2025-11-14 | 13F | Point72 (DIFC) Ltd | 0 | -100,00 | 0 | |||||
| 2026-02-13 | 13F | Marnell Management LLC | 9.078 | 583 | ||||||
| 2026-02-10 | 13F | Nomura Asset Management Co Ltd | 1.650 | 0,00 | 106 | 0,00 | ||||
| 2026-02-10 | 13F | MUFG Securities EMEA plc | 155.000 | 9.956 | ||||||
| 2026-02-17 | 13F | Pentwater Capital Management LP | 2.240.000 | 1,82 | 143.875 | 2,75 | ||||
| 2026-01-23 | 13F | Transcend Wealth Collective, Llc | 0 | -100,00 | 0 | |||||
| 2026-02-17 | 13F | Holocene Advisors, LP | 390.605 | 25.089 | ||||||
| 2026-04-24 | 13F | ProShare Advisors LLC | 6.403 | 11,32 | 416 | 12,47 | ||||
| 2026-01-28 | 13F | WPG Advisers, LLC | 162 | 0,00 | 10 | 0,00 | ||||
| 2026-02-11 | 13F | Simplex Trading, Llc | Put | 2.500 | -73,40 | 161 | ||||
| 2026-02-11 | 13F | Simplex Trading, Llc | 1.696 | -48,79 | 109 | |||||
| 2026-02-17 | 13F | Shelton Capital Management | 3.428 | -8,17 | 220 | -7,17 | ||||
| 2026-02-13 | 13F | Rhumbline Advisers | 253.960 | -2,05 | 16.312 | -1,16 | ||||
| 2025-11-12 | 13F | Group One Trading, L.p. | 0 | -100,00 | 0 | -100,00 | ||||
| 2026-02-09 | 13F | Atlantic Trust, LLC | 86 | -23,89 | 6 | -28,57 | ||||
| 2025-11-12 | 13F | Waverton Investment Management Ltd | 426.769 | 5,18 | 27.179 | 14,58 | ||||
| 2026-01-07 | 13F | BCGM Wealth Management, LLC | 7.896 | -13,12 | 507 | -12,28 | ||||
| 2026-02-05 | 13F | GABELLI & Co INVESTMENT ADVISERS, INC. | 211.456 | 15,33 | 13.582 | 16,38 | ||||
| 2026-02-13 | 13F | Colony Group, LLC | 40.987 | 282,91 | 2.633 | 298,79 | ||||
| 2026-01-28 | 13F | Financial Perspectives, Inc | 60 | 0,00 | 4 | 0,00 | ||||
| 2026-02-06 | 13F | EverSource Wealth Advisors, LLC | 3.089 | 8,92 | 198 | 10,00 | ||||
| 2026-02-13 | 13F | SRS Capital Advisors, Inc. | 988 | -96,46 | 63 | -96,46 | ||||
| 2026-02-12 | 13F | Caerus Investment Advisors, LLC | 6.831 | 87,10 | 439 | 88,79 | ||||
| 2025-11-12 | 13F | Neo Ivy Capital Management | 0 | -100,00 | 0 | |||||
| 2026-02-09 | 13F | Coldstream Capital Management Inc | 0 | -100,00 | 0 | |||||
| 2026-04-15 | 13F | Merit Financial Group, LLC | 12.799 | -12,49 | 831 | -11,50 | ||||
| 2026-01-28 | 13F | DekaBank Deutsche Girozentrale | 5.063 | 0,00 | 0 | |||||
| 2026-02-09 | 13F | Hantz Financial Services, Inc. | 726 | 32,97 | 0 | |||||
| 2026-02-17 | 13F | PenderFund Capital Management Ltd. | 7.626 | 723,54 | 490 | 743,10 | ||||
| 2026-02-10 | 13F/A | Northwestern Mutual Wealth Management Co | 199 | 148,75 | 13 | 140,00 | ||||
| 2025-10-31 | 13F | ARGA Investment Management, LP | 0 | -100,00 | 0 | |||||
| 2026-02-12 | 13F | Great Lakes Advisors, Llc | 10.476 | -79,03 | 673 | -78,86 | ||||
| 2026-02-13 | 13F | Arrowstreet Capital, Limited Partnership | 111.012 | 68,48 | 7.130 | 70,05 | ||||
| 2025-11-12 | 13F | Brinker Capital Investments, LLC | 0 | -100,00 | 0 | |||||
| 2026-04-20 | 13F | Louisiana State Employees Retirement System | 46.700 | -2,91 | 3.033 | -1,85 | ||||
| 2026-02-17 | 13F | Qube Research & Technologies Ltd | 1.761.547 | 568,30 | 113.144 | 574,40 | ||||
| 2025-11-12 | 13F | Burren Capital Advisors Ltd | 54.421 | 3.464 | ||||||
| 2025-11-07 | 13F | Shell Asset Management Co | 852 | -63,73 | 0 | |||||
| 2026-02-06 | 13F | Bare Financial Services, Inc | 159 | 0,00 | 10 | 0,00 | ||||
| 2025-11-13 | 13F | Clear Street Markets Llc | 0 | -100,00 | 0 | |||||
| 2025-11-14 | 13F | Point72 Asia (Singapore) Pte. Ltd. | 131.762 | 8.387 | ||||||
| 2026-02-13 | 13F | Mariner, LLC | 72.119 | 60,26 | 4.632 | 61,73 | ||||
| 2026-02-11 | 13F | Simplex Trading, Llc | Call | 0 | -100,00 | 0 | ||||
| 2026-01-15 | 13F | Nisa Investment Advisors, Llc | 663 | 25,57 | 43 | 27,27 | ||||
| 2026-01-29 | 13F | Quest 10 Wealth Builders, Inc. | 0 | -100,00 | 0 | |||||
| 2026-02-03 | 13F | Crossmark Global Holdings, Inc. | 6.775 | 4,73 | 435 | 5,84 | ||||
| 2026-02-13 | 13F | Stifel Financial Corp | 31.144 | -43,27 | 2.000 | -42,76 | ||||
| 2026-01-16 | 13F | Perigon Wealth Management, LLC | 0 | -100,00 | 0 | |||||
| 2026-02-12 | 13F | CIBC Private Wealth Group, LLC | 183 | -8,04 | 12 | -8,33 | ||||
| 2026-02-17 | 13F | Prelude Capital Management, Llc | 52.456 | 44,05 | 3.369 | 45,40 | ||||
| 2026-02-06 | 13F | Handelsbanken Fonder AB | 26.453 | 0,00 | 2 | 0,00 | ||||
| 2026-02-13 | 13F | Neuberger Berman Group LLC | 23.095 | -3,51 | 1.483 | -2,63 | ||||
| 2026-01-30 | 13F | Bogart Wealth, LLC | 240 | 3,45 | 15 | 7,14 | ||||
| 2026-02-09 | 13F | Quest Partners LLC | 6.685 | -22,09 | 429 | -21,43 | ||||
| 2026-02-17 | 13F | Millennium Management Llc | 254.660 | 30,84 | 16.357 | 32,03 | ||||
| 2025-11-14 | 13F | Centiva Capital, LP | 0 | -100,00 | 0 | |||||
| 2026-02-17 | 13F | MIRAE ASSET GLOBAL ETFS HOLDINGS Ltd. | 58.829 | -3,38 | 3.779 | -2,50 | ||||
| 2026-01-30 | 13F | Innealta Capital, Llc | 0 | -100,00 | 0 | |||||
| 2026-02-11 | 13F | Parallel Advisors, LLC | 5.234 | 41,73 | 336 | 42,98 | ||||
| 2026-04-02 | 13F | Ares Financial Consulting, LLC | 49 | 0,00 | 3 | 0,00 | ||||
| 2026-04-13 | 13F | GoalVest Advisory LLC | 0 | -100,00 | 0 | |||||
| 2026-02-10 | 13F | Norges Bank | 1.333.070 | 85.623 | ||||||
| 2026-02-09 | 13F | New Age Alpha Advisors, LLC | 0 | -100,00 | 0 | |||||
| 2026-02-13 | 13F | Inspire Advisors, LLC | 3.504 | -4,24 | 225 | -3,02 | ||||
| 2026-02-10 | 13F | Quantbot Technologies LP | 45.462 | 190,96 | 2.920 | 193,76 | ||||
| 2026-02-17 | 13F | Lighthouse Investment Partners, LLC | 53.318 | 3.425 | ||||||
| 2025-11-04 | 13F | Guerra Advisors Inc | 15 | 1 | ||||||
| 2026-04-23 | 13F | Private Wealth Management Group, LLC | 341 | -0,29 | 22 | 4,76 | ||||
| 2026-04-07 | 13F | Signaturefd, Llc | 4.171 | 16,77 | 271 | 17,90 | ||||
| 2026-01-26 | 13F | KBC Group NV | 2.868 | 0,00 | 0 | |||||
| 2026-04-21 | 13F | Gagnon Securities Llc | 0 | -100,00 | 0 | |||||
| 2026-04-24 | 13F | Root Financial Partners, LLC | 481 | 31,78 | 31 | 34,78 | ||||
| 2026-02-13 | 13F | Walleye Trading LLC | Put | 0 | -100,00 | 0 | -100,00 | |||
| 2026-02-13 | 13F | Mml Investors Services, Llc | 10.891 | -79,00 | 700 | -78,82 | ||||
| 2026-02-17 | 13F | Advisor Group Holdings, Inc. | 15.485 | -11,45 | 995 | -7,28 | ||||
| 2026-02-13 | 13F | Bank Of Nova Scotia | 157.000 | 946,67 | 10.084 | 957,02 | ||||
| 2026-02-17 | 13F | Ameriflex Group, Inc. | 3 | -50,00 | 0 | |||||
| 2026-02-17 | 13F | Weiss Asset Management LP | 17.325 | 1.113 | ||||||
| 2026-02-17 | 13F | Aquatic Capital Management LLC | 0 | -100,00 | 0 | |||||
| 2026-02-17 | 13F | Voloridge Investment Management, Llc | 0 | -100,00 | 0 | |||||
| 2025-11-12 | 13F | Fox Run Management, L.l.c. | 0 | -100,00 | 0 | |||||
| 2026-01-27 | 13F | Evergreen Capital Management Llc | 6.152 | 12,41 | 396 | 13,18 | ||||
| 2026-02-10 | 13F | Goldman Sachs Group Inc | Call | 0 | -100,00 | 0 | -100,00 | |||
| 2026-02-05 | 13F | Dana Investment Advisors, Inc. | 72.048 | -3,60 | 4.628 | -2,73 | ||||
| 2026-02-04 | 13F | Fourth Dimension Wealth, LLC | 89 | 0,00 | 6 | 0,00 | ||||
| 2026-02-17 | 13F | Lakewood Capital Management, Lp | 485.878 | 0,00 | 31.208 | 0,91 | ||||
| 2026-02-12 | 13F | Summit Financial, LLC | 0 | -100,00 | 0 | |||||
| 2026-02-17 | 13F | Tower Research Capital LLC (TRC) | 1.231 | -75,97 | 79 | -75,77 | ||||
| 2026-02-11 | 13F | Greykasell Wealth Strategies, Inc. | 968 | 62 | ||||||
| 2026-04-15 | 13F | Bayforest Capital Ltd | 309 | 20 | ||||||
| 2026-02-13 | 13F | DLD Asset Management, LP | 31.149 | -40,55 | 2.001 | -40,03 | ||||
| 2026-02-02 | 13F | Fifth Third Bancorp | 2.061 | -94,10 | 132 | -94,06 | ||||
| 2026-04-15 | 13F | Cohen Klingenstein LLC | 20.160 | 0,00 | 1.309 | 1,16 | ||||
| 2026-04-21 | 13F | Verity Asset Management, Inc. | 5.753 | -29,05 | 374 | -28,27 | ||||
| 2026-02-12 | 13F | Commonwealth Equity Services, Llc | 10.041 | 0,13 | 645 | |||||
| 2026-02-17 | 13F | Creative Planning | 75.434 | 100,14 | 4.845 | 101,96 | ||||
| 2026-01-27 | 13F | Zurcher Kantonalbank (Zurich Cantonalbank) | 30.999 | 17,76 | 1.991 | 18,87 | ||||
| 2026-02-12 | 13F | MetLife Investment Management, LLC | 1.704 | -99,50 | 109 | -99,50 | ||||
| 2026-02-17 | 13F | Toronto Dominion Bank | 699.656 | 204,46 | 44.939 | 207,25 | ||||
| 2026-02-17 | 13F | Varenne Capital Partners | 45.888 | 2.949 | ||||||
| 2026-02-13 | 13F | Ubs Asset Management Americas Inc | 252.128 | -7,72 | 16.194 | -6,87 | ||||
| 2026-04-14 | 13F | Zrc Wealth Management, Llc | 235 | -24,19 | 15 | -21,05 | ||||
| 2026-02-17 | 13F | Highland Capital Management Fund Advisors, L.p. | 764.898 | 0,00 | 49.129 | 0,91 | ||||
| 2026-02-17 | 13F | Altshuler Shaham Ltd | 0 | -100,00 | 0 | |||||
| 2026-02-17 | 13F | Dark Forest Capital Management Lp | 0 | -100,00 | 0 | |||||
| 2026-02-06 | 13F | Larson Financial Group LLC | 213 | 3,90 | 14 | 0,00 | ||||
| 2026-04-24 | 13F | Oakworth Capital, Inc. | 108 | 0,00 | 7 | 16,67 | ||||
| 2026-02-12 | 13F | Nuveen, LLC | 216.087 | -24,32 | 13.879 | -23,63 | ||||
| 2026-02-05 | 13F | North Dakota State Investment Board | 3.686 | 237 | ||||||
| 2026-02-17 | 13F | Guggenheim Capital Llc | 6.901 | -2,99 | 443 | -1,99 | ||||
| 2026-02-13 | 13F | Yakira Capital Management, Inc. | 24.625 | 1.582 | ||||||
| 2026-02-17 | 13F | Meteora Capital, LLC | 75.000 | 276,88 | 4.817 | 280,49 | ||||
| 2026-01-26 | 13F | Whittier Trust Co Of Nevada Inc | 14 | -30,00 | 1 | -100,00 | ||||
| 2026-02-13 | 13F | Walleye Capital LLC | 0 | -100,00 | 0 | |||||
| 2026-04-27 | 13F | Qrg Capital Management, Inc. | 18.120 | -4,65 | 1.177 | -3,61 | ||||
| 2026-02-10 | 13F | Bank of New York Mellon Corp | 575.869 | -37,49 | 36.988 | -36,92 | ||||
| 2026-02-03 | 13F | Orion Capital Management LLC | 400 | 0,00 | 26 | 0,00 | ||||
| 2026-02-17 | 13F | Caption Management, LLC | Call | 50.000 | -33,33 | 3.212 | -32,73 | |||
| 2025-11-14 | 13F | Bayberry Capital Partners LP | 0 | -100,00 | 0 | |||||
| 2026-02-12 | 13F | Jane Street Group, Llc | 13.640 | -86,65 | 876 | -86,53 | ||||
| 2026-02-13 | 13F | Ingalls & Snyder Llc | 6.105 | -15,24 | 0 | |||||
| 2026-02-18 | 13F | GWM Advisors LLC | 98 | 15,29 | 6 | 20,00 | ||||
| 2026-02-13 | 13F | Hudson Bay Capital Management LP | 0 | -100,00 | 0 | |||||
| 2026-02-12 | 13F | Rossby Financial, LCC | 24 | 166,67 | 2 | |||||
| 2026-02-12 | 13F | Principal Securities, Inc. | 0 | -100,00 | 0 | -100,00 | ||||
| 2026-02-17 | 13F | Susquehanna International Group, Llp | 3.763 | -40,70 | 242 | -40,20 | ||||
| 2026-02-17 | 13F | Susquehanna International Group, Llp | Call | 55.900 | 251,57 | 3.590 | 254,74 | |||
| 2026-02-17 | 13F | Private Advisor Group, LLC | 0 | -100,00 | 0 | |||||
| 2026-02-13 | 13F | Pinnacle Wealth Planning Services, Inc. | 1.946 | 125 | ||||||
| 2026-02-11 | 13F | Franklin Resources Inc | 47.530 | -6,16 | 3.053 | -5,33 | ||||
| 2026-02-17 | 13F | Cobalt Capital Management, Inc. | 450.000 | -10,00 | 28.904 | -9,18 | ||||
| 2026-02-13 | 13F | Walleye Capital LLC | Call | 0 | -100,00 | 0 | ||||
| 2026-04-06 | 13F | GAMMA Investing LLC | 7.763 | 53,12 | 504 | 55,08 | ||||
| 2026-02-13 | 13F | Walleye Capital LLC | Put | 0 | -100,00 | 0 | ||||
| 2025-12-16 | 13F | Garde Capital, Inc. | 0 | -100,00 | 0 | |||||
| 2026-02-09 | 13F | Cooke & Bieler Lp | 0 | -100,00 | 0 | |||||
| 2026-02-18 | 13F | State of Tennessee, Treasury Department | 32.280 | -22,09 | 2.086 | -20,89 | ||||
| 2025-10-30 | 13F | Twin Peaks Wealth Advisors, LLC | 0 | -100,00 | 0 | |||||
| 2025-11-12 | 13F | Arvin Capital Management LP | Call | 0 | -100,00 | 0 | -100,00 | |||
| 2026-04-17 | 13F | Krilogy Financial LLC | 0 | -100,00 | 0 | |||||
| 2026-02-20 | 13F | Kovitz Investment Group Partners, LLC | 5.100 | -84,76 | 328 | -84,64 | ||||
| 2026-02-13 | 13F | Public Employees Retirement Association Of Colorado | 7.555 | 0,00 | 0 | |||||
| 2026-02-05 | 13F | Amalgamated Bank | 34.188 | 6,63 | 2 | 0,00 | ||||
| 2026-01-27 | 13F | Brighton Jones Llc | 0 | -100,00 | 0 | |||||
| 2026-01-23 | 13F | Westside Investment Management, Inc. | 25 | 2 | ||||||
| 2026-01-27 | 13F | WealthCollab, LLC | 285 | 0,00 | 18 | 0,00 | ||||
| 2026-01-29 | 13F | Vanguard Group Inc | 11.424.772 | -1,08 | 733.813 | -0,18 | ||||
| 2026-01-30 | 13F/A | M&t Bank Corp | 5.051 | -36,15 | 325 | -35,46 | ||||
| 2026-02-12 | 13F | Cloud Capital Management, LLC | 0 | -100,00 | 0 | |||||
| 2026-02-13 | 13F | Capula Management Ltd | 243.831 | 15.661 | ||||||
| 2026-02-12 | 13F | Marex Group plc | 3.432 | 220 | ||||||
| 2026-02-12 | 13F | Sepio Capital, LP | 6.095 | -1,44 | 391 | -0,51 | ||||
| 2026-02-11 | 13F | Group One Trading, L.p. | Call | 14.300 | -6,54 | 918 | -5,65 | |||
| 2026-04-21 | 13F | Vise Technologies, Inc. | 13.461 | 0,00 | 865 | 0,00 | ||||
| 2026-02-11 | 13F | Group One Trading, L.p. | Put | 100 | -97,62 | 6 | -97,75 | |||
| 2026-01-07 | 13F | Hilltop National Bank | 0 | -100,00 | 0 | |||||
| 2026-02-17 | 13F | T. Rowe Price Investment Management, Inc. | 0 | -100,00 | 0 | |||||
| 2026-02-10 | 13F | CIBC Asset Management Inc | 6.462 | -36,08 | 415 | -35,46 | ||||
| 2026-02-11 | 13F | Capital Research Global Investors | 0 | -100,00 | 0 | |||||
| 2026-04-23 | 13F | Farmers & Merchants Investments Inc | 60 | -7,69 | 4 | -25,00 | ||||
| 2026-02-12 | 13F | California Public Employees Retirement System | 208.485 | 4,86 | 13.391 | 5,81 | ||||
| 2026-02-17 | 13F | RMB Capital Management, LLC | 4.638 | 299 | ||||||
| 2026-02-17 | 13F | Cantor Fitzgerald, L. P. | 0 | -100,00 | 0 | |||||
| 2025-11-13 | 13F | Mackenzie Financial Corp | 0 | -100,00 | 0 | |||||
| 2026-01-09 | 13F | Park Place Capital Corp | 0 | -100,00 | 0 | |||||
| 2026-02-06 | 13F | Gsa Capital Partners Llp | 14.901 | 1 | ||||||
| 2026-02-17 | 13F | Moore Capital Management, Lp | 110.000 | -85,20 | 7.065 | -85,07 | ||||
| 2026-02-04 | 13F | Virginia Retirement Systems Et Al | 0 | -100,00 | 0 | |||||
| 2026-02-13 | 13F | Public Sector Pension Investment Board | 0 | -100,00 | 0 | |||||
| 2026-02-17 | 13F | TIG Advisors, LLC | 645.058 | 292,08 | 41.432 | 295,68 | ||||
| 2026-02-05 | 13F | Plante Moran Financial Advisors, LLC | 0 | -100,00 | 0 | |||||
| 2026-02-17 | 13F | Amundi | 95.982 | -35,91 | 6.165 | -35,37 | ||||
| 2026-02-05 | 13F | New York Life Investment Management Llc | 131.587 | 8.452 | ||||||
| 2026-02-12 | 13F | Bank Of Montreal /can/ | 16.755 | -77,14 | 1.076 | -76,93 | ||||
| 2026-02-17 | 13F | Miller Capital Partners, Inc. | 800 | 51 | ||||||
| 2026-02-09 | 13F | Legal & General Group Plc | 270.072 | -3,56 | 17.347 | -2,69 | ||||
| 2026-01-21 | 13F | Crews Bank & Trust | 0 | -100,00 | 0 | |||||
| 2026-02-13 | 13F | M3F, Inc. | 0 | -100,00 | 0 | |||||
| 2026-02-11 | 13F | Deutsche Bank Ag\ | 10.144 | 5,70 | 652 | 6,72 | ||||
| 2026-01-26 | 13F | Steinberganna Wealth Management | 0 | -100,00 | 0 | -100,00 | ||||
| 2026-02-04 | 13F | Swiss Life Asset Management Ltd | 4.787 | 0,00 | 307 | 0,99 | ||||
| 2026-01-22 | 13F | Bartlett & Co. Wealth Management Llc | 1.228 | 0,00 | 79 | 0,00 | ||||
| 2026-02-06 | 13F | HighTower Advisors, LLC | 5.361 | -0,63 | 344 | 0,29 | ||||
| 2026-02-17 | 13F | Man Group plc | 86.679 | 44,47 | 5.567 | 45,77 | ||||
| 2026-01-26 | 13F | Cwm, Llc | 60.051 | -7,01 | 4 | -25,00 | ||||
| 2026-01-28 | 13F | Teacher Retirement System Of Texas | 15.768 | -39,52 | 1.013 | -39,00 | ||||
| 2026-02-03 | 13F | SBI Securities Co., Ltd. | 489 | -1,21 | 31 | 0,00 | ||||
| 2025-11-14 | 13F | Peak6 Llc | Call | 0 | -100,00 | 0 | -100,00 | |||
| 2025-11-12 | 13F | Montag A & Associates Inc | 0 | -100,00 | 0 | -100,00 | ||||
| 2026-04-21 | 13F | PharVision Advisers, LLC | 0 | -100,00 | 0 | |||||
| 2026-02-09 | 13F | Royce & Associates Lp | 247.812 | -32,78 | 15.917 | -32,17 | ||||
| 2026-02-17 | 13F | Public Employees Retirement System Of Ohio | 33.811 | -3,38 | 2.172 | -2,51 | ||||
| 2025-11-14 | 13F | Caption Management, LLC | Put | 0 | -100,00 | 0 | -100,00 | |||
| 2026-02-06 | 13F | Covestor Ltd | 2.004 | -0,99 | 0 | |||||
| 2026-02-13 | 13F | Sei Investments Co | 85.631 | -74,09 | 5.500 | -73,86 | ||||
| 2025-11-14 | 13F | Cubist Systematic Strategies, LLC | 98.247 | -75,00 | 6.253 | -72,80 | ||||
| 2026-02-18 | 13F | Vermillion & White Wealth Management Group, LLC | 119 | 0,00 | 8 | 0,00 | ||||
| 2026-04-23 | 13F | SJS Investment Consulting Inc. | 55 | -51,33 | 4 | -57,14 | ||||
| 2025-11-14 | 13F | Caption Management, LLC | 0 | -100,00 | 0 | -100,00 | ||||
| 2026-02-02 | 13F | Sachetta, LLC | 15 | 0,00 | 1 | |||||
| 2026-01-22 | 13F | Personal Cfo Solutions, Llc | 0 | -100,00 | 0 | |||||
| 2026-04-27 | 13F | Osborne Partners Capital Management, Llc | 68.860 | -2,15 | 4.472 | -1,08 | ||||
| 2026-02-13 | 13F | State Street Corp | 3.345.915 | -1,74 | 215.658 | -0,84 | ||||
| 2026-02-13 | 13F | Marshall Wace, Llp | 255.140 | 16.388 | ||||||
| 2026-04-13 | 13F | Richard P Slaughter Associates Inc | 3.358 | -7,11 | 218 | -6,03 | ||||
| 2026-01-07 | 13F | Aventura Private Wealth, LLC | 0 | -100,00 | 0 | |||||
| 2026-04-10 | 13F | Abound Wealth Management | 4 | 0,00 | 0 | |||||
| 2026-02-17 | 13F | Bank Of America Corp /de/ | 274.674 | -66,32 | 17.642 | -66,02 | ||||
| 2026-02-24 | 13F | MidFirst Bank | 14 | 1 | ||||||
| 2026-02-17 | 13F | California State Teachers Retirement System | 100.076 | 2,33 | 6.428 | 3,24 | ||||
| 2026-02-17 | 13F | SummitTX Capital, L.P. | 80.000 | -11,11 | 5.138 | -10,30 | ||||
| 2026-04-08 | 13F | Parkside Investments, LLC | 114.024 | -28,19 | 7.405 | -27,40 | ||||
| 2026-02-17 | 13F | Janus Henderson Group Plc | 244.448 | 432,57 | 15.706 | 437,29 | ||||
| 2026-02-17 | 13F | Citadel Advisors Llc | 413.028 | 241,81 | 26.529 | 244,92 | ||||
| 2026-02-06 | 13F | Global Retirement Partners, LLC | 5.485 | 33,33 | 352 | 34,87 | ||||
| 2026-02-17 | 13F | Northern Trust Corp | 751.464 | -40,74 | 48.267 | -40,20 | ||||
| 2026-01-13 | 13F | Stephens Consulting, LLC | 0 | -100,00 | 0 | |||||
| 2026-02-13 | 13F | Westchester Capital Management, LLC | 334.421 | 117,58 | 21.480 | 119,55 | ||||
| 2026-02-13 | 13F | Squarepoint Ops LLC | 696.190 | 842,61 | 44.716 | 851,20 | ||||
| 2026-02-13 | 13F | Wells Fargo & Company/mn | 54.540 | -85,20 | 3.503 | -85,06 | ||||
| 2026-01-30 | 13F | Sage Rhino Capital Llc | 4.313 | 8,31 | 277 | 9,49 | ||||
| 2026-02-11 | 13F | O'shaughnessy Asset Management, Llc | 5.958 | 44,96 | 383 | 46,36 | ||||
| 2026-02-11 | 13F | Manchester Capital Management LLC | 27 | 2 | ||||||
| 2026-04-23 | 13F | Marquette Asset Management, LLC | 14 | 1 | ||||||
| 2026-02-11 | 13F | Bck Capital Management Lp | 0 | -100,00 | 0 | |||||
| 2026-02-10 | 13F | Reinhart Partners, Inc. | 0 | -100,00 | 0 | |||||
| 2026-01-30 | 13F | Mitsubishi UFJ Trust & Banking Corp | 0 | -100,00 | 0 | |||||
| 2026-04-08 | 13F | DiNuzzo Private Wealth, Inc. | 27 | 0,00 | 2 | 0,00 | ||||
| 2026-01-30 | 13F | State of New Jersey Common Pension Fund D | 33.865 | -6,29 | 2.175 | -5,43 | ||||
| 2026-04-14 | 13F | Nbc Securities, Inc. | 7.379 | -49,60 | 479 | -49,04 | ||||
| 2026-02-17 | 13F | Adage Capital Partners Gp, L.l.c. | 0 | -100,00 | 0 | |||||
| 2025-11-13 | 13F | Canada Pension Plan Investment Board | 0 | -100,00 | 0 | |||||
| 2026-02-17 | 13F | Signature Equity Partners, LLC | 17 | 1 | ||||||
| 2025-11-14 | 13F | EAM Investors, LLC | 0 | -100,00 | 0 | |||||
| 2025-11-14 | 13F | Scopia Capital Management Lp | 0 | -100,00 | 0 | |||||
| 2025-11-14 | 13F | Toroso Investments, LLC | 0 | -100,00 | 0 | -100,00 | ||||
| 2026-04-16 | 13F | Evolve Private Wealth, Llc | 3.091 | -44,01 | 201 | -43,66 | ||||
| 2026-02-17 | 13F | Magnetar Financial LLC | 1.586.800 | 0,46 | 101.920 | 1,38 | ||||
| 2026-02-13 | 13F | Morgan Stanley | 942.431 | 0,34 | 60.532 | 1,25 | ||||
| 2026-02-17 | 13F | Point72 Asset Management, L.P. | 195.306 | 12.545 | ||||||
| 2026-02-13 | 13F | Agman Capital Llc | 70.631 | 4.552 | ||||||
| 2026-02-17 | 13F | Hbk Investments L P | 4.602.260 | 67,35 | 295.603 | 68,88 | ||||
| 2026-02-17 | 13F | Twinbeech Capital Lp | 0 | -100,00 | 0 | |||||
| 2026-02-11 | 13F | Jessup Wealth Management, Inc | 321 | 21 | ||||||
| 2026-02-13 | 13F | Bridgewater Associates, LP | 10.412 | 210,62 | 669 | 213,62 | ||||
| 2026-04-16 | 13F | SG Americas Securities, LLC | 1.081.868 | 387,31 | 70 | 400,00 | ||||
| 2026-02-17 | 13F | Susquehanna Portfolio Strategies, LLC | 34.473 | -24,51 | 2.214 | -23,81 | ||||
| 2026-02-19 | 13F | Invesco Ltd. | 379.656 | -68,08 | 24.385 | -67,79 | ||||
| 2026-04-24 | 13F | Strs Ohio | 0 | -100,00 | 0 | |||||
| 2026-02-12 | 13F | Skba Capital Management Llc | 0 | -100,00 | 0 | |||||
| 2026-02-12 | 13F | Groupe la Francaise | 106.500 | 255,00 | 6.840 | 258,30 | ||||
| 2026-02-12 | 13F | Skopos Labs, Inc. | 3.184 | 204 | ||||||
| 2026-02-13 | 13F | Atlas Capital Advisors Llc | 9.067 | -19,30 | 582 | -11,42 | ||||
| 2026-02-13 | 13F | Golden State Wealth Management, LLC | 17 | 0,00 | 1 | 0,00 | ||||
| 2026-02-11 | 13F | Winton Capital Group Ltd | 192.435 | 14,66 | 12.360 | 15,71 | ||||
| 2026-02-17 | 13F | Cetera Investment Advisers | 19.215 | -56,63 | 1.234 | -56,23 | ||||
| 2026-04-21 | 13F | Alpine Associates Management Inc. | 1.382.306 | 23,57 | 89.767 | 24,93 | ||||
| 2026-02-17 | 13F | Advisory Services Network, LLC | 0 | -100,00 | 0 | |||||
| 2026-02-02 | 13F | Danske Bank A/s | 1.300 | -93,33 | 83 | -93,30 | ||||
| 2026-02-17 | 13F | Snowden Capital Advisors LLC | 5.886 | -33,04 | 379 | -32,56 | ||||
| 2026-02-11 | 13F | Picton Mahoney Asset Management | 642.725 | 221,36 | 41.282 | 343.916,67 | ||||
| 2026-02-18 | 13F | First Citizens Bank & Trust Co | 13.671 | -10,29 | 878 | -9,39 | ||||
| 2025-11-17 | 13F | LGT Financial Advisors LLC | 0 | -100,00 | 0 | |||||
| 2026-04-15 | 13F | Activest Wealth Management | 96 | 5,49 | 6 | 20,00 | ||||
| 2026-02-05 | 13F | Thrivent Financial For Lutherans | 110.132 | -3,11 | 7 | 0,00 | ||||
| 2026-02-17 | 13F | Wiley Bros.-aintree Capital, Llc | 3.152 | -73,46 | 202 | -73,25 | ||||
| 2026-04-21 | 13F | Gilpin Wealth Management, Llc | 11 | 37,50 | 1 | |||||
| 2026-04-15 | 13F | FNY Investment Advisers, LLC | Call | 0 | -100,00 | 0 | ||||
| 2026-02-05 | 13F | AlphaCore Capital LLC | 3.492 | 56,24 | 225 | 57,75 | ||||
| 2026-02-11 | 13F | Ing Groep Nv | 21.500 | 1.381 | ||||||
| 2026-02-11 | 13F | Lyrical Asset Management Lp | 0 | -100,00 | 0 | -100,00 | ||||
| 2026-02-10 | 13F | Savant Capital, LLC | 5.105 | 19,14 | 328 | 20,22 | ||||
| 2026-02-17 | 13F | Woodline Partners LP | 66.830 | 4.292 | ||||||
| 2026-04-15 | 13F | Douglas Lane & Associates, LLC | 24.991 | -47,95 | 1.623 | -47,39 | ||||
| 2026-02-10 | 13F | Envestnet Asset Management Inc | 154.785 | -76,05 | 9.942 | -75,83 | ||||
| 2026-04-14 | 13F | Bay Harbor Wealth Management, LLC | 7 | 0,00 | 0 | |||||
| 2026-02-17 | 13F | Alliancebernstein L.p. | 64.186 | 17,49 | 4.123 | 18,55 | ||||
| 2026-01-29 | 13F | Copeland Capital Management, LLC | 604.892 | -47,04 | 38.852 | -46,56 | ||||
| 2026-02-05 | 13F | Gabelli Funds Llc | 313.617 | -1,65 | 20.144 | -0,75 | ||||
| 2026-02-17 | 13F | DV Trading LLC | 500 | 32 | ||||||
| 2026-04-09 | 13F | PFS Partners, LLC | 750 | 0,00 | 49 | 0,00 | ||||
| 2026-04-24 | 13F | Yousif Capital Management, Llc | 30.103 | -0,01 | 1.955 | 0,93 | ||||
| 2025-11-12 | 13F | Monetary Management Group Inc | 0 | -100,00 | 0 | -100,00 | ||||
| 2026-02-13 | 13F | Transamerica Financial Advisors, Inc. | 231 | 15 | ||||||
| 2026-02-11 | 13F | SOUTH STATE Corp | 12 | 0,00 | 1 | |||||
| 2025-11-14 | 13F | Wolverine Trading, Llc | Call | 15.900 | 54,37 | 1.012 | 67,38 | |||
| 2025-11-14 | 13F | Wolverine Trading, Llc | Put | 4.800 | -36,84 | 305 | -31,61 | |||
| 2026-02-03 | 13F | Bokf, Na | 14.806 | -9,52 | 951 | -8,74 | ||||
| 2026-02-17 | 13F | Kintayl Capital LP | 47.011 | 3.020 | ||||||
| 2026-04-13 | 13F | Mather Group, Llc. | 453 | 29 | ||||||
| 2026-02-05 | 13F | Allworth Financial LP | 3.605 | 61,95 | 232 | 63,83 | ||||
| 2026-03-17 | 13F | Cornerstone Planning, LLC | 3.600 | 231 | ||||||
| 2026-02-05 | 13F | High Note Wealth, LLC | 187 | 0,00 | 12 | 9,09 | ||||
| 2026-02-17 | 13F | Boothbay Fund Management, Llc | 43.866 | 208,24 | 2.818 | 211,27 | ||||
| 2026-04-27 | 13F | HB Wealth Management, LLC | 5.986 | 84,81 | 389 | 86,54 | ||||
| 2026-01-30 | 13F | Torren Management, LLC | 290 | 19 | ||||||
| 2025-11-06 | 13F | Versor Investments LP | 0 | -100,00 | 0 | |||||
| 2026-02-12 | 13F | Skandinaviska Enskilda Banken AB (publ) | 36.147 | 261,47 | 2.322 | 264,94 | ||||
| 2026-04-23 | 13F | Forum Financial Management, LP | 0 | -100,00 | 0 | |||||
| 2026-02-11 | 13F | Waddell & Associates, Llc | 3.254 | 209 | ||||||
| 2026-04-10 | 13F | Oak Thistle LLC | 0 | -100,00 | 0 | |||||
| 2026-02-17 | 13F | Citadel Advisors Llc | Put | 0 | -100,00 | 0 | ||||
| 2026-02-17 | 13F | Trexquant Investment LP | 58.674 | 145,97 | 3.769 | 148,22 | ||||
| 2026-02-13 | 13F | Manufacturers Life Insurance Company, The | 0 | -100,00 | 0 | |||||
| 2026-02-13 | 13F | Charles Schwab Investment Management Inc | 1.194.242 | 0,34 | 76.706 | 1,26 | ||||
| 2025-11-03 | 13F | Summit Global Investments | 0 | -100,00 | 0 | |||||
| 2026-01-12 | 13F | Rialto Wealth Management, LLC | 22 | 0,00 | 1 | 0,00 | ||||
| 2025-11-14 | 13F | Wetherby Asset Management Inc | 0 | -100,00 | 0 | |||||
| 2026-04-22 | 13F | Spire Wealth Management | 91 | 0,00 | 6 | 0,00 | ||||
| 2026-01-28 | 13F | waypoint wealth counsel | 0 | -100,00 | 0 | |||||
| 2026-02-17 | 13F | XTX Topco Ltd | 14.570 | 936 | ||||||
| 2026-04-01 | 13F | Burkett Financial Services, Llc | 778 | 24,48 | 51 | 25,00 | ||||
| 2026-02-10 | 13F | Mutual Of America Capital Management Llc | 12.008 | 2,04 | 771 | 2,94 | ||||
| 2026-01-15 | 13F | Allspring Global Investments Holdings, LLC | 0 | -100,00 | 0 | |||||
| 2025-11-14 | 13F | Texas Permanent School Fund | 0 | -100,00 | 0 | |||||
| 2026-02-11 | 13F | Jpmorgan Chase & Co | 843.123 | 28,90 | 54.154 | 30,07 | ||||
| 2026-02-13 | 13F | Parkside Financial Bank & Trust | 595 | 6,06 | 38 | 8,57 | ||||
| 2026-04-15 | 13F | FNY Investment Advisers, LLC | 21.885 | 1 | ||||||
| 2026-04-15 | 13F | FNY Investment Advisers, LLC | Put | 31 | -41,51 | 0 | ||||
| 2026-04-27 | 13F | Sound Income Strategies, LLC | 174 | 0,00 | 11 | 0,00 | ||||
| 2025-11-13 | 13F | Farringdon Capital, Ltd. | 0 | -100,00 | 0 | |||||
| 2026-02-12 | 13F | Swiss National Bank | 211.700 | 2,87 | 13.597 | 3,80 | ||||
| 2025-11-14 | 13F | Binnacle Investments Inc | 506 | 12,95 | 32 | 23,08 | ||||
| 2026-04-07 | 13F | Eastern Bank | 0 | -100,00 | 0 | |||||
| 2026-04-13 | 13F | Hm Payson & Co | 51 | 0,00 | 3 | 0,00 | ||||
| 2026-04-17 | 13F | Bell Investment Advisors, Inc | 190 | 4,97 | 12 | 9,09 | ||||
| 2026-02-04 | 13F | Oregon Public Employees Retirement Fund | 23.998 | 1,27 | 1.541 | 2,19 | ||||
| 2026-02-17 | 13F | Citadel Advisors Llc | Call | 0 | -100,00 | 0 | ||||
| 2025-11-13 | 13F | Empowered Funds, LLC | 0 | -100,00 | 0 | |||||
| 2025-11-14 | 13F | Algert Global Llc | 0 | -100,00 | 0 | |||||
| 2026-02-12 | 13F | Dimensional Fund Advisors Lp | 3.783.714 | -42,60 | 243.027 | -42,07 | ||||
| 2026-02-17 | 13F | Quantinno Capital Management LP | 171.254 | 44,26 | 11.000 | 45,57 | ||||
| 2026-02-11 | 13F | Illinois Municipal Retirement Fund | 56.878 | 10,53 | 3.653 | 11,54 | ||||
| 2026-02-04 | 13F | LRI Investments, LLC | 182 | -85,45 | 12 | -86,08 | ||||
| 2026-01-30 | 13F | Archer Investment Corp | 3.415 | 0,00 | 219 | 0,92 | ||||
| 2026-02-17 | 13F | DZ BANK AG Deutsche Zentral Genossenschafts Bank, Frankfurt am Main | 0 | -100,00 | 0 | |||||
| 2026-02-05 | 13F | Atria Investments Llc | 0 | -100,00 | 0 | |||||
| 2026-02-17 | 13F | LMR Partners LLP | 564.090 | 1.028,18 | 36.232 | 1.038,62 | ||||
| 2026-02-17 | 13F | Spears Abacus Advisors LLC | 118.079 | -44,12 | 7.584 | -43,61 | ||||
| 2026-02-09 | 13F | Keating Financial Advisory Services, Inc. | 53 | 3 | ||||||
| 2025-11-12 | 13F | Cedar Wealth Management, LLC | 0 | -100,00 | 0 | -100,00 | ||||
| 2026-02-17 | 13F | Jump Financial, LLC | 145.136 | 80,74 | 9.322 | 82,39 | ||||
| 2026-02-17 | 13F | Two Sigma Investments, Lp | 2.134.448 | 796,74 | 137.096 | 804,92 | ||||
| 2026-01-23 | 13F | High Ground Investment Management LLP | 0 | -100,00 | 0 | |||||
| 2026-02-17 | 13F/A | Uniplan Investment Counsel, Inc. | 26.221 | -1,71 | 1.684 | -0,77 | ||||
| 2025-11-13 | 13F | Quadrature Capital Ltd | 0 | -100,00 | 0 | |||||
| 2026-04-13 | 13F | Massmutual Trust Co Fsb/adv | 282 | 21,03 | 18 | 28,57 | ||||
| 2026-04-13 | 13F | True Wealth Design, LLC | 396 | -15,57 | 26 | -16,67 | ||||
| 2026-02-17 | 13F | Maryland State Retirement & Pension System | 20.343 | 1,62 | 1.307 | 2,51 | ||||
| 2026-02-17 | 13F | Captrust Financial Advisors | 14.662 | -52,22 | 942 | -51,82 | ||||
| 2026-02-17 | 13F | London & Capital Asset Management Ltd | 130.591 | 8.390 | ||||||
| 2026-02-24 | 13F | DGS Capital Management, LLC | 10.809 | 93,36 | 694 | 95,49 | ||||
| 2026-02-13 | 13F | Smartleaf Asset Management LLC | 199 | -78,92 | 13 | -80,00 | ||||
| 2026-01-27 | 13F | Regions Financial Corp | 11.173 | -85,10 | 718 | -84,97 | ||||
| 2025-11-14 | 13F | Natixis | 0 | -100,00 | 0 | |||||
| 2026-02-17 | 13F | Lazard Asset Management Llc | 0 | -100,00 | 0 | |||||
| 2026-02-09 | 13F | Annis Gardner Whiting Capital Advisors, LLC | 51 | 0,00 | 3 | 0,00 | ||||
| 2026-02-17 | 13F | Mork Capital Management, LLC | 45.000 | 0,00 | 2.890 | 0,91 | ||||
| 2026-04-20 | 13F | Barton Investment Management | 340.033 | -15,68 | 22.082 | -14,75 | ||||
| 2026-04-22 | 13F | Pictet Asset Management Holding SA | 16.325 | 5,02 | 1.060 | 6,21 | ||||
| 2026-02-23 | 13F | Virtu Financial LLC | 13.184 | 149,08 | 1 | |||||
| 2026-02-10 | 13F | Goldman Sachs Group Inc | 504.011 | -45,09 | 32.373 | -44,59 | ||||
| 2026-02-17 | 13F | D. E. Shaw & Co., Inc. | 0 | -100,00 | 0 | |||||
| 2025-11-14 | 13F | Peak6 Llc | Put | 0 | -100,00 | 0 | -100,00 | |||
| 2026-02-05 | 13F | Bessemer Group Inc | 5.488 | 0,83 | 0 | |||||
| 2026-02-14 | 13F | Rockefeller Capital Management L.P. | 6.210 | -13,94 | 399 | -13,29 | ||||
| 2026-02-12 | 13F | Gardner Lewis Asset Management L P | 103.926 | 6.675 | ||||||
| 2026-02-17 | 13F | Price T Rowe Associates Inc /md/ | 86.070 | 4,19 | 6 | 0,00 |