Grundlæggende statistik
| Institutionelle aktier (lange) | 21.098.857 (ex 13D/G) - change of -3,30MM shares -13,52% MRQ |
| Institutionel værdi (lang) | $ 448.162 USD ($1000) |
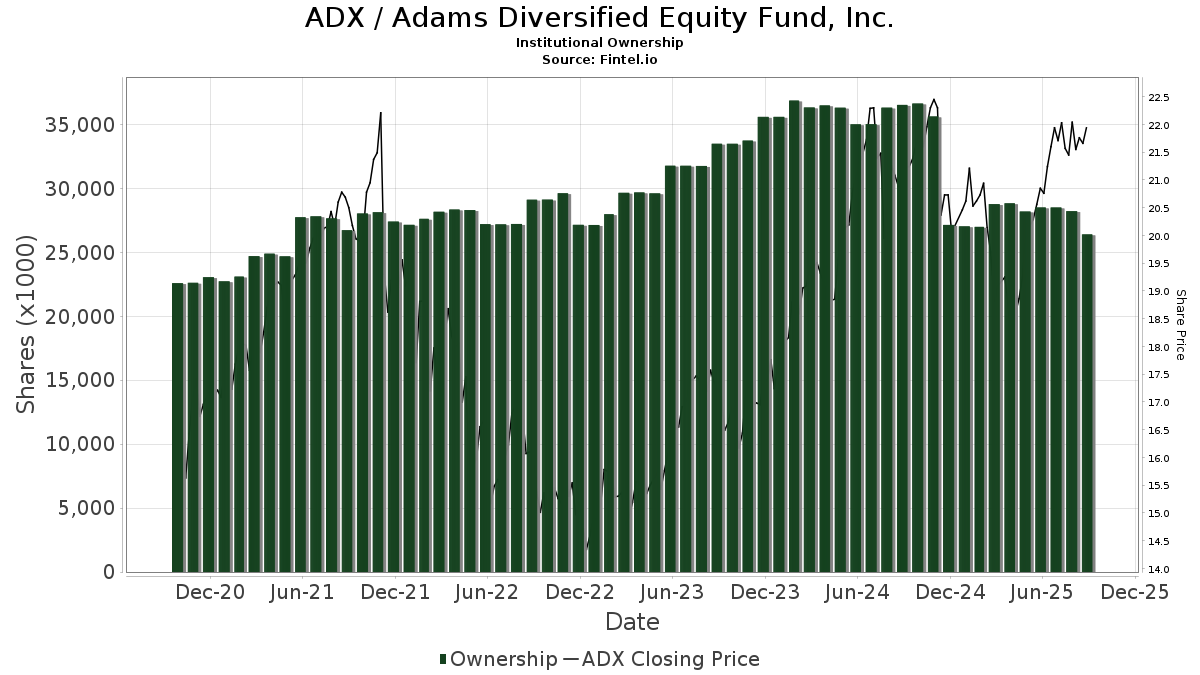
Institutionelt ejerskab og aktionærer
Adams Diversified Equity Fund, Inc. (US:ADX) har 198 institutionelle ejere og aktionærer, der har indsendt 13D/G- eller 13F-formularer til Securities Exchange Commission (SEC). Disse institutioner har i alt 21,098,857 aktier. Største aktionærer omfatter Lazard Asset Management Llc, Morgan Stanley, Raymond James Financial Inc, Cohen & Steers, Inc., Bensler, LLC, Royal Bank Of Canada, Blue Bell Private Wealth Management, Llc, 1607 Capital Partners, LLC, LPL Financial LLC, and Stifel Financial Corp .
Adams Diversified Equity Fund, Inc. (NYSE:ADX) institutionel ejerskabsstruktur viser aktuelle positioner i virksomheden efter institutioner og fonde, samt seneste ændringer i positionsstørrelse. Større aktionærer kan omfatte individuelle investorer, investeringsforeninger, hedgefonde eller institutioner. Skema 13D angiver, at investoren besidder (eller besidder) mere end 5 % af virksomheden og har til hensigt (eller har til hensigt at) aktivt at forfølge en ændring i forretningsstrategi. Skema 13G indikerer en passiv investering på over 5%.
The share price as of April 29, 2026 is 23,80 / share. Previously, on April 30, 2025, the share price was 18,86 / share. This represents an increase of 26,19% over that period.
Fondens stemningsscore
Fund Sentiment Score (fka Ownership Accumulation Score) finder de aktier, der bliver mest købt af fonde. Det er resultatet af en sofistikeret, multi-faktor kvantitativ model, der identificerer virksomheder med de højeste niveauer af institutionel akkumulering. Scoringsmodellen bruger en kombination af den samlede stigning i oplyste ejere, ændringerne i porteføljeallokeringer i disse ejere og andre målinger. Tallet går fra 0 til 100, hvor højere tal indikerer et højere niveau af akkumulering for sine jævnaldrende, og 50 er gennemsnittet.
Opdateringsfrekvens: Dagligt
Se Ownership Explorer, som giver en liste over højest rangerende virksomheder.
AI+ Ask Fintel’s AI assistant about Adams Diversified Equity Fund, Inc..
Select a question to share a public post with an AI-crafted answer.
Thinking of good questions…
Institutionel Put/Call-forhold
Ud over at indberette standardaktie- og gældsudstedelser skal institutter med mere end 100 mill. aktiver under forvaltning også oplyse deres put- og call-optionsbeholdninger. Da salgsoptioner generelt indikerer negativ stemning, og købsoptioner indikerer positiv stemning, kan vi få en fornemmelse af den overordnede institutionelle stemning ved at plotte forholdet mellem put og kald. Diagrammet til højre viser det historiske put/call-forhold for dette instrument.
Brug af Put/Call Ratio som en indikator for investorernes stemning overvinder en af de vigtigste mangler ved at bruge totalt institutionelt ejerskab, som er, at en betydelig mængde af aktiver under forvaltning investeres passivt for at spore indekser. Passivt forvaltede fonde køber typisk ikke optioner, så indikatoren for put/call-forholdet følger mere nøje følelsen af aktivt forvaltede fonde.
13F og NPORT arkivering
Detaljer om 13F-arkivering er gratis. Detaljer om NP-ansøgninger kræver et premium-medlemskab. Grønne rækker angiver nye positioner. Røde rækker angiver lukkede positioner. Klik på linket ikon for at se den fulde transaktionshistorik.
Opgrader
for at låse premium-data op og eksportere til Excel ![]() .
.
| Fil dato | Kilde | Investor | Type | Gennemsnitlig pris (Øst) |
Aktier | Δ Aktier (%) |
Rapporteret Værdi ($1000) |
Δ Værdi (%) |
Port Alloc (%) |
|
|---|---|---|---|---|---|---|---|---|---|---|
| 2026-04-27 | 13F | Sound Income Strategies, LLC | 695 | 13,01 | 16 | 7,14 | ||||
| 2026-04-15 | 13F | Merit Financial Group, LLC | 36.351 | -13,66 | 796 | -18,96 | ||||
| 2026-04-24 | 13F | Means Investment Co., Inc. | 62.535 | 0,00 | 1.369 | -6,17 | ||||
| 2026-02-09 | 13F | GatePass Capital, LLC | 298.780 | 0,13 | 6.968 | 4,72 | ||||
| 2026-02-17 | 13F | Captrust Financial Advisors | 15.889 | 0,31 | 371 | 4,82 | ||||
| 2026-02-23 | 13F | Virtu Financial LLC | 13.277 | 0 | ||||||
| 2026-02-13 | 13F | Colony Group, LLC | 97.602 | 90,41 | 2.276 | 99,13 | ||||
| 2026-04-24 | 13F | Bayban | 2.434 | 0,00 | 53 | -5,36 | ||||
| 2025-11-14 | 13F | Wetherby Asset Management Inc | 13.203 | 8,19 | 294 | 11,36 | ||||
| 2026-04-16 | 13F | Allegheny Financial Group LTD | 18.473 | 0,00 | 404 | -6,05 | ||||
| 2026-04-13 | 13F | Massmutual Trust Co Fsb/adv | 44.093 | -2,67 | 965 | -8,62 | ||||
| 2026-02-12 | 13F | CIBC Private Wealth Group, LLC | 1.015 | -88,67 | 24 | -88,44 | ||||
| 2026-04-22 | 13F | Uniting Wealth Partners, LLC | 22.756 | 2,02 | 498 | -4,23 | ||||
| 2025-11-14 | 13F | Aqr Capital Management Llc | 0 | -100,00 | 0 | |||||
| 2026-02-06 | 13F | Pnc Financial Services Group, Inc. | 24.000 | -10,98 | 560 | -6,99 | ||||
| 2026-04-29 | 13F | Delta Capital Management Llc | 105.466 | 0,00 | 2 | 0,00 | ||||
| 2026-04-16 | 13F | Evolve Private Wealth, Llc | 82.413 | -0,47 | 1.804 | -6,53 | ||||
| 2026-02-12 | 13F | Advisors Asset Management, Inc. | 387.161 | 1,88 | 9.029 | 6,54 | ||||
| 2026-04-10 | 13F | Smh Capital Advisors Inc | 288 | -97,78 | 288 | -4,97 | ||||
| 2026-02-10 | 13F | Rothschild Investment Llc | 1.364 | -37,00 | 32 | -35,42 | ||||
| 2026-02-10 | 13F/A | Northwestern Mutual Wealth Management Co | 21.805 | -55,57 | 508 | -53,56 | ||||
| 2026-02-11 | 13F | Jpmorgan Chase & Co | 14.339 | 8,88 | 334 | 13,99 | ||||
| 2026-04-28 | 13F | Abel Hall, LLC | 11.200 | 0,00 | 245 | -6,13 | ||||
| 2026-02-17 | 13F | Tower Research Capital LLC (TRC) | 20 | 25,00 | 0 | |||||
| 2026-02-05 | 13F | Allworth Financial LP | 8.126 | -20,07 | 190 | -16,37 | ||||
| 2026-04-10 | 13F | Sterling Manor Financial, LLC | 12.598 | 276 | ||||||
| 2026-04-20 | 13F | Ronald Blue Trust, Inc. | 27.939 | 2,02 | 612 | -4,23 | ||||
| 2026-04-16 | 13F | Diversified Trust Co | 65.351 | 2,02 | 1.431 | -4,22 | ||||
| 2026-02-13 | 13F | Morgan Stanley | 1.858.871 | -21,36 | 43.349 | -17,76 | ||||
| 2026-02-03 | 13F | Sequoia Financial Advisors, LLC | 9.143 | 0,00 | 213 | 4,93 | ||||
| 2026-04-28 | 13F | Westfuller Advisors, LLC | 1.328 | 2,00 | 29 | -3,33 | ||||
| 2026-04-24 | 13F | Cannon Advisors, Inc. | 21.885 | -4,47 | 479 | -9,45 | ||||
| 2026-04-15 | 13F | Silverlake Wealth Management Llc | 10.821 | 0,00 | 237 | -6,35 | ||||
| 2026-04-23 | 13F | Vista Investment Partners Ii, Llc | 10.394 | 0,00 | 228 | -6,20 | ||||
| 2026-04-16 | 13F | Uhlmann Price Securities, Llc | 34.195 | 1,88 | 749 | -4,35 | ||||
| 2026-04-13 | 13F | Stolper Co | 103.675 | 2,82 | 2 | 0,00 | ||||
| 2026-03-31 | 13F | Hamrick Investment Counsel, llc | 12.051 | 281 | ||||||
| 2026-02-02 | 13F | Fifth Third Bancorp | 37.594 | 0,21 | 877 | 4,78 | ||||
| 2026-02-13 | 13F | Umb Bank N A/mo | 213.801 | 8.591,10 | 4.986 | 9.131,48 | ||||
| 2026-02-13 | 13F | Generation Capital Management LLC | 43.896 | -5,54 | 1.024 | -1,25 | ||||
| 2026-04-17 | 13F | Mezzasalma Advisors, LLC | 20.659 | 1,73 | 452 | -4,24 | ||||
| 2026-02-05 | 13F | Dana Investment Advisors, Inc. | 9.103 | 212 | ||||||
| 2026-02-13 | 13F | Mariner, LLC | 45.557 | 6,85 | 1.062 | 11,79 | ||||
| 2026-01-26 | 13F | Valmark Advisers, Inc. | 9.797 | 0,00 | 228 | 4,59 | ||||
| 2026-02-17 | 13F | Twin Focus Capital Partners, Llc | 40.205 | 0,00 | 938 | 4,58 | ||||
| 2026-01-30 | 13F | Us Bancorp \de\ | 7.911 | 3,55 | 184 | 8,24 | ||||
| 2026-02-12 | 13F | Steward Partners Investment Advisory, Llc | 8.463 | -9,86 | 197 | -5,74 | ||||
| 2026-04-28 | 13F | Kingswood Wealth Advisors, Llc | 15.304 | 22,59 | 335 | 15,12 | ||||
| 2026-02-13 | 13F | Mml Investors Services, Llc | 32.763 | 1,35 | 764 | 6,11 | ||||
| 2026-02-17 | 13F | Balyasny Asset Management Llc | 0 | -100,00 | 0 | |||||
| 2026-04-23 | 13F | West Bancorporation Inc | 46.890 | 0,00 | 1.026 | -6,13 | ||||
| 2025-11-06 | 13F | Whipplewood Advisors, LLC | 0 | -100,00 | 0 | |||||
| 2026-01-21 | 13F | Newbridge Financial Services Group, Inc. | 0 | -100,00 | 0 | -100,00 | ||||
| 2026-02-17 | 13F | Guggenheim Capital Llc | 44.761 | 28,71 | 1.044 | 34,58 | ||||
| 2026-04-16 | 13F | Brookstone Capital Management | 11.727 | 7,32 | 257 | 0,79 | ||||
| 2026-04-22 | 13F | Caldwell Trust Co | 1.926 | 0,00 | 42 | -4,55 | ||||
| 2026-04-29 | 13F | Rocky Mountain Advisers, Llc | 313 | 0,00 | 7 | -14,29 | ||||
| 2026-02-13 | 13F | Glen Eagle Advisors, LLC | 4.912 | 1,97 | 115 | 6,54 | ||||
| 2026-04-17 | 13F | PMG Family Office LLC | 83.312 | 4,56 | 1.824 | -1,88 | ||||
| 2026-02-13 | 13F | Stifel Financial Corp | 403.432 | 13,50 | 9.408 | 18,70 | ||||
| 2026-02-11 | 13F | Cerity Partners LLC | 29.356 | -0,54 | 685 | 3,95 | ||||
| 2026-02-17 | 13F | Ancora Advisors, LLC | 58.543 | -2,66 | 1.365 | 1,79 | ||||
| 2026-04-27 | 13F | Pensionmark Financial Group, Llc | 22.603 | 69,10 | 495 | 58,84 | ||||
| 2026-01-28 | 13F | Geneos Wealth Management Inc. | 0 | -100,00 | 0 | -100,00 | ||||
| 2026-01-15 | 13F | Highline Wealth Partners Llc | 0 | -100,00 | 0 | |||||
| 2026-02-17 | 13F | Russell Investments Group, Ltd. | 62 | 1,64 | 1 | 0,00 | ||||
| 2026-02-17 | 13F | Advisor Group Holdings, Inc. | 181.543 | 2,82 | 4.234 | 10,21 | ||||
| 2026-02-17 | 13F | 1607 Capital Partners, LLC | 508.536 | -22,08 | 11.859 | -18,52 | ||||
| 2026-04-21 | 13F | Financial Consulate, Inc | 7.662 | -38,16 | 168 | -42,01 | ||||
| 2026-04-13 | 13F | IFP Advisors, Inc | 6.265 | 44,39 | 137 | 35,64 | ||||
| 2026-02-18 | 13F | GWM Advisors LLC | 31.360 | -10,22 | 731 | -6,04 | ||||
| 2025-11-12 | 13F | CIBC Bancorp USA Inc. | 15.080 | 336 | ||||||
| 2026-02-19 | 13F | CI Private Wealth, LLC | 64.232 | -1,90 | 1.498 | 2,53 | ||||
| 2026-01-20 | 13F | Savvy Advisors, Inc. | 19.992 | 466 | ||||||
| 2026-02-11 | 13F | Closed-End Fund Advisors, Inc. | 17.308 | 404 | ||||||
| 2026-01-26 | 13F | Shaker Financial Services, LLC | 164.389 | -30,65 | 3.834 | -27,47 | ||||
| 2026-02-13 | 13F | K2 Principal Fund, L.p. | 16.851 | 2,00 | 393 | 6,52 | ||||
| 2026-02-02 | 13F | Mcdonald Partners Llc | 17.079 | 0,00 | 398 | 4,74 | ||||
| 2026-02-13 | 13F | Pinnacle Wealth Planning Services, Inc. | 3.158 | 74 | ||||||
| 2026-04-16 | 13F | Capital Investment Advisors, LLC | 0 | -100,00 | 0 | |||||
| 2026-04-21 | 13F | Accredited Investor Services, Llc | 0 | -100,00 | 0 | |||||
| 2026-04-28 | 13F | Westbourne Investment Advisors, Inc. | 83.400 | 12,40 | 1.826 | 5,49 | ||||
| 2026-02-13 | 13F | Evelyn Partners Investment Management Services Ltd | 0 | -100,00 | 0 | |||||
| 2026-02-09 | 13F | HBK Sorce Advisory LLC | 0 | -100,00 | 0 | -100,00 | ||||
| 2026-02-13 | 13F | Walleye Capital LLC | 0 | -100,00 | 0 | |||||
| 2026-02-06 | 13F | HighTower Advisors, LLC | 64.919 | 2,66 | 1.514 | 7,30 | ||||
| 2026-02-03 | 13F | NewEdge Wealth, LLC | 14.813 | 0,00 | 345 | 0,00 | ||||
| 2026-04-09 | 13F | CRA Financial Services, LLC | 10.000 | 0,00 | 219 | -6,44 | ||||
| 2026-02-17 | 13F | Wealth Watch Advisors, INC | 4 | 0 | ||||||
| 2026-04-17 | 13F | CENTRAL TRUST Co | 0 | -100,00 | 0 | |||||
| 2026-02-02 | 13F | Wolverine Asset Management Llc | 0 | -100,00 | 0 | |||||
| 2026-02-11 | 13F | First Command Advisory Services, Inc. | 4.420 | 0,00 | 103 | 5,10 | ||||
| 2026-02-13 | 13F | Pathstone Holdings, LLC | 17.339 | 0,00 | 404 | 4,66 | ||||
| 2026-02-06 | 13F | Larson Financial Group LLC | 352 | 0,00 | 8 | 14,29 | ||||
| 2026-02-04 | 13F | LRI Investments, LLC | 3.049 | 2,01 | 71 | 7,58 | ||||
| 2026-02-12 | 13F | Commonwealth Equity Services, Llc | 74.525 | 7,10 | 1.738 | 173.600,00 | ||||
| 2026-02-13 | 13F | Bay Colony Advisory Group, Inc d/b/a Bay Colony Advisors | 10.868 | 8,91 | 253 | 13,96 | ||||
| 2026-04-21 | 13F | Wesbanco Bank Inc | 17.770 | -16,83 | 389 | -22,09 | ||||
| 2026-02-17 | 13F | Intrepid Family Office Llc | 267.262 | 2,01 | 6.233 | 6,68 | ||||
| 2026-04-23 | 13F | Oppenheimer & Co Inc | 42.079 | 921 | ||||||
| 2026-04-07 | 13F | Farther Finance Advisors, LLC | 1.400 | 0,00 | 31 | -3,12 | ||||
| 2026-04-15 | 13F | Atwood & Palmer Inc | 1.057 | 0,00 | 23 | -4,17 | ||||
| 2026-02-17 | 13F | Saba Capital Management, L.P. | 0 | -100,00 | 0 | |||||
| 2025-11-14 | 13F | potrero capital research llc | 0 | -100,00 | 0 | |||||
| 2026-02-13 | 13F | Integrated Wealth Concepts LLC | 123.048 | -8,85 | 2.869 | -4,68 | ||||
| 2026-04-02 | 13F | Hilltop National Bank | 317 | 0,00 | 7 | -14,29 | ||||
| 2026-04-22 | 13F | Samalin Investment Counsel, LLC | 36.054 | 789 | ||||||
| 2026-02-17 | 13F | Prostatis Group LLC | 33.362 | -0,61 | 778 | 4,01 | ||||
| 2026-02-09 | 13F | Arq Wealth Advisors, Llc | 208.810 | 0,22 | 4.869 | 4,80 | ||||
| 2026-02-17 | 13F | Creative Planning | 11.691 | 25,63 | 273 | 31,40 | ||||
| 2026-01-29 | 13F | Dunhill Financial, LLC | 620 | 14 | ||||||
| 2026-02-03 | 13F | Vantage Financial Partners, LLC | 10.333 | 2,01 | 241 | 6,67 | ||||
| 2026-02-12 | 13F | Jane Street Group, Llc | 27.267 | 11,28 | 636 | 16,30 | ||||
| 2026-04-30 | 13F | Cambridge Investment Research Advisors, Inc. | 34.342 | -15,32 | 1 | |||||
| 2026-04-07 | 13F | Estate Planners Group, LLC | 0 | 0 | ||||||
| 2026-02-10 | 13F | Cherry Tree Wealth Management, LLC | 252 | 0,00 | 6 | 0,00 | ||||
| 2026-02-12 | 13F | Penserra Capital Management LLC | 325.215 | 10,20 | 8 | 16,67 | ||||
| 2026-04-10 | 13F | Armstrong Advisory Group, Inc | 500 | 0,00 | 11 | -9,09 | ||||
| 2026-04-13 | 13F | Creative Financial Designs Inc /adv | 3 | 50,00 | 0 | |||||
| 2026-02-09 | 13F | King Luther Capital Management Corp | 512 | -54,12 | ||||||
| 2026-04-07 | 13F | CoreCap Advisors, LLC | 260 | 0,39 | 6 | -16,67 | ||||
| 2026-02-13 | 13F | General American Investors Co Inc | 131.124 | 0,00 | 3.058 | 4,55 | ||||
| 2026-02-17 | 13F | Jones Financial Companies Lllp | 120.905 | 40,48 | 2.820 | 48,21 | ||||
| 2026-02-17 | 13F | Lazard Asset Management Llc | 3.589.875 | 2,22 | 83.716 | 6,90 | ||||
| 2026-04-20 | 13F | Kestra Private Wealth Services, Llc | 28.657 | 17,88 | 627 | 10,78 | ||||
| 2026-04-27 | 13F | Koshinski Asset Management, Inc. | 61.038 | 4,29 | 1.336 | -2,05 | ||||
| 2026-04-27 | 13F | Benchmark Financial Wealth Advisors, LLC | 10.444 | 2,02 | 229 | -4,20 | ||||
| 2026-02-12 | 13F | StoneX Group Inc. | 0 | -100,00 | 0 | |||||
| 2026-04-22 | 13F | Joel Isaacson & Co., LLC | 33.489 | 0,00 | 733 | -6,03 | ||||
| 2026-01-27 | 13F | Waterfront Wealth Inc. | 385.316 | -13,69 | 8.973 | -11,25 | ||||
| 2026-01-26 | 13F | Consolidated Portfolio Review Corp | 0 | -100,00 | 0 | |||||
| 2026-02-02 | 13F | Millstone Evans Group, LLC | 997 | 0,00 | 23 | 4,55 | ||||
| 2026-02-14 | 13F | Rockefeller Capital Management L.P. | 324 | 100,00 | 8 | 133,33 | ||||
| 2026-04-24 | 13F | Private Advisor Group, LLC | 15.243 | -43,95 | 334 | -47,48 | ||||
| 2026-02-12 | 13F | Concorde Asset Management, LLC | 40.332 | 7,30 | 941 | 11,37 | ||||
| 2026-04-09 | 13F | Nelson, Van Denburg & Campbell Wealth Management Group, LLC | 39.263 | 33,49 | 859 | 25,40 | ||||
| 2026-02-09 | 13F | MSH Capital Advisors LLC | 8.824 | -22,83 | 206 | -19,29 | ||||
| 2026-02-12 | 13F | Bank Of Montreal /can/ | 11.886 | 3,80 | 277 | 8,63 | ||||
| 2026-04-24 | 13F | Root Financial Partners, LLC | 81 | 2 | ||||||
| 2026-02-13 | 13F | Centaurus Financial, Inc. | 5.119 | 0 | ||||||
| 2026-04-16 | 13F | First Community Trust Na | 4.680 | 0,00 | 102 | -6,42 | ||||
| 2026-02-09 | 13F | Harbour Investments, Inc. | 23.289 | 3,30 | 543 | 8,17 | ||||
| 2026-02-17 | 13F | Advisory Services Network, LLC | 0 | -100,00 | 0 | |||||
| 2026-04-27 | 13F | Turtle Creek Wealth Advisors, LLC | 28.106 | 0,00 | 615 | -6,11 | ||||
| 2026-02-17 | 13F | Bank Of America Corp /de/ | 281.288 | 2,72 | 6.560 | 7,42 | ||||
| 2026-04-28 | 13F | Whittier Trust Co | 105 | 0,00 | 2 | 0,00 | ||||
| 2026-04-27 | 13F | Truist Financial Corp | 13.000 | 0,22 | 285 | -5,96 | ||||
| 2026-04-07 | 13F | Park Avenue Securities Llc | 18.122 | -20,40 | 0 | |||||
| 2026-02-17 | 13F | Scarborough Advisors, LLC | 3.430 | 1,99 | 80 | 6,76 | ||||
| 2026-02-11 | 13F | Tiaa Trust, National Association | 10.264 | -5,16 | 239 | -0,83 | ||||
| 2026-02-09 | 13F | Blue Bell Private Wealth Management, Llc | 924.285 | -0,25 | 21.554 | 4,32 | ||||
| 2026-02-09 | 13F | Huntington National Bank | 0 | |||||||
| 2026-02-17 | 13F | Royal Bank Of Canada | 935.879 | -0,62 | 21.825 | 3,93 | ||||
| 2026-01-26 | 13F | Cwm, Llc | 11.050 | 206,18 | 0 | |||||
| 2026-03-12 | 13F | Farmers National Bank | 27.234 | 0,00 | 635 | 4,61 | ||||
| 2026-04-20 | 13F | Minichmacgregor Wealth Management, Llc | 16.863 | 8,46 | 369 | -26,93 | ||||
| 2026-04-20 | 13F | Segment Wealth Management, LLC | 0 | -100,00 | 0 | |||||
| 2026-04-01 | 13F | Bangor Savings Bank | 633 | 0,00 | 14 | -7,14 | ||||
| 2026-02-10 | 13F | Savant Capital, LLC | 52.639 | 39,72 | 1.228 | 46,07 | ||||
| 2026-04-28 | 13F | Lee Danner & Bass Inc | 25.000 | 0,00 | 547 | -6,17 | ||||
| 2026-02-11 | 13F | LPL Financial LLC | 432.561 | -1,43 | 10.087 | 3,09 | ||||
| 2026-02-20 | 13F | Kovitz Investment Group Partners, LLC | 0 | -100,00 | 0 | |||||
| 2026-02-13 | 13F | Wells Fargo & Company/mn | 220.720 | 6,48 | 5.147 | 11,36 | ||||
| 2026-04-14 | 13F | Tradewinds Capital Management, LLC | 8.873 | 0,00 | 194 | -5,83 | ||||
| 2026-02-17 | 13F | Wiley Bros.-aintree Capital, Llc | 11.331 | 264 | ||||||
| 2026-02-05 | 13F | Roberts Glore & Co Inc /il/ | 144.674 | 4,42 | 3.374 | 9,19 | ||||
| 2026-04-17 | 13F | Harbour Wealth Management Group, Inc. | 11.497 | -0,54 | 252 | -6,69 | ||||
| 2026-04-24 | 13F | KC Investment Advisors, LLC | 9.392 | 0,00 | 206 | -6,39 | ||||
| 2026-04-15 | 13F | Uncommon Cents Investing LLC | 181.905 | -1,68 | 3.982 | -7,72 | ||||
| 2026-02-13 | 13F | Kestra Advisory Services, LLC | 0 | -100,00 | 0 | |||||
| 2026-01-29 | 13F | Comerica Bank | 3.537 | -20,05 | 82 | -16,33 | ||||
| 2026-02-10 | 13F | Lido Advisors, LLC | 48.237 | 0,00 | 1.076 | 0,00 | ||||
| 2026-02-19 | 13F | Invesco Ltd. | 39.313 | 917 | ||||||
| 2026-04-13 | 13F | GoalVest Advisory LLC | 9.392 | 0,00 | 206 | -6,39 | ||||
| 2026-04-22 | 13F | Janney Montgomery Scott LLC | 55.421 | 6,73 | 1 | 0,00 | ||||
| 2026-04-08 | 13F | Wealth Enhancement Advisory Services, Llc | 271.458 | -37,01 | 6.089 | -39,65 | ||||
| 2026-01-23 | 13F | Rsm Us Wealth Management Llc | 27.040 | -30,15 | 632 | -26,77 | ||||
| 2026-01-29 | 13F | UBS Group AG | 72.289 | 12,29 | 1.686 | 17,42 | ||||
| 2026-01-15 | 13F | Allspring Global Investments Holdings, LLC | 400.716 | 3,55 | 9.345 | 8,29 | ||||
| 2026-02-10 | 13F | Envestnet Asset Management Inc | 10.415 | -7,10 | 243 | -3,20 | ||||
| 2026-02-04 | 13F | Atlantic Union Bankshares Corp | 1.175 | 0,00 | 27 | 3,85 | ||||
| 2026-02-17 | 13F | Cetera Investment Advisers | 150.522 | 0,58 | 3.510 | 5,18 | ||||
| 2026-01-29 | 13F | D.a. Davidson & Co. | 131.032 | -0,02 | 3.056 | 4,55 | ||||
| 2026-01-23 | 13F | RFG - Bristol Wealth Advisors, LLC | 38.512 | 0,00 | 898 | 4,66 | ||||
| 2025-11-12 | 13F | Kingsview Wealth Management, LLC | 0 | -100,00 | 0 | |||||
| 2025-11-13 | 13F | Glenmede Investment Management, LP | 0 | -100,00 | 0 | |||||
| 2025-11-19 | 13F | Sunbelt Securities, Inc. | 0 | -100,00 | 0 | |||||
| 2026-02-17 | 13F | Warren Averett Asset Management, LLC | 67.360 | -0,40 | 1.571 | 4,11 | ||||
| 2026-02-17 | 13F | Snowden Capital Advisors LLC | 10.416 | 1,98 | 243 | 6,61 | ||||
| 2026-04-15 | 13F | Exchange Traded Concepts, Llc | 12.889 | 282 | ||||||
| 2026-04-13 | 13F | Mather Group, Llc. | 532 | 12 | ||||||
| 2026-02-06 | 13F | Providence Wealth Advisors, LLC | 98.953 | 0,00 | 2.320 | 1,13 | ||||
| 2026-01-14 | 13F | Hennion & Walsh Asset Management, Inc. | 288.014 | 3,32 | 6.716 | 8,04 | ||||
| 2026-02-17 | 13F | Mercer Global Advisors Inc /adv | 63.837 | 6,03 | 1.489 | 10,88 | ||||
| 2026-02-17 | 13F | DV Trading LLC | 2 | 0 | ||||||
| 2026-01-20 | 13F | Maryland Capital Advisors Inc. | 175 | 0,00 | 4 | 33,33 | ||||
| 2026-04-28 | 13F | Alliance Wealth Strategies, LLC d/b/a Brown Edwards Wealth Strategies | 9.277 | 0,00 | 203 | -6,02 | ||||
| 2026-02-17 | 13F | Ameriprise Financial Inc | 115.679 | 2,46 | 2.698 | 7,41 | ||||
| 2026-02-17 | 13F | Capstone Financial Advisors, Inc. | 42.513 | 1,07 | 991 | 5,76 | ||||
| 2026-02-13 | 13F | Thomas J. Herzfeld Advisors, Inc. | 308 | 2,33 | 7 | 16,67 | ||||
| 2026-04-21 | 13F | Quad-Cities Investment Group, LLC | 28.488 | 2,02 | 624 | -4,30 | ||||
| 2026-01-30 | 13F | Archer Investment Corp | 1.889 | 0,00 | 44 | 4,76 | ||||
| 2026-02-17 | 13F | Raymond James Financial Inc | 1.345.588 | 3,03 | 31.379 | 7,74 | ||||
| 2026-02-04 | 13F | Midwest Trust Co | 45.302 | 2,01 | 1.056 | 6,67 | ||||
| 2026-02-18 | 13F | EP Wealth Advisors, Inc. | 19.152 | 3,78 | 447 | 11,50 | ||||
| 2026-04-28 | 13F | Stratos Wealth Partners, LTD. | 15.598 | 12,71 | 341 | 5,90 | ||||
| 2026-04-27 | 13F | Boyd Watterson Asset Management Llc/oh | 0 | -100,00 | 0 | |||||
| 2026-02-06 | 13F | Prevail Innovative Wealth Advisors, Llc | 9.846 | -87,47 | 230 | -86,92 | ||||
| 2026-02-11 | 13F | Fca Corp /tx | 175.330 | -9,43 | 4.089 | -5,30 | ||||
| 2026-02-13 | 13F | Citigroup Inc | 5 | 0,00 | 0 | |||||
| 2026-04-20 | 13F | Morton Brown Family Wealth, LLC | 194 | 0,00 | 4 | 0,00 | ||||
| 2026-02-17 | 13F | XTX Topco Ltd | 18.381 | 429 | ||||||
| 2026-02-03 | 13F | RB Capital Management, LLC | 208.462 | -1,01 | 4.861 | 3,51 | ||||
| 2026-01-26 | 13F | Heritage Wealth Management, Inc. | 0 | -100,00 | 0 | |||||
| 2026-02-17 | 13F | Readystate Asset Management Lp | 0 | -100,00 | 0 | |||||
| 2026-02-13 | 13F | SRS Capital Advisors, Inc. | 970 | 0,00 | 23 | 4,76 | ||||
| 2026-02-13 | 13F | Cohen & Steers, Inc. | 1.086.635 | -5,07 | 25 | 0,00 | ||||
| 2026-04-29 | 13F | WPG Advisers, LLC | 419 | -61,13 | 9 | -64,00 | ||||
| 2026-02-12 | 13F | Kovack Advisors, Inc. | 30.406 | 83 | ||||||
| 2026-01-23 | 13F | Assetmark, Inc | 436 | 0,00 | 10 | 11,11 | ||||
| 2026-04-07 | 13F | Sage Capital Advisors,llc | 18.370 | 4,29 | 402 | -1,95 | ||||
| 2026-01-27 | 13F | Regions Financial Corp | 16.516 | -4,70 | 385 | -0,26 | ||||
| 2025-11-14 | 13F | Quantedge Capital Pte Ltd | 0 | -100,00 | 0 | -100,00 | ||||
| 2026-01-26 | 13F | Private Trust Co Na | 783 | 1,82 | 18 | 5,88 | ||||
| 2026-04-13 | 13F | LexAurum Advisors, LLC | 29.687 | 650 | ||||||
| 2026-04-23 | 13F | Founders Capital Management, Llc | 12.149 | 0,86 | 266 | -5,36 | ||||
| 2026-04-23 | 13F | J.w. Cole Advisors, Inc. | 0 | -100,00 | 0 | |||||
| 2026-02-04 | 13F | Bensler, LLC | 987.718 | 6,77 | 23.034 | 11,66 | ||||
| 2026-02-06 | 13F | Global Retirement Partners, LLC | 7.453 | 174 | ||||||
| 2026-01-29 | 13F | Concurrent Investment Advisors, LLC | 67.117 | 29,94 | 1.565 | 35,97 |