Grundlæggende statistik
| Institutionelle ejere | 212 total, 212 long only, 0 short only, 0 long/short - change of -0,93% MRQ |
| Gennemsnitlig porteføljeallokering | 0.4362 % - change of 12,06% MRQ |
| Institutionelle aktier (lange) | 16.460.888 (ex 13D/G) - change of 0,88MM shares 5,65% MRQ |
| Institutionel værdi (lang) | $ 1.313.472 USD ($1000) |
Institutionelt ejerskab og aktionærer
iShares Trust - iShares MSCI All Country Asia ex Japan ETF (US:AAXJ) har 212 institutionelle ejere og aktionærer, der har indsendt 13D/G- eller 13F-formularer til Securities Exchange Commission (SEC). Disse institutioner har i alt 16,460,888 aktier. Største aktionærer omfatter Jpmorgan Chase & Co, Analyst IMS Investment Management Services Ltd., Morgan Stanley, J.Safra Asset Management Corp, CIBC Bancorp USA Inc., CIBC Private Wealth Group, LLC, Pragma Gestao De Patrimonio Ltd, Prudential Plc, Alliancebernstein L.p., and Oversea-Chinese Banking CORP Ltd .
iShares Trust - iShares MSCI All Country Asia ex Japan ETF (NasdaqGM:AAXJ) institutionel ejerskabsstruktur viser aktuelle positioner i virksomheden efter institutioner og fonde, samt seneste ændringer i positionsstørrelse. Større aktionærer kan omfatte individuelle investorer, investeringsforeninger, hedgefonde eller institutioner. Skema 13D angiver, at investoren besidder (eller besidder) mere end 5 % af virksomheden og har til hensigt (eller har til hensigt at) aktivt at forfølge en ændring i forretningsstrategi. Skema 13G indikerer en passiv investering på over 5%.
The share price as of April 28, 2026 is 107,82 / share. Previously, on April 29, 2025, the share price was 73,44 / share. This represents an increase of 46,81% over that period.

Fondens stemningsscore
Fund Sentiment Score (fka Ownership Accumulation Score) finder de aktier, der bliver mest købt af fonde. Det er resultatet af en sofistikeret, multi-faktor kvantitativ model, der identificerer virksomheder med de højeste niveauer af institutionel akkumulering. Scoringsmodellen bruger en kombination af den samlede stigning i oplyste ejere, ændringerne i porteføljeallokeringer i disse ejere og andre målinger. Tallet går fra 0 til 100, hvor højere tal indikerer et højere niveau af akkumulering for sine jævnaldrende, og 50 er gennemsnittet.
Opdateringsfrekvens: Dagligt
Se Ownership Explorer, som giver en liste over højest rangerende virksomheder.
AI+ Ask Fintel’s AI assistant about iShares Trust - iShares MSCI All Country Asia ex Japan ETF.
Select a question to share a public post with an AI-crafted answer.
Thinking of good questions…
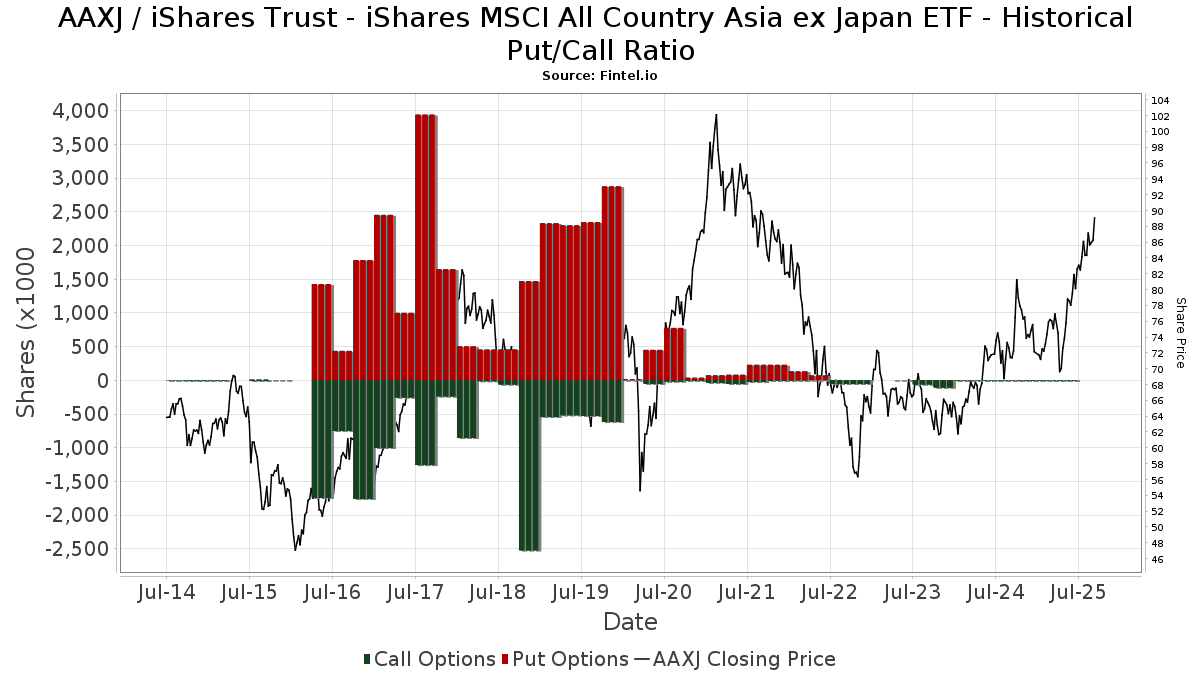
Institutionel Put/Call-forhold
Ud over at indberette standardaktie- og gældsudstedelser skal institutter med mere end 100 mill. aktiver under forvaltning også oplyse deres put- og call-optionsbeholdninger. Da salgsoptioner generelt indikerer negativ stemning, og købsoptioner indikerer positiv stemning, kan vi få en fornemmelse af den overordnede institutionelle stemning ved at plotte forholdet mellem put og kald. Diagrammet til højre viser det historiske put/call-forhold for dette instrument.
Brug af Put/Call Ratio som en indikator for investorernes stemning overvinder en af de vigtigste mangler ved at bruge totalt institutionelt ejerskab, som er, at en betydelig mængde af aktiver under forvaltning investeres passivt for at spore indekser. Passivt forvaltede fonde køber typisk ikke optioner, så indikatoren for put/call-forholdet følger mere nøje følelsen af aktivt forvaltede fonde.
13F og NPORT arkivering
Detaljer om 13F-arkivering er gratis. Detaljer om NP-ansøgninger kræver et premium-medlemskab. Grønne rækker angiver nye positioner. Røde rækker angiver lukkede positioner. Klik på linket ikon for at se den fulde transaktionshistorik.
Opgrader
for at låse premium-data op og eksportere til Excel ![]() .
.
| Fil dato | Kilde | Investor | Type | Gennemsnitlig pris (Øst) |
Aktier | Δ Aktier (%) |
Rapporteret Værdi ($1000) |
Δ Værdi (%) |
Port Alloc (%) |
|
|---|---|---|---|---|---|---|---|---|---|---|
| 2026-04-27 | 13F | Turtle Creek Wealth Advisors, LLC | 687 | 66 | ||||||
| 2026-02-12 | 13F | Proficio Capital Partners LLC | 19.346 | 1.802 | ||||||
| 2026-01-29 | 13F | Vanguard Group Inc | 3.039 | 0,00 | 283 | 1,81 | ||||
| 2026-04-27 | 13F | Truist Financial Corp | 5.151 | -5,62 | 496 | -2,56 | ||||
| 2026-04-06 | 13F | Acima Private Wealth, Llc | 137 | 13 | ||||||
| 2026-02-11 | 13F | GFS Advisors, LLC | 109.145 | 10.164 | ||||||
| 2026-02-13 | 13F | Umb Bank N A/mo | 1.133 | 0,00 | 106 | 1,94 | ||||
| 2026-02-17 | 13F | Alliancebernstein L.p. | 480.492 | -8,07 | 44.743 | -6,16 | ||||
| 2026-02-10 | 13F | Envestnet Asset Management Inc | 8.050 | -84,86 | 750 | -84,55 | ||||
| 2025-11-13 | 13F | Glenmede Investment Management, LP | 7.821 | 0,00 | 713 | 10,37 | ||||
| 2026-02-10 | 13F | Cherry Tree Wealth Management, LLC | 1.933 | 0,00 | 180 | 2,27 | ||||
| 2026-04-20 | 13F | Banque Cantonale Vaudoise | 40.594 | 3,81 | 3.909 | 7,33 | ||||
| 2026-02-13 | 13F | Vontobel Holding Ltd. | 6.828 | 0,00 | 636 | 2,09 | ||||
| 2026-02-17 | 13F | Citadel Advisors Llc | 0 | -100,00 | 0 | |||||
| 2026-01-20 | 13F | Wall Street Access Asset Management, LLC | 100 | 0,00 | 9 | 0,00 | ||||
| 2026-02-17 | 13F | Old Mission Capital Llc | 0 | -100,00 | 0 | |||||
| 2026-02-13 | 13F | Zuckerman Investment Group, LLC | 0 | -100,00 | 0 | |||||
| 2026-04-14 | 13F | Congress Asset Management Co /ma | 15.632 | -9,87 | 1.505 | -6,75 | ||||
| 2026-02-17 | 13F | Quadrature Capital Ltd | 3.075 | 286 | ||||||
| 2026-04-20 | 13F | Independent Wealth Network Inc. | 8.610 | -0,17 | 829 | 3,24 | ||||
| 2026-02-12 | 13F | Voya Investment Management Llc | 8.156 | -3,98 | 759 | -1,94 | ||||
| 2026-02-06 | 13F | Global Retirement Partners, LLC | 13 | 0,00 | 1 | 0,00 | ||||
| 2026-02-13 | 13F | Evelyn Partners Asset Management Ltd | 544 | 0,00 | 51 | 2,04 | ||||
| 2026-02-13 | 13F | LM Advisors LLC | 210 | 2 | ||||||
| 2026-02-10 | 13F | Bnp Paribas Arbitrage, Sa | 7.061 | -1,36 | 658 | 0,77 | ||||
| 2026-02-12 | 13F | Brueske Advisory Services, LLC | 0 | -100,00 | 0 | |||||
| 2026-04-21 | 13F | E&G Advisors, LP | 4.036 | 54,87 | 389 | 60,33 | ||||
| 2026-04-23 | 13F | Analyst IMS Investment Management Services Ltd. | 2.221.114 | 102,71 | 214 | 108,82 | ||||
| 2026-02-10 | 13F | Goldman Sachs Group Inc | 96.184 | 13,17 | 8.957 | 15,53 | ||||
| 2026-02-12 | 13F | DRW Securities, LLC | 23.736 | -34,85 | 2.210 | -33,53 | ||||
| 2026-01-27 | 13F | Evergreen Capital Management Llc | 43.251 | 0,00 | 4.028 | 2,08 | ||||
| 2026-02-17 | 13F | Creative Planning | 4.492 | 38,30 | 418 | 41,22 | ||||
| 2026-02-12 | 13F | Hollencrest Capital Management | 250 | 0,00 | 23 | 4,55 | ||||
| 2026-02-13 | 13F | Brown Advisory Inc | 67.113 | 15,86 | 6.250 | 18,26 | ||||
| 2026-02-13 | 13F | Commerce Bank | 24.811 | 0,00 | 2.310 | 2,08 | ||||
| 2026-04-24 | 13F | SOL Capital Management CO | 0 | -100,00 | 0 | |||||
| 2026-02-11 | 13F | Allianz Asset Management GmbH | 90.300 | 83,91 | 8.409 | 87,76 | ||||
| 2026-02-17 | 13F | Quantinno Capital Management LP | 59.173 | 0,58 | 5.510 | 2,68 | ||||
| 2026-02-04 | 13F/A | Nwam Llc | 0 | -100,00 | 0 | -100,00 | ||||
| 2026-01-29 | 13F | Comerica Bank | 3.799 | 2,62 | 354 | 4,75 | ||||
| 2026-02-17 | 13F | Evercore Wealth Management, LLC | 25.985 | 0,00 | 2.420 | 2,07 | ||||
| 2026-02-17 | 13F | Blair William & Co/il | 296 | 0,00 | 28 | 0,00 | ||||
| 2026-02-10 | 13F | Savant Capital, LLC | 3.489 | -48,52 | 325 | -47,57 | ||||
| 2026-02-13 | 13F | Invictus Private Wealth, Llc | 8.789 | 818 | ||||||
| 2026-02-17 | 13F | Risk Paradigm Group, LLC | 0 | -100,00 | 0 | |||||
| 2026-02-10 | 13F | Marshall & Sterling Wealth Advisors Inc. | 0 | -100,00 | 0 | |||||
| 2026-02-12 | 13F | Insigneo Advisory Services, Llc | 8.883 | -8,92 | 827 | -6,97 | ||||
| 2026-02-03 | 13F | Ballentine Partners, LLC | 7.914 | 0,00 | 737 | 2,08 | ||||
| 2026-01-20 | 13F | Arvest Investments, Inc. | 0 | -100,00 | 0 | |||||
| 2026-04-27 | 13F | Tsfg, Llc | 143 | -1,38 | 0 | |||||
| 2026-02-13 | 13F | Bank Of Nova Scotia | 87.740 | 53,20 | 8.198 | 56,91 | ||||
| 2026-02-12 | 13F | Bank Of Montreal /can/ | 230 | 210,81 | 21 | 250,00 | ||||
| 2026-02-17 | 13F | DZ BANK AG Deutsche Zentral Genossenschafts Bank, Frankfurt am Main | 0 | -100,00 | 0 | |||||
| 2026-02-13 | 13F | Transamerica Financial Advisors, Inc. | 18 | 2 | ||||||
| 2026-02-17 | 13F | Fmr Llc | 3.760 | 120,14 | 350 | 125,81 | ||||
| 2026-02-17 | 13F | Miller Capital Partners, Inc. | 306 | 28 | ||||||
| 2026-02-17 | 13F | Private Advisor Group, LLC | 0 | -100,00 | 0 | |||||
| 2026-04-28 | 13F | Bogart Wealth, LLC | 44 | 0,00 | 4 | 0,00 | ||||
| 2026-04-22 | 13F | James Hambro & Partners | 57.265 | 20,41 | 5.514 | 24,55 | ||||
| 2025-11-12 | 13F | CIBC Bancorp USA Inc. | 733.985 | 66.954 | ||||||
| 2026-04-09 | 13F | Camelot Technology Advisors, Inc. | 6.511 | 627 | ||||||
| 2026-04-27 | 13F | Sound Income Strategies, LLC | 100 | 0,00 | 10 | 0,00 | ||||
| 2026-02-17 | 13F | Modern Wealth Management, LLC | 19.381 | -0,13 | 1.805 | 1,92 | ||||
| 2026-02-03 | 13F | Harel Insurance Investments & Financial Services Ltd. | 752 | 6,52 | 0 | |||||
| 2026-04-08 | 13F | Miracle Mile Advisors, LLC | 3.763 | 0,00 | 362 | 3,43 | ||||
| 2026-04-22 | 13F | Apollon Wealth Management, LLC | 11.527 | -2,54 | 1.110 | 0,73 | ||||
| 2026-02-11 | 13F | Deutsche Bank Ag\ | 55 | 0,00 | 5 | 0,00 | ||||
| 2026-02-12 | 13F | Steward Partners Investment Advisory, Llc | 7 | 0,00 | 1 | |||||
| 2026-02-03 | 13F | Climber Capital SA | 29.490 | -9,73 | 2.199 | -6,15 | ||||
| 2026-04-23 | 13F | Spinnaker Trust | 36.837 | -2,03 | 3.547 | 1,31 | ||||
| 2026-02-20 | 13F | Larch Capital Partners Llc | 24.720 | 2.302 | ||||||
| 2026-04-20 | 13F | LVW Advisors, LLC | 0 | -100,00 | 0 | |||||
| 2026-04-27 | 13F | Independent Solutions Wealth Management, LLC | 6.250 | 27,76 | 602 | 32,09 | ||||
| 2026-02-17 | 13F | BTG Pactual Asset Management US LLC | 0 | -100,00 | 0 | |||||
| 2026-02-17 | 13F | Russell Investments Group, Ltd. | 2.827 | 81,57 | 263 | 85,21 | ||||
| 2026-02-26 | 13F | TD Capital Management LLC | 167 | 16 | ||||||
| 2026-02-17 | 13F | EFG International AG | 95.326 | 8.876 | ||||||
| 2026-02-05 | 13F | AlphaCore Capital LLC | 46.469 | -26,30 | 4.327 | -24,76 | ||||
| 2026-04-20 | 13F | Ronald Blue Trust, Inc. | 314 | 0,00 | 30 | 3,45 | ||||
| 2026-01-14 | 13F | BFI Infinity Ltd. | Put | 0 | -100,00 | 0 | -100,00 | |||
| 2026-02-12 | 13F | Federation des caisses Desjardins du Quebec | 39.903 | -0,45 | 3.716 | 1,61 | ||||
| 2026-02-13 | 13F | Schroder Investment Management Group | 54.130 | 1,79 | 5.041 | 3,90 | ||||
| 2026-04-23 | 13F | iA Global Asset Management Inc. | 35.080 | 90,00 | 3 | 200,00 | ||||
| 2026-02-02 | 13F | Nicholas Hoffman & Company, LLC. | 36.352 | 0,00 | 3.385 | 2,08 | ||||
| 2026-02-23 | 13F | Kera Capital Partners, Inc. | 99.635 | 13,09 | 9.992 | 24,34 | ||||
| 2026-02-17 | 13F | Green Harvest Asset Management LLC | 324.803 | 8,03 | 30.246 | 10,28 | ||||
| 2026-01-12 | 13F | Evolution Wealth Advisors, LLC | 4.004 | -93,72 | 373 | -93,60 | ||||
| 2025-11-14 | 13F | Horizon Investments, LLC | 0 | -100,00 | 0 | -100,00 | ||||
| 2026-02-13 | 13F | Gts Securities Llc | 0 | -100,00 | 0 | |||||
| 2026-04-02 | 13F | Marex Group plc | 0 | 0 | ||||||
| 2026-01-27 | 13F | Journey Advisory Group, LLC | 71.984 | 0,30 | 6.703 | 2,40 | ||||
| 2026-04-08 | 13F | Wealth Enhancement Advisory Services, Llc | 4.664 | -2,89 | 448 | -4,68 | ||||
| 2026-02-13 | 13F | Stifel Financial Corp | 4.499 | -9,77 | 419 | -7,93 | ||||
| 2026-02-06 | 13F | Pnc Financial Services Group, Inc. | 24.070 | 3,34 | 2.241 | 5,51 | ||||
| 2026-02-17 | 13F | Tower Research Capital LLC (TRC) | 246 | 846,15 | 23 | 1.000,00 | ||||
| 2026-02-11 | 13F | Prudential Plc | 506.681 | 1.482,93 | 47.182 | 1.516,38 | ||||
| 2026-02-13 | 13F | Pathstone Holdings, LLC | 3.308 | -30,75 | 308 | -29,20 | ||||
| 2026-02-13 | 13F | Morgan Stanley | 1.220.358 | 2,05 | 113.640 | 4,18 | ||||
| 2026-02-17 | 13F | Zurich Insurance Group Ltd/FI | 148.390 | 51,74 | 13.864 | 52,52 | ||||
| 2026-04-27 | 13F | HB Wealth Management, LLC | 11.695 | 30,55 | 1.126 | 35,01 | ||||
| 2026-02-13 | 13F | Manufacturers Life Insurance Company, The | 0 | -100,00 | 0 | |||||
| 2026-02-12 | 13F | Jane Street Group, Llc | 0 | -100,00 | 0 | |||||
| 2026-02-17 | 13F | Tolleson Wealth Management, Inc. | 41.688 | -3,73 | 3.882 | -1,72 | ||||
| 2026-04-07 | 13F | Mb, Levis & Associates, Llc | 199 | 0,00 | 19 | 5,56 | ||||
| 2026-04-27 | 13F | Oarsman Capital, Inc. | 2.835 | -22,56 | 273 | -20,00 | ||||
| 2026-01-20 | 13F | Independence Bank of Kentucky | 242 | 0,00 | 23 | 0,00 | ||||
| 2026-04-13 | 13F | Foster Group, Inc. | 3.400 | 13,33 | 327 | 17,20 | ||||
| 2026-04-23 | 13F | First Pacific Financial | 2.731 | -9,42 | 263 | -6,07 | ||||
| 2026-01-30 | 13F | Palisades Hudson Asset Management, L.P. | 91.021 | -16,23 | 8 | -11,11 | ||||
| 2026-02-12 | 13F | Triumph Capital Management | 229 | -1,29 | 21 | 0,00 | ||||
| 2026-04-13 | 13F | BFI Infinity Ltd. | 306.962 | 3,37 | 29.557 | 6,89 | ||||
| 2026-02-13 | 13F | Vivaldi Capital Management, LLC | 2.830 | -20,59 | 264 | -19,08 | ||||
| 2026-02-11 | 13F | Simplex Trading, Llc | 42 | 4 | ||||||
| 2026-04-28 | 13F | Oversea-Chinese Banking CORP Ltd | 418.480 | -36,04 | 40.295 | -33,82 | ||||
| 2026-02-06 | 13F | Advisory Alpha, LLC | 7.889 | 47,46 | 735 | 47,98 | ||||
| 2026-02-10 | 13F | BlackDiamond Wealth Management Inc. | 4.851 | 13,98 | 497 | 27,84 | ||||
| 2026-02-13 | 13F | Baird Financial Group, Inc. | 6.506 | 0,00 | 606 | 2,02 | ||||
| 2026-01-28 | 13F | Migdal Insurance & Financial Holdings Ltd. | 366 | 0,00 | 0 | |||||
| 2026-02-19 | 13F | First Growth Capital LLC | 12.909 | 1.349 | ||||||
| 2026-04-28 | 13F | Altfest L J & Co Inc | 5.784 | -0,79 | 557 | 2,58 | ||||
| 2026-02-13 | 13F | Kestra Advisory Services, LLC | 957 | 89 | ||||||
| 2026-04-14 | 13F | Wealthcare Advisory Partners LLC | 4.037 | -1,44 | 389 | 1,84 | ||||
| 2026-02-06 | 13F | Americana Partners, LLC | 3.368 | 0,00 | 314 | 1,95 | ||||
| 2026-02-13 | 13F | Evelyn Partners Investment Management LLP | 2.150 | 0,00 | 200 | 2,04 | ||||
| 2026-01-26 | 13F | Private Trust Co Na | 50 | 0,00 | 5 | 0,00 | ||||
| 2026-02-10 | 13F | Castlekeep Investment Advisors Llc | 4.704 | 0,00 | 438 | 2,10 | ||||
| 2026-04-14 | 13F | Prospera Financial Services Inc | 20.264 | -2,09 | 1.951 | 1,25 | ||||
| 2026-02-17 | 13F | Two Sigma Securities, Llc | 0 | -100,00 | 0 | |||||
| 2026-02-06 | 13F/A | Rathbone Brothers plc | 23.300 | 9,75 | 2.170 | 12,04 | ||||
| 2026-02-05 | 13F | Bessemer Group Inc | 27.000 | 224.900,00 | 3 | |||||
| 2026-02-10 | 13F | Godfrey Financial Associates, Inc. | 220 | 20 | ||||||
| 2026-04-28 | 13F | Whittier Trust Co | 1.355 | 0,00 | 132 | -0,76 | ||||
| 2026-02-13 | 13F | Fiduciary Trust Co | 5.087 | -2,34 | 474 | -0,42 | ||||
| 2026-01-23 | 13F | Freestone Capital Holdings, LLC | 3.646 | 0,03 | 340 | 2,11 | ||||
| 2026-02-13 | 13F | Banco Santander, S.A. | 117.310 | 16,28 | 10.924 | 18,70 | ||||
| 2026-02-17 | 13F | Wellington Management Group Llp | 190.453 | -61,31 | 17.735 | -60,51 | ||||
| 2026-02-18 | 13F | GWM Advisors LLC | 7.240 | 15,60 | 674 | 18,04 | ||||
| 2026-01-21 | 13F | Capital Investment Advisory Services, LLC | 1.194 | 0,00 | 111 | 2,78 | ||||
| 2026-01-16 | 13F | Crowley Wealth Management, Inc. | 0 | -100,00 | 0 | |||||
| 2026-03-06 | 13F | Hsbc Holdings Plc | 7.788 | 0,00 | 725 | 2,11 | ||||
| 2026-02-09 | 13F | Key FInancial Inc | 0 | -100,00 | 0 | |||||
| 2026-04-22 | 13F | BigSur Wealth Management LLC | 5.260 | 0,00 | 506 | 3,48 | ||||
| 2026-01-28 | 13F | WPG Advisers, LLC | 6 | 0,00 | 1 | |||||
| 2026-02-17 | 13F | Millennium Management Llc | 2.520 | 235 | ||||||
| 2026-04-15 | 13F | Activest Wealth Management | 79.823 | 261,76 | 7.686 | 274,20 | ||||
| 2026-02-11 | 13F | Franklin Resources Inc | 30.968 | -3,20 | 2.884 | -1,20 | ||||
| 2026-04-27 | 13F | Denver Wealth Management, Inc. | 3.047 | 293 | ||||||
| 2026-01-28 | 13F | Geneos Wealth Management Inc. | 276 | 0,00 | 26 | 0,00 | ||||
| 2026-02-17 | 13F | Bank Of America Corp /de/ | 293.924 | 39,85 | 27.370 | 42,77 | ||||
| 2026-02-03 | 13F | Retirement Planning Group | 6.779 | 2,53 | 631 | 4,64 | ||||
| 2026-02-10 | 13F | SCS Capital Management LLC | 6.859 | 0,00 | 639 | 2,08 | ||||
| 2026-02-13 | 13F | MAI Capital Management | 48.120 | 0,61 | 4.481 | 2,68 | ||||
| 2026-03-26 | 13F | Leonteq Securities AG | Put | 0 | -100,00 | 0 | ||||
| 2026-01-29 | 13F | UBS Group AG | 236.315 | -14,14 | 22.006 | -12,36 | ||||
| 2026-02-17 | 13F | Glenmede Trust Co Na | 7.821 | 0,00 | 728 | 25,95 | ||||
| 2026-02-14 | 13F | Rockefeller Capital Management L.P. | 8.985 | 7,42 | 837 | 9,57 | ||||
| 2026-04-13 | 13F | IFP Advisors, Inc | 872 | 0,00 | 84 | 2,47 | ||||
| 2025-11-14 | 13F | Tudor Investment Corp Et Al | 0 | -100,00 | 0 | |||||
| 2026-02-17 | 13F | Royal Bank Of Canada | 306.947 | -6,95 | 28.583 | -5,01 | ||||
| 2026-02-10 | 13F/A | Northwestern Mutual Wealth Management Co | 348 | 0,00 | 32 | 3,23 | ||||
| 2026-02-13 | 13F | National Bank Of Canada /fi/ | 16.135 | 108,79 | 1.502 | 113,21 | ||||
| 2026-02-17 | 13F | Edmond De Rothschild Holding S.a. | 79.720 | 0,89 | 7.424 | 2,98 | ||||
| 2026-02-04 | 13F | swisspartners Advisors Ltd | 20.425 | 49,91 | 1.900 | 52,53 | ||||
| 2026-02-17 | 13F | Raymond James Financial Inc | 67.061 | -1,54 | 6.245 | 0,50 | ||||
| 2026-01-21 | 13F | Prime Capital Investment Advisors, LLC | 6.413 | 0,05 | 597 | 2,23 | ||||
| 2026-02-11 | 13F | LPL Financial LLC | 96.936 | 450,52 | 9.027 | 462,02 | ||||
| 2025-11-13 | 13F | Prudential Financial Inc | 0 | -100,00 | 0 | |||||
| 2026-02-06 | 13F | Saranac Partners Ltd | 2.500 | 0,00 | 233 | 1,75 | ||||
| 2026-02-12 | 13F | Saudi Central Bank | 0 | -100,00 | 0 | |||||
| 2026-02-13 | 13F | SRS Capital Advisors, Inc. | 28 | 3 | ||||||
| 2026-02-02 | 13F | Breakwater Investment Management | 4.761 | 0,00 | 443 | 2,07 | ||||
| 2026-02-12 | 13F | Groupe la Francaise | 0 | -100,00 | 0 | |||||
| 2026-02-04 | 13F | Bailard, Inc. | 52.723 | 1,04 | 4.910 | 3,15 | ||||
| 2026-02-17 | 13F | Cresset Asset Management, LLC | 7.600 | -6,51 | 708 | -4,59 | ||||
| 2026-04-28 | 13F | South Shore Capital Advisors | 0 | -100,00 | 0 | |||||
| 2026-04-13 | 13F | Fiduciary Financial Group, Llc | 122.532 | 1,87 | 11.799 | 5,34 | ||||
| 2026-02-09 | 13F | Arvest Bank Trust Division | 0 | -100,00 | 0 | |||||
| 2026-01-30 | 13F | Caldwell Securities, Inc | 4.800 | -4,99 | 447 | -3,04 | ||||
| 2026-02-05 | 13F | Cambridge Investment Research Advisors, Inc. | 2.811 | -7,35 | 0 | |||||
| 2026-01-30 | 13F | Us Bancorp \de\ | 46 | 0,00 | 4 | 0,00 | ||||
| 2026-02-17 | 13F | Boothbay Fund Management, Llc | Call | 0 | -100,00 | 0 | ||||
| 2026-04-07 | 13F | Farther Finance Advisors, LLC | 47 | 0,00 | 5 | 0,00 | ||||
| 2026-04-21 | 13F | River Street Advisors LLC | 3.198 | 0,00 | 308 | 3,37 | ||||
| 2026-02-17 | 13F | Qube Research & Technologies Ltd | 1.735 | 23,93 | 162 | 26,77 | ||||
| 2026-04-27 | 13F | Y-Intercept (Hong Kong) Ltd | 13.131 | 116,22 | 1.264 | 123,72 | ||||
| 2026-01-27 | 13F | Zurcher Kantonalbank (Zurich Cantonalbank) | 34 | 3 | ||||||
| 2026-02-13 | 13F | Mariner, LLC | 2.732 | 7,60 | 254 | 9,96 | ||||
| 2026-01-28 | 13F | Rothschild & Co Wealth Management UK Ltd | 57.486 | -16,77 | 5.353 | -15,03 | ||||
| 2026-02-17 | 13F | Jones Financial Companies Lllp | 1.481 | -23,74 | 138 | -21,26 | ||||
| 2026-01-21 | 13F | Summa Corp. | 5.500 | 0,00 | 512 | 2,20 | ||||
| 2026-01-29 | 13F | Sanctuary Advisors, LLC | 11.708 | 3,34 | 1.090 | 5,52 | ||||
| 2026-02-13 | 13F | Ieq Capital, Llc | 7.147 | 51,00 | 665 | 54,29 | ||||
| 2026-04-13 | 13F | Loring Wolcott & Coolidge Fiduciary Advisors Llp/ma | 276 | 0,00 | 28 | 0,00 | ||||
| 2026-02-12 | 13F | BlackRock, Inc. | 25.017 | -3,87 | 2.330 | -1,85 | ||||
| 2026-02-03 | 13F | Orion Capital Management LLC | 80 | 0,00 | 7 | 0,00 | ||||
| 2026-04-07 | 13F | U.S. Capital Wealth Advisors, LLC | 3.164 | 11,92 | 305 | 15,59 | ||||
| 2026-02-17 | 13F | Advisory Services Network, LLC | 8.852 | 0,84 | 824 | 3,00 | ||||
| 2026-02-09 | 13F | Mmbg Investment Advisors Co. | 16.360 | 0,00 | 1.523 | 2,08 | ||||
| 2026-02-10 | 13F | Fpc Investment Advisory, Inc. | 27.688 | -9,99 | 2.578 | -8,13 | ||||
| 2026-02-12 | 13F | Commonwealth Equity Services, Llc | 32.532 | -83,82 | 3.029 | 16.727,78 | ||||
| 2026-02-17 | 13F | Boreal Capital Management LLC | 216 | 0,00 | 20 | 5,26 | ||||
| 2026-02-17 | 13F | Fullerton Fund Management Co Ltd | 0 | -100,00 | 0 | |||||
| 2025-11-14 | 13F | EFG Asset Management (Americas) Corp. | 67.829 | 18,91 | 6.187 | 31,30 | ||||
| 2026-04-14 | 13F | Banque Pictet & Cie Sa | 10.655 | -1,81 | 1.026 | 1,49 | ||||
| 2026-04-16 | 13F | Vaughan Nelson Investment Management, L.p. | 70 | -98,43 | 7 | -98,55 | ||||
| 2026-04-22 | 13F | Union Bancaire Privee, UBP SA | 21.332 | 25,60 | 1.984 | 25,98 | ||||
| 2026-01-26 | 13F | AE Wealth Management LLC | 43 | 4 | ||||||
| 2026-02-13 | 13F | Citigroup Inc | 45.671 | 7,34 | 4.253 | 9,56 | ||||
| 2026-02-10 | 13F | Crescent Grove Advisors, LLC | 3.736 | 1,25 | 348 | 3,27 | ||||
| 2026-02-19 | 13F | CI Private Wealth, LLC | 72.507 | -0,62 | 6.752 | 1,46 | ||||
| 2026-02-13 | 13F | Pragma Gestao De Patrimonio Ltd | 665.400 | 10,17 | 61.962 | 12,46 | ||||
| 2026-02-17 | 13F | Ameriprise Financial Inc | 18.276 | 1,56 | 1.702 | 3,59 | ||||
| 2026-02-13 | 13F | Barclays Plc | 5.894 | 86,99 | 549 | 90,94 | ||||
| 2026-04-09 | 13F | Goelzer Investment Management, Inc. | 6.693 | 0,00 | 644 | 3,37 | ||||
| 2026-04-22 | 13F | Finley Financial, LLC | 7.395 | -0,80 | 712 | 2,59 | ||||
| 2026-02-17 | 13F | Susquehanna International Group, Llp | 44.166 | 865,38 | 4.113 | 886,09 | ||||
| 2026-02-17 | 13F | Susquehanna International Group, Llp | Call | 6.500 | 1,56 | 605 | 3,77 | |||
| 2026-02-04 | 13F | BCJ Capital Management, LLC | 0 | -100,00 | 0 | |||||
| 2026-02-11 | 13F | J.Safra Asset Management Corp | 844.489 | 4,61 | 78.639 | 6,79 | ||||
| 2026-02-10 | 13F | Gruss & Co., LLC | 24.000 | 17,07 | 2.235 | 19,47 | ||||
| 2026-04-16 | 13F | Evolve Private Wealth, Llc | 3.033 | 292 | ||||||
| 2026-02-12 | 13F | Renaissance Technologies Llc | 48.318 | 4.499 | ||||||
| 2026-02-17 | 13F | Moneda S.A. Administradora General de Fondos | 31.088 | 18,97 | 2.895 | 16,88 | ||||
| 2026-02-17 | 13F | Logan Stone Capital, LLC | 8.699 | 810 | ||||||
| 2026-01-07 | 13F | Procyon Private Wealth Partners, LLC | 2.500 | 233 | ||||||
| 2026-04-07 | 13F | Pathway Financial Advisors LLC | 31.087 | 0,66 | 2.988 | -1,16 | ||||
| 2026-04-17 | 13F | Webster Bank, N. A. | 4.403 | -6,02 | 424 | -2,98 | ||||
| 2026-02-12 | 13F | Betterment LLC | 10.854 | 2,04 | 1 | |||||
| 2026-02-11 | 13F | O'shaughnessy Asset Management, Llc | 43 | 0,00 | 4 | 33,33 | ||||
| 2026-02-13 | 13F | Global Endowment Management, LP | 165.409 | -0,10 | 15.403 | 1,98 | ||||
| 2026-02-11 | 13F | Jpmorgan Chase & Co | 2.924.751 | 1,52 | 272.353 | 3,64 | ||||
| 2026-04-21 | 13F | Tritonpoint Wealth, Llc | 4.020 | -1,71 | 387 | 1,84 | ||||
| 2026-04-28 | 13F | ORG Wealth Partners, LLC | 18 | 0,00 | 2 | 0,00 | ||||
| 2026-02-13 | 13F | Marshall Wace, Llp | 27.734 | 2.583 | ||||||
| 2026-02-13 | 13F | City Of London Investment Management Co Ltd | 42.200 | 3.930 | ||||||
| 2026-03-05 | 13F | Cedarwood Wealth LLC | 4.957 | 496 | ||||||
| 2026-02-05 | 13F | Bank Julius Baer & Co. Ltd, Zurich | 260.708 | 1,33 | 24.277 | 3,45 | ||||
| 2026-02-13 | 13F | Wells Fargo & Company/mn | 55.020 | 59,19 | 5.123 | 62,53 | ||||
| 2025-11-07 | 13F | Zions Bancorporation, National Association /ut/ | 0 | -100,00 | 0 | -100,00 | ||||
| 2026-02-05 | 13F | Accredited Investors Inc. | 4.214 | 0,00 | 392 | 2,08 | ||||
| 2026-04-21 | 13F | Yoffe Investment Management, LLC | 3.592 | 0,00 | 346 | 3,29 | ||||
| 2026-02-12 | 13F | CIBC Private Wealth Group, LLC | 707.924 | -3,46 | 65.922 | -1,45 | ||||
| 2026-04-24 | 13F | KPP Advisory Services LLC | 5.964 | -66,67 | 574 | -65,55 | ||||
| 2026-02-17 | 13F | Cape Investment Advisory, Inc. | 6 | 0,00 | 1 | |||||
| 2026-02-17 | 13F | Mercer Global Advisors Inc /adv | 5.979 | 2,68 | 557 | 4,71 | ||||
| 2026-02-17 | 13F | Advisor Group Holdings, Inc. | 20.218 | -16,50 | 1.883 | -14,69 |