Grundlæggende statistik
| Institutionelle aktier (lange) | 353.273.998 - 93,52% (ex 13D/G) - change of 14,01MM shares 9,24% MRQ |
| Institutionel værdi (lang) | $ 5.768.782 USD ($1000) |
Institutionelt ejerskab og aktionærer
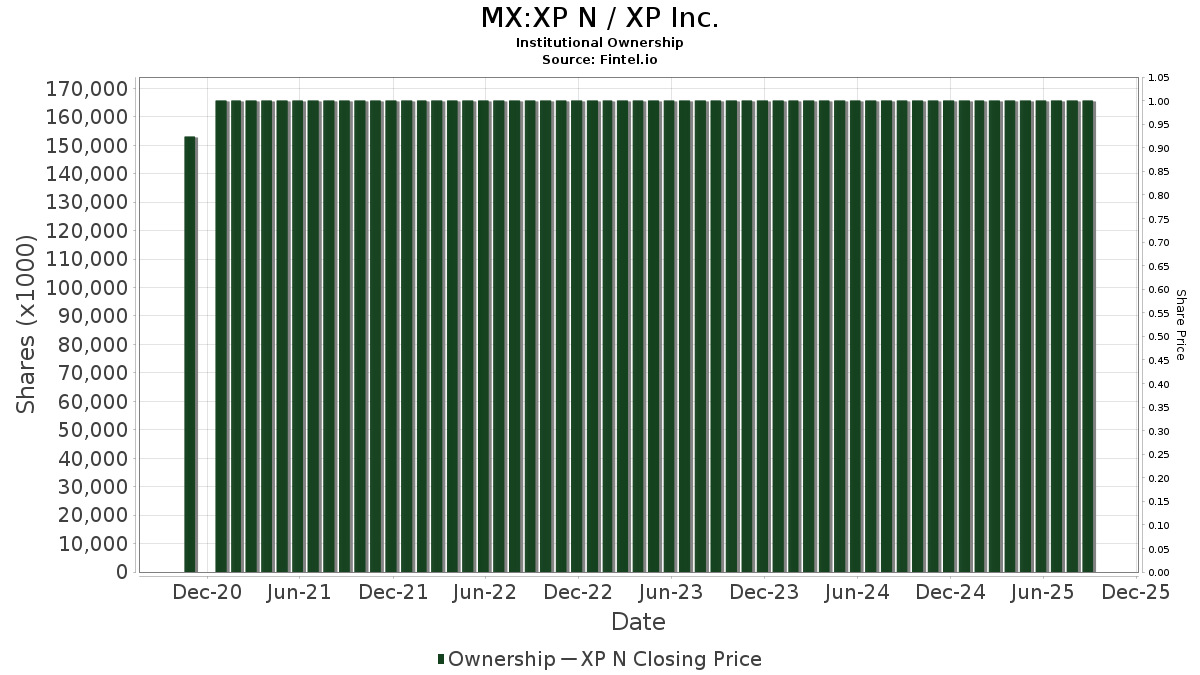
XP Inc. (MX:XP N) har 343 institutionelle ejere og aktionærer, der har indsendt 13D/G- eller 13F-formularer til Securities Exchange Commission (SEC). Disse institutioner har i alt 353,273,998 aktier. Største aktionærer omfatter BlackRock, Inc., Capital World Investors, Dodge & Cox, General Atlantic Llc, ARGA Investment Management, LP, Massachusetts Financial Services Co /ma/, Arrowstreet Capital, Limited Partnership, Morgan Stanley, State Street Corp, and Ninety One UK Ltd .
XP Inc. (BMV:XP N) institutionel ejerskabsstruktur viser aktuelle positioner i virksomheden efter institutioner og fonde, samt seneste ændringer i positionsstørrelse. Større aktionærer kan omfatte individuelle investorer, investeringsforeninger, hedgefonde eller institutioner. Skema 13D angiver, at investoren besidder (eller besidder) mere end 5 % af virksomheden og har til hensigt (eller har til hensigt at) aktivt at forfølge en ændring i forretningsstrategi. Skema 13G indikerer en passiv investering på over 5%.
Fondens stemningsscore
Fund Sentiment Score (fka Ownership Accumulation Score) finder de aktier, der bliver mest købt af fonde. Det er resultatet af en sofistikeret, multi-faktor kvantitativ model, der identificerer virksomheder med de højeste niveauer af institutionel akkumulering. Scoringsmodellen bruger en kombination af den samlede stigning i oplyste ejere, ændringerne i porteføljeallokeringer i disse ejere og andre målinger. Tallet går fra 0 til 100, hvor højere tal indikerer et højere niveau af akkumulering for sine jævnaldrende, og 50 er gennemsnittet.
Opdateringsfrekvens: Dagligt
Se Ownership Explorer, som giver en liste over højest rangerende virksomheder.
AI+ Ask Fintel’s AI assistant about XP Inc..
Select a question to share a public post with an AI-crafted answer.
Thinking of good questions…
13F og NPORT arkivering
Detaljer om 13F-arkivering er gratis. Detaljer om NP-ansøgninger kræver et premium-medlemskab. Grønne rækker angiver nye positioner. Røde rækker angiver lukkede positioner. Klik på linket ikon for at se den fulde transaktionshistorik.
Opgrader
for at låse premium-data op og eksportere til Excel ![]() .
.
| Fil dato | Kilde | Investor | Type | Gennemsnitlig pris (Øst) |
Aktier | Δ Aktier (%) |
Rapporteret Værdi ($1000) |
Δ Værdi (%) |
Port Alloc (%) |
|
|---|---|---|---|---|---|---|---|---|---|---|
| 2026-02-02 | 13F | Danske Bank A/s | 94.900 | -7,95 | 1.554 | -19,82 | ||||
| 2026-02-12 | 13F | Ensign Peak Advisors, Inc | 19.750 | 0,00 | 323 | -12,94 | ||||
| 2025-11-13 | 13F | Capital Fund Management S.a. | 0 | -100,00 | 0 | -100,00 | ||||
| 2026-02-12 | 13F | Principal Securities, Inc. | 0 | -100,00 | 0 | |||||
| 2026-02-13 | 13F | Dynamic Technology Lab Private Ltd | 0 | -100,00 | 0 | |||||
| 2026-02-03 | 13F | Ethic Inc. | 44.060 | 31,98 | 721 | 14,99 | ||||
| 2026-02-17 | 13F | Raymond James Financial Inc | 11.727 | -68,82 | 192 | -72,95 | ||||
| 2026-04-24 | 13F | Yousif Capital Management, Llc | 11.498 | 0,00 | 219 | 3,81 | ||||
| 2026-02-06 | 13F | Covestor Ltd | 8.382 | -0,93 | 0 | |||||
| 2026-02-11 | 13F | Inceptionr Llc | 0 | -100,00 | 0 | |||||
| 2026-02-13 | 13F | BNP Paribas Asset Management Holding S.A. | 264.766 | 4 | ||||||
| 2026-04-10 | 13F | Marshall Financial Group LLC | 10.351 | -11,78 | 197 | 2,60 | ||||
| 2026-02-10 | 13F | Triglav Skladi, D.o.o. | 46.033 | 31,52 | 754 | 14,61 | ||||
| 2026-01-08 | 13F | Nordea Investment Management Ab | 522.514 | 8.572 | ||||||
| 2026-02-23 | 13F | Virtu Financial LLC | 13.746 | 0 | ||||||
| 2026-02-13 | 13F | Royal London Asset Management Ltd | 333.300 | 0,48 | 5.456 | -12,45 | ||||
| 2026-02-17 | 13F | Lazard Asset Management Llc | 59.926 | -75,23 | 981 | -78,44 | ||||
| 2025-11-14 | 13F | L2 Asset Management, LLC | 0 | -100,00 | 0 | -100,00 | ||||
| 2026-02-13 | 13F | Inspire Advisors, LLC | 13.486 | 221 | ||||||
| 2026-04-06 | 13F | GAMMA Investing LLC | 13.024 | 21,15 | 248 | 41,14 | ||||
| 2026-04-20 | 13F | Jfs Wealth Advisors, Llc | 3 | 0,00 | 0 | |||||
| 2026-02-09 | 13F | Atlantic Trust, LLC | 429 | -6,74 | 7 | -12,50 | ||||
| 2026-02-13 | 13F | Pinnacle Wealth Planning Services, Inc. | 8.926 | 146 | ||||||
| 2026-02-13 | 13F | Prudential Financial Inc | 0 | -100,00 | 0 | |||||
| 2026-02-17 | 13F | Point72 Asset Management, L.P. | Put | 77.500 | 1.269 | |||||
| 2026-02-17 | 13F | Point72 Asset Management, L.P. | Call | 350.700 | 5.741 | |||||
| 2025-11-12 | 13F | 111 Capital | 0 | -100,00 | 0 | |||||
| 2026-02-17 | 13F | Point72 Asset Management, L.P. | 311.028 | 5.092 | ||||||
| 2026-02-06 | 13F | Handelsbanken Fonder AB | 295.584 | 23,23 | 5 | 0,00 | ||||
| 2026-02-10 | 13F | Sustainable Growth Advisers, LP | 680.170 | 27,13 | 11.134 | 10,76 | ||||
| 2026-02-12 | 13F | Hyperion Capital Advisors LP | 61.067 | 307,11 | 1.000 | 255,52 | ||||
| 2026-02-17 | 13F | Advisor Group Holdings, Inc. | 4.476 | -94,81 | 73 | -95,34 | ||||
| 2026-02-11 | 13F | Ramirez Asset Management, Inc. | 122 | 2 | ||||||
| 2026-02-13 | 13F | Dodge & Cox | 33.960.545 | -1,50 | 555.934 | -14,19 | ||||
| 2026-02-10 | 13F | Norges Bank | 4.898.974 | 80.196 | ||||||
| 2026-04-22 | 13F | Stone House Investment Management, LLC | 332 | 621,74 | 6 | |||||
| 2026-02-17 | 13F | Oaktree Capital Management Lp | 3.320.159 | 63,32 | 54.351 | 42,29 | ||||
| 2026-02-13 | 13F | Strategic Global Advisors, LLC | 0 | -100,00 | 0 | |||||
| 2026-04-23 | 13F | Impact Partnership Wealth, LLC | 0 | -100,00 | 0 | |||||
| 2026-04-08 | 13F | Grove Bank & Trust | 1.429 | -0,63 | 27 | 17,39 | ||||
| 2026-02-11 | 13F | Fox Run Management, L.l.c. | 0 | -100,00 | 0 | |||||
| 2025-11-12 | 13F | HAP Trading, LLC | Call | 450.900 | 1.429 | |||||
| 2025-11-12 | 13F | HAP Trading, LLC | Put | 41.700 | 71 | |||||
| 2026-02-06 | 13F | Larson Financial Group LLC | 861 | 46,43 | 14 | 27,27 | ||||
| 2026-01-23 | 13F | Sumitomo Mitsui Trust Holdings, Inc. | 799.887 | 3,17 | 13.094 | -10,11 | ||||
| 2026-02-12 | 13F | New York State Common Retirement Fund | 1.367.877 | 80,49 | 22.392 | 57,25 | ||||
| 2026-02-17 | 13F | Mercer Global Advisors Inc /adv | 0 | -100,00 | 0 | |||||
| 2026-02-09 | 13F/A | Swedbank AB | 221.900 | 0,00 | 3.633 | -12,88 | ||||
| 2026-01-13 | 13F | Dakota Wealth Management | 13.363 | 15,30 | 219 | 0,46 | ||||
| 2025-11-14 | 13F | Cubist Systematic Strategies, LLC | 0 | -100,00 | 0 | -100,00 | ||||
| 2025-11-05 | 13F | Machina Capital S.a.s. | 0 | -100,00 | 0 | |||||
| 2026-03-16 | 13F/A | Rockefeller Capital Management L.P. | 1.242 | 204,41 | 20 | 185,71 | ||||
| 2026-02-13 | 13F | Schroder Investment Management Group | 7.098.293 | -42,23 | 116.199 | -49,67 | ||||
| 2025-11-14 | 13F | Aquatic Capital Management LLC | 0 | -100,00 | 0 | |||||
| 2025-11-04 | 13F | UMA Financial Services, Inc. | 0 | -100,00 | 0 | |||||
| 2026-02-17 | 13F | Oaktree Fund Advisors, LLC | 187.074 | 59,99 | 3.062 | 39,37 | ||||
| 2026-02-06 | 13F | Resona Asset Management Co.,Ltd. | 93.751 | 5,32 | 1.536 | -8,36 | ||||
| 2026-02-17 | 13F | Wealth Watch Advisors, INC | 0 | -100,00 | 0 | |||||
| 2026-02-12 | 13F | Federated Hermes, Inc. | 1.454.534 | -0,59 | 23.811 | -13,40 | ||||
| 2026-02-17 | 13F | Jones Financial Companies Lllp | 61 | 0,00 | 1 | -100,00 | ||||
| 2026-02-17 | 13F | Bank Of America Corp /de/ | Put | 0 | -100,00 | 0 | ||||
| 2026-02-03 | 13F | SBI Securities Co., Ltd. | 386 | 0,00 | 6 | -14,29 | ||||
| 2026-02-10 | 13F | Envestnet Asset Management Inc | 119.168 | -5,84 | 1.951 | -18,00 | ||||
| 2026-02-05 | 13F/A | Truxt Investmentos Ltda. | 0 | -100,00 | 0 | -100,00 | ||||
| 2026-03-12 | 13F/A | Peak6 Llc | Call | 0 | -100,00 | 0 | -100,00 | |||
| 2026-02-13 | 13F | Headlands Technologies LLC | 28.122 | 460 | ||||||
| 2026-02-13 | 13F | Macquarie Group Ltd | 36.147 | -40,17 | 592 | -49,79 | ||||
| 2026-02-13 | 13F | Stifel Financial Corp | 116.882 | -27,58 | 1.913 | -36,91 | ||||
| 2026-02-17 | 13F | Bank Of America Corp /de/ | Call | 0 | -100,00 | 0 | ||||
| 2026-02-17 | 13F | Susquehanna International Group, Llp | 119.078 | -70,20 | 1.949 | -74,04 | ||||
| 2026-02-17 | 13F | Northern Trust Corp | 2.568.818 | 0,14 | 42.052 | -12,76 | ||||
| 2026-02-17 | 13F | Susquehanna International Group, Llp | Put | 583.200 | 20,67 | 9.547 | 5,12 | |||
| 2026-01-28 | 13F | Klp Kapitalforvaltning As | 112.500 | 0,00 | 1.842 | -12,87 | ||||
| 2026-02-13 | 13F | Neo Ivy Capital Management | 114.184 | 18,91 | 1.869 | 3,60 | ||||
| 2026-02-06 | 13F | Tredje AP-fonden | 0 | -100,00 | 0 | |||||
| 2026-02-17 | 13F | Susquehanna International Group, Llp | Call | 2.081.000 | 369,96 | 34.066 | 309,44 | |||
| 2026-02-13 | 13F | Mariner, LLC | 31.843 | -4,20 | 522 | -16,51 | ||||
| 2026-04-09 | 13F | Park Place Capital Corp | 103 | 0,00 | 2 | 0,00 | ||||
| 2026-02-17 | 13F | Wiley Bros.-aintree Capital, Llc | 23.646 | -60,44 | 387 | -65,54 | ||||
| 2026-02-17 | 13F | TB Capital Gestao de Recursos Ltda. | 0 | -100,00 | 0 | |||||
| 2026-04-13 | 13F | Massmutual Trust Co Fsb/adv | 1.098 | 28,57 | 21 | 53,85 | ||||
| 2026-02-13 | 13F | Sei Investments Co | 1.588.560 | 53,73 | 26.005 | 33,93 | ||||
| 2026-02-13 | 13F | National Bank Of Canada /fi/ | 335 | -6,69 | 5 | -16,67 | ||||
| 2026-02-11 | 13F | Capital Wealth Planning, LLC | 197.874 | -13,23 | 3.202 | -25,28 | ||||
| 2026-02-17 | 13F | Schonfeld Strategic Advisors LLC | 0 | -100,00 | 0 | |||||
| 2026-02-11 | 13F | OneAscent Investment Solutions LLC | 15.904 | -0,41 | 260 | -13,33 | ||||
| 2026-04-20 | 13F | Banque Cantonale Vaudoise | 160.000 | 3.046 | ||||||
| 2026-02-17 | 13F | Dauntless Investment Group, LLC | 46.696 | 132,67 | 764 | 102,65 | ||||
| 2026-02-17 | 13F | Maryland State Retirement & Pension System | 19.068 | 0,00 | 312 | -12,85 | ||||
| 2026-01-30 | 13F | Us Bancorp \de\ | 12.635 | -3,99 | 207 | -16,60 | ||||
| 2026-02-13 | 13F | BRITISH COLUMBIA INVESTMENT MANAGEMENT Corp | 155.600 | 11,62 | 2.547 | -2,75 | ||||
| 2026-02-06 | 13F | Leonteq Securities AG | 0 | -100,00 | 0 | |||||
| 2026-02-12 | 13F | Swiss National Bank | 880.564 | 8,88 | 14.415 | -5,15 | ||||
| 2026-02-06 | 13F | HighTower Advisors, LLC | 60.147 | -0,93 | 985 | -13,68 | ||||
| 2026-04-06 | 13F | Versant Capital Management, Inc | 5.228 | 25,73 | 100 | 45,59 | ||||
| 2025-11-06 | 13F | Financial Advocates Investment Management | 0 | -100,00 | 0 | -100,00 | ||||
| 2026-02-13 | 13F | PCM Encore, LLC | 12.793 | 209 | ||||||
| 2026-02-17 | 13F | Two Sigma Investments, Lp | 693.311 | 108,99 | 11.350 | 82,08 | ||||
| 2026-02-11 | 13F | Deutsche Bank Ag\ | 1.553.131 | 158,09 | 25.425 | 124,85 | ||||
| 2025-11-06 | 13F | Abich Financial Wealth Management LLC | 0 | -100,00 | 0 | |||||
| 2026-02-13 | 13F | Smartleaf Asset Management LLC | 357 | -61,65 | 6 | -70,59 | ||||
| 2026-02-13 | 13F | Virtus ETF Advisers LLC | 4.000 | 0,00 | 65 | -13,33 | ||||
| 2025-11-13 | 13F | Quadrature Capital Ltd | 0 | -100,00 | 0 | -100,00 | ||||
| 2026-02-13 | 13F | OMERS ADMINISTRATION Corp | 26.717 | 437 | ||||||
| 2026-02-13 | 13F | Martingale Asset Management L P | 30.171 | -53,17 | 494 | -59,26 | ||||
| 2026-02-13 | 13F | Fieldview Capital Management, LLC | 0 | -100,00 | 0 | |||||
| 2026-02-12 | 13F | Quadrant Capital Group Llc | 3.045 | -4,55 | 50 | -16,95 | ||||
| 2026-04-20 | 13F | Assenagon Asset Management S.A. | 1.930.445 | 146,11 | 36.756 | 186,25 | ||||
| 2026-01-27 | 13F | Zurcher Kantonalbank (Zurich Cantonalbank) | 91.010 | 0,00 | 1.490 | -12,92 | ||||
| 2026-01-28 | 13F | Teacher Retirement System Of Texas | 31.533 | -8,91 | 516 | -20,62 | ||||
| 2026-02-17 | 13F | Bamco Inc /ny/ | 1.195.477 | -35,57 | 19.570 | -43,87 | ||||
| 2026-02-06 | 13F | Pnc Financial Services Group, Inc. | 13.855 | 4,31 | 227 | -9,24 | ||||
| 2026-02-05 | 13F | WIM INVESTMENT MANAGEMENT Ltd | 0 | -100,00 | 0 | -100,00 | ||||
| 2026-02-17 | 13F | Caisse De Depot Et Placement Du Quebec | 167.968 | -78,30 | 2.750 | -81,10 | ||||
| 2026-02-10 | 13F | Rothschild Investment Llc | 121 | -97,85 | 2 | -99,05 | ||||
| 2026-02-17 | 13F | PDT Partners, LLC | 292.877 | -44,48 | 4.794 | -51,63 | ||||
| 2026-04-24 | 13F | Deltec Asset Management Llc | 13.000 | 248 | ||||||
| 2026-02-11 | 13F | Simplex Trading, Llc | Put | 192.400 | 30,62 | 3.150 | 157.350,00 | |||
| 2026-02-13 | 13F | Causeway Capital Management Llc | 0 | -100,00 | 0 | |||||
| 2026-02-17 | 13F | Lighthouse Investment Partners, LLC | 11.078 | 181 | ||||||
| 2025-10-31 | 13F | Investment House Llc | 0 | -100,00 | 0 | |||||
| 2026-04-24 | 13F | Ninety One North America, Inc. | 1.924.627 | 34,03 | 36.645 | 55,89 | ||||
| 2026-02-12 | 13F | Great Lakes Advisors, Llc | 384.593 | -27,98 | 6.296 | -37,26 | ||||
| 2026-01-29 | 13F | Matthews International Capital Management Llc | 101.999 | -68,13 | 1.670 | -72,24 | ||||
| 2026-02-17 | 13F | Tudor Investment Corp Et Al | Call | 11.000 | -81,85 | 180 | -84,18 | |||
| 2026-02-17 | 13F | Private Advisor Group, LLC | 17.889 | -45,71 | 293 | -52,83 | ||||
| 2026-02-12 | 13F | Provida Pension Fund Administrator | 0 | -100,00 | 0 | -100,00 | ||||
| 2026-02-17 | 13F | Tudor Investment Corp Et Al | Put | 44.700 | 288,70 | 732 | 238,43 | |||
| 2026-01-29 | 13F | Sanctuary Advisors, LLC | 52.916 | -23,31 | 866 | -33,18 | ||||
| 2026-02-17 | 13F | Tudor Investment Corp Et Al | 22.154 | 363 | ||||||
| 2026-02-11 | 13F | Havemeyer Place LP | 51.663 | 846 | ||||||
| 2026-02-17 | 13F | Tower Research Capital LLC (TRC) | 1.479 | -31,69 | 24 | -40,00 | ||||
| 2026-01-22 | 13F | Massachusetts Financial Services Co /ma/ | 12.263.021 | 11,87 | 200.746 | -2,54 | ||||
| 2026-02-12 | 13F | Hollencrest Capital Management | 3 | 0,00 | 0 | |||||
| 2026-02-13 | 13F | Kilter Group LLC | 65 | -12,16 | 1 | 0,00 | ||||
| 2026-04-23 | 13F | Drucker Wealth 3.0, LLC | 36.176 | 7,45 | 689 | 24,86 | ||||
| 2026-02-13 | 13F | Cloverfields Capital Group, Lp | 0 | -100,00 | 0 | |||||
| 2026-02-13 | 13F | SRS Capital Advisors, Inc. | 363 | -88,07 | 6 | -91,23 | ||||
| 2026-02-13 | 13F | MAI Capital Management | 68 | -6,85 | 1 | 0,00 | ||||
| 2026-02-17 | 13F | Voloridge Investment Management, Llc | 1.243.222 | -43,65 | 20.352 | -50,91 | ||||
| 2026-04-22 | 13F | Sterling Capital Management LLC | 12.348 | -42,79 | 235 | -33,43 | ||||
| 2026-02-12 | 13F | Skandinaviska Enskilda Banken AB (publ) | 20.434 | -63,64 | 335 | -68,34 | ||||
| 2026-02-13 | 13F | Public Sector Pension Investment Board | 0 | -100,00 | 0 | |||||
| 2026-02-17 | 13F | California State Teachers Retirement System | 87.653 | 62,00 | 1.435 | 41,14 | ||||
| 2026-02-13 | 13F | Entropy Technologies, LP | 0 | -100,00 | 0 | |||||
| 2025-11-06 | 13F | Applied Finance Capital Management, LLC | 0 | -100,00 | 0 | |||||
| 2026-02-13 | 13F | Walleye Trading LLC | Put | 161.400 | -45,33 | 2.642 | -52,36 | |||
| 2026-02-13 | 13F | Blueshift Asset Management, LLC | 0 | -100,00 | 0 | |||||
| 2026-04-15 | 13F | Merit Financial Group, LLC | 15.261 | 14,63 | 291 | 33,64 | ||||
| 2026-01-30 | 13F | ARGA Investment Management, LP | 19.900.087 | 119,16 | 325.764 | 90,94 | ||||
| 2026-02-09 | 13F | William Blair Investment Management, Llc | 596.760 | -67,79 | 9.769 | -71,94 | ||||
| 2026-02-13 | 13F | Walleye Trading LLC | Call | 133.200 | -36,54 | 2.180 | -44,73 | |||
| 2026-02-13 | 13F | Walleye Trading LLC | 458.496 | 118,47 | 7.506 | 90,34 | ||||
| 2025-11-13 | 13F | Renaissance Technologies Llc | 0 | -100,00 | 0 | |||||
| 2026-02-04 | 13F | INCA Investments LLC | 0 | -100,00 | 0 | |||||
| 2026-02-12 | 13F | Federation des caisses Desjardins du Quebec | 16.292 | 11,86 | 267 | -2,56 | ||||
| 2026-02-12 | 13F | Campbell & CO Investment Adviser LLC | 0 | -100,00 | 0 | |||||
| 2026-02-13 | 13F | Walleye Capital LLC | Call | 56.000 | 55,99 | 917 | 35,91 | |||
| 2026-02-13 | 13F | Walleye Capital LLC | Put | 101.000 | 8,72 | 1.653 | -5,27 | |||
| 2026-02-13 | 13F | Walleye Capital LLC | 16.432 | 245,36 | 269 | 201,12 | ||||
| 2026-01-30 | 13F | Wealth High Governance Capital Ltda | 610.262 | 9.990 | ||||||
| 2026-02-13 | 13F | Arrowstreet Capital, Limited Partnership | 11.799.175 | 10,91 | 193.152 | -3,37 | ||||
| 2026-02-17 | 13F | Armistice Capital, Llc | 18.204 | 298 | ||||||
| 2026-02-13 | 13F | Verition Fund Management LLC | 151.819 | 1,01 | 2.485 | -12,00 | ||||
| 2026-02-13 | 13F | VPR Management LLC | 37.068 | 0,00 | 607 | -12,93 | ||||
| 2026-02-13 | 13F | Rhumbline Advisers | 400.214 | -2,61 | 6.551 | -15,15 | ||||
| 2026-02-13 | 13F | Umb Bank N A/mo | 25 | -16,67 | 0 | |||||
| 2026-01-29 | 13F | Rakuten Securities, Inc. | 13 | -18,75 | 0 | |||||
| 2026-02-05 | 13F | North Dakota State Investment Board | 14.347 | 235 | ||||||
| 2026-02-13 | 13F | Police & Firemen's Retirement System of New Jersey | 212.050 | -4,77 | 3.471 | -17,02 | ||||
| 2026-02-17 | 13F | Russell Investments Group, Ltd. | 1.509.009 | 2,96 | 24.709 | -10,50 | ||||
| 2026-01-26 | 13F | JGP Global Gestao de Recursos Ltda. | 250.064 | -58,40 | 4.094 | -63,76 | ||||
| 2026-02-17 | 13F | Two Sigma Advisers, Lp | 0 | -100,00 | 0 | |||||
| 2026-02-19 | 13F | Invesco Ltd. | 594.745 | 64,33 | 9.736 | 43,16 | ||||
| 2026-02-13 | 13F | Nfj Investment Group, Llc | 53.884 | 4,94 | 882 | -8,51 | ||||
| 2026-02-10 | 13F/A | Northwestern Mutual Wealth Management Co | 86 | 1 | ||||||
| 2026-04-16 | 13F | Tandem Capital Management Corp /adv | 19.663 | -2,67 | 374 | 13,33 | ||||
| 2026-02-11 | 13F | SOUTH STATE Corp | 30 | 0,00 | 0 | |||||
| 2026-04-21 | 13F | OneAscent Wealth Management LLC | 21.040 | 15,41 | 401 | 34,23 | ||||
| 2026-02-17 | 13F | Summit Trail Advisors, Llc | 26.134 | 17,28 | 428 | 2,15 | ||||
| 2026-01-30 | 13F | Turning Point Benefit Group, Inc. | 12 | 0,00 | 0 | |||||
| 2025-11-14 | 13F | Two Sigma Securities, Llc | 0 | -100,00 | 0 | |||||
| 2026-02-12 | 13F | BRYN MAWR TRUST Co | 0 | -100,00 | 0 | -100,00 | ||||
| 2026-02-17 | 13F | Cetera Investment Advisers | 11.518 | -72,58 | 189 | -76,17 | ||||
| 2026-01-16 | 13F | Standard Life Aberdeen plc | 27.076 | 7,44 | 443 | -6,34 | ||||
| 2026-02-12 | 13F | Jane Street Group, Llc | 0 | -100,00 | 0 | -100,00 | ||||
| 2026-02-13 | 13F | Diametric Capital, LP | 35.697 | 584 | ||||||
| 2026-02-13 | 13F | Absolute Gestao de Investimentos Ltda. | 2.262.857 | 108,63 | 37.043 | 81,77 | ||||
| 2026-01-27 | 13F | Novem Group | 0 | -100,00 | 0 | |||||
| 2026-02-17 | 13F | Atom Investors LP | 0 | -100,00 | 0 | |||||
| 2026-02-02 | 13F | Principal Financial Group Inc | 11.416 | -23,35 | 187 | -33,33 | ||||
| 2026-01-30 | 13F | State of New Jersey Common Pension Fund D | 113.593 | -35,41 | 1.860 | -43,73 | ||||
| 2026-02-17 | 13F | Price T Rowe Associates Inc /md/ | 198.103 | 5,97 | 3 | 0,00 | ||||
| 2026-02-11 | 13F | Los Angeles Capital Management Llc | 1.192.359 | 5,37 | 21.343 | 0,38 | ||||
| 2026-02-17 | 13F | GAM Holding AG | 248.615 | 387,48 | 4.070 | 324,74 | ||||
| 2026-02-13 | 13F | Treasurer of the State of North Carolina | 457.144 | -3,59 | 7 | -12,50 | ||||
| 2026-02-17 | 13F | Credit Agricole S A | 14.200 | 0,00 | 232 | -12,78 | ||||
| 2026-02-17 | 13F | Fmr Llc | 7.360.536 | 2,24 | 120.492 | -10,93 | ||||
| 2026-02-17 | 13F | Millennium Management Llc | 1.792.836 | 492,52 | 29.349 | 416,24 | ||||
| 2026-02-17 | 13F | Engineers Gate Manager LP | 100.677 | -49,83 | 1.648 | -56,29 | ||||
| 2025-11-14 | 13F | Teza Capital Management LLC | 0 | -100,00 | 0 | -100,00 | ||||
| 2025-11-07 | 13F | Gsa Capital Partners Llp | 0 | -100,00 | 0 | |||||
| 2025-11-14 | 13F | Natixis | 0 | -100,00 | 0 | -100,00 | ||||
| 2026-04-13 | 13F | True Wealth Design, LLC | 70 | 0,00 | 1 | 0,00 | ||||
| 2026-02-17 | 13F | Millennium Management Llc | Call | 0 | -100,00 | 0 | ||||
| 2026-02-11 | 13F | Simplex Trading, Llc | 0 | -100,00 | 0 | -100,00 | ||||
| 2026-02-05 | 13F | Bessemer Group Inc | 121 | 0 | ||||||
| 2026-02-17 | 13F | Trexquant Investment LP | 48.172 | -88,38 | 789 | -89,89 | ||||
| 2026-02-06 | 13F | Kimelman & Baird, LLC | 3 | 0,00 | 0 | |||||
| 2026-02-23 | 13F | Mv Capital Management, Inc. | 257 | 0,00 | 4 | -20,00 | ||||
| 2026-04-23 | 13F | Oppenheimer Asset Management Inc. | 11.451 | 0,00 | 218 | 16,58 | ||||
| 2026-02-12 | 13F | State Board Of Administration Of Florida Retirement System | 295.581 | 0,00 | 4.839 | -12,88 | ||||
| 2026-02-13 | 13F | JustInvest LLC | 11.983 | -6,04 | 196 | -17,99 | ||||
| 2026-02-17 | 13F | General Atlantic Llc | 22.699.133 | -11,05 | 371.585 | -22,50 | ||||
| 2026-02-17 | 13F | Amundi | 761.804 | 25,79 | 12.471 | 20,27 | ||||
| 2026-04-15 | 13F | FNY Investment Advisers, LLC | 0 | -100,00 | 0 | |||||
| 2026-04-15 | 13F | Activest Wealth Management | 124 | 6,90 | 2 | 100,00 | ||||
| 2026-02-13 | 13F | 1832 Asset Management L.P. | 10.949 | 179 | ||||||
| 2026-02-11 | 13F | Brandywine Global Investment Management, LLC | 110.609 | 1.811 | ||||||
| 2026-04-02 | 13F | Ares Financial Consulting, LLC | 42 | 0,00 | 1 | |||||
| 2026-01-29 | 13F | UBS Group AG | 1.441.237 | 102,90 | 23.593 | 76,77 | ||||
| 2026-02-10 | 13F | Quantbot Technologies LP | 0 | -100,00 | 0 | |||||
| 2026-02-13 | 13F | Barclays Plc | 68.772 | 40,21 | 1.126 | 22,15 | ||||
| 2025-11-14 | 13F | AXA Investment Managers S.A. | 36.020 | 677 | ||||||
| 2026-02-03 | 13F | Mitsubishi UFJ Kokusai Asset Management Co., Ltd. | 457.119 | 29,60 | 7.396 | 11,60 | ||||
| 2026-04-06 | 13F | CX Institutional | 582 | 0 | ||||||
| 2026-02-12 | 13F | DRW Securities, LLC | 29.079 | 46,59 | 476 | 27,27 | ||||
| 2026-02-17 | 13F | Capstone Investment Advisors, Llc | 0 | -100,00 | 0 | -100,00 | ||||
| 2026-02-12 | 13F | Voya Investment Management Llc | 357.587 | -2,07 | 5.854 | -14,69 | ||||
| 2026-02-17 | 13F | FIL Ltd | 892.359 | 32,98 | 14.608 | 15,86 | ||||
| 2026-02-12 | 13F | MetLife Investment Management, LLC | 8.159 | -3,49 | 134 | -15,82 | ||||
| 2026-02-17 | 13F | Utah Retirement Systems | 21.424 | 0,00 | 351 | -12,94 | ||||
| 2026-04-24 | 13F | Root Financial Partners, LLC | 70 | 311,76 | 1 | |||||
| 2026-02-17 | 13F | Breakout Capital Partners, LP | 0 | -100,00 | 0 | -100,00 | ||||
| 2026-04-16 | 13F | Diversified Trust Co | 0 | -100,00 | 0 | |||||
| 2026-02-10 | 13F | Intech Investment Management Llc | 0 | -100,00 | 0 | |||||
| 2026-01-15 | 13F | Nisa Investment Advisors, Llc | 150 | -57,14 | 2 | -66,67 | ||||
| 2026-02-11 | 13F | Allianz Asset Management GmbH | 200.930 | 124,56 | 3.289 | 95,66 | ||||
| 2026-02-13 | 13F | Victory Capital Management Inc | 0 | -100,00 | 0 | |||||
| 2026-02-11 | 13F | Prudential Plc | 23.362 | -9,88 | 382 | -21,56 | ||||
| 2026-04-22 | 13F | Pictet Asset Management Holding SA | 532.173 | -1,36 | 10.133 | 14,73 | ||||
| 2026-02-11 | 13F | Arizona PSPRS Trust | 0 | -100,00 | 0 | |||||
| 2026-02-13 | 13F | Banco Santander, S.A. | 33.696 | 552 | ||||||
| 2026-02-09 | 13F | Legal & General Group Plc | 2.760.141 | 9,01 | 45.184 | -5,03 | ||||
| 2026-02-10 | 13F | Fideuram Asset Management (Ireland) dac | 10.404 | 141 | ||||||
| 2025-11-07 | 13F | Shell Asset Management Co | 2.689 | -74,82 | 0 | |||||
| 2026-02-10 | 13F | Acadian Asset Management Llc | 346.126 | -62,67 | 6 | -70,59 | ||||
| 2025-11-21 | 13F | Nebula Research & Development LLC | 0 | -100,00 | 0 | -100,00 | ||||
| 2026-01-29 | 13F | Vanguard Group Inc | 3.784.717 | 4,72 | 61.956 | -8,77 | ||||
| 2026-02-10 | 13F | BW Gestao de Investimentos Ltda. | 389.738 | 6.380 | ||||||
| 2026-01-28 | 13F | Kapitalo Investimentos Ltda | 225.664 | 0,00 | 3.694 | -12,88 | ||||
| 2026-02-17 | 13F | DZ BANK AG Deutsche Zentral Genossenschafts Bank, Frankfurt am Main | 385.242 | 6.306 | ||||||
| 2026-02-18 | 13F | Mackenzie Financial Corp | 297.059 | -52,03 | 4.904 | -57,86 | ||||
| 2026-02-13 | 13F | Ubs Asset Management Americas Inc | 2.391.289 | 39.145 | ||||||
| 2026-02-12 | 13F | Nuveen, LLC | 1.438.237 | 0,65 | 23.544 | -12,31 | ||||
| 2026-02-13 | 13F | American Century Companies Inc | 2.490.307 | 2,90 | 40.766 | -10,36 | ||||
| 2026-02-09 | 13F | Hartland & Co., LLC | 82 | -60,95 | 1 | -66,67 | ||||
| 2026-02-13 | 13F | Transamerica Financial Advisors, Inc. | 185 | 3 | ||||||
| 2026-02-10 | 13F | Globeflex Capital L P | 357.941 | 5,40 | 5.859 | -8,17 | ||||
| 2026-02-05 | 13F | Amalgamated Bank | 34.217 | 61,72 | 1 | |||||
| 2026-02-17 | 13F | Dark Forest Capital Management Lp | 0 | -100,00 | 0 | |||||
| 2026-02-11 | 13F | Vestcor Inc | 11.430 | 234,90 | 0 | |||||
| 2026-01-26 | 13F | La Banque Postale Asset Management SA | 141.145 | -7,31 | 2.311 | -19,26 | ||||
| 2026-02-11 | 13F | Winton Capital Group Ltd | 65.000 | 1.064 | ||||||
| 2026-02-13 | 13F | Neuberger Berman Group LLC | 43.938 | -0,97 | 719 | -13,69 | ||||
| 2026-02-17 | 13F | Creative Planning | 69.663 | -10,63 | 1.140 | -22,13 | ||||
| 2026-02-04 | 13F | Virginia Retirement Systems Et Al | 0 | -100,00 | 0 | |||||
| 2026-02-17 | 13F | Ameriprise Financial Inc | 547.480 | -70,82 | 8.962 | -74,58 | ||||
| 2026-02-09 | 13F | Geode Capital Management, Llc | 4.866.728 | 4,39 | 79.285 | -9,06 | ||||
| 2026-02-09 | 13F | Fisher Asset Management, LLC | 4.377.265 | -3,14 | 71.656 | -15,61 | ||||
| 2026-02-13 | 13F | Wells Fargo & Company/mn | 26.331 | 31,27 | 431 | 14,63 | ||||
| 2026-02-12 | 13F | Aviva Plc | 289.977 | 8,97 | 4.747 | -5,08 | ||||
| 2026-02-12 | 13F | Earnest Partners Llc | 380.478 | -2,85 | 6.228 | -15,36 | ||||
| 2026-04-24 | 13F | Sumitomo Mitsui DS Asset Management Company, Ltd | 21.368 | 0,00 | 407 | 16,33 | ||||
| 2026-02-17 | 13F | MIRAE ASSET GLOBAL ETFS HOLDINGS Ltd. | 6.867 | 11,77 | 113 | -3,45 | ||||
| 2026-02-17 | 13F | Twinbeech Capital Lp | 319.928 | 5.237 | ||||||
| 2026-01-28 | 13F | WPG Advisers, LLC | 180 | 35,34 | 3 | 0,00 | ||||
| 2026-04-17 | 13F | Outlook Wealth Advisors, LLC | 18.907 | -0,46 | 360 | 15,81 | ||||
| 2025-11-06 | 13F | CIBC World Markets Inc. | 0 | -100,00 | 0 | -100,00 | ||||
| 2026-02-17 | 13F | Summit Global Investments | 0 | -100,00 | 0 | |||||
| 2026-04-20 | 13F | Ronald Blue Trust, Inc. | 3.664 | -7,54 | 70 | 7,81 | ||||
| 2026-01-26 | 13F | KBC Group NV | 171.436 | 37,39 | 3 | 0,00 | ||||
| 2026-02-05 | 13F | Elyxium Wealth, LLC | 238 | 4 | ||||||
| 2026-04-08 | 13F | Legacy Wealth Asset Management, LLC | 33.132 | 2,91 | 631 | 19,54 | ||||
| 2026-02-09 | 13F | Employees Retirement System of Texas | 25.905 | -57,00 | 0 | -100,00 | ||||
| 2026-02-11 | 13F | J.Safra Asset Management Corp | 600 | 10 | ||||||
| 2026-02-13 | 13F | First Trust Advisors Lp | 534.939 | -56,50 | 8.757 | -62,11 | ||||
| 2026-02-10 | 13F | Bnp Paribas Arbitrage, Sa | 1.123.191 | 122,52 | 18.387 | 93,86 | ||||
| 2026-02-26 | 13F/A | Aristides Capital LLC | Put | 500.000 | 0,00 | 8.185 | -12,88 | |||
| 2026-02-17 | 13F | Triveni Capital Investments LP | 333.734 | 5.463 | ||||||
| 2025-11-14 | 13F | Point72 Hong Kong Ltd | 0 | -100,00 | 0 | |||||
| 2026-02-11 | 13F | Parallel Advisors, LLC | 1.513 | 0,60 | 25 | -14,29 | ||||
| 2026-02-17 | 13F | Aqr Capital Management Llc | 289.332 | -15,17 | 4.736 | -26,09 | ||||
| 2026-03-06 | 13F | Hsbc Holdings Plc | 108.818 | 7,69 | 1.791 | -4,74 | ||||
| 2026-02-13 | 13F | Toroso Investments, LLC | 133.652 | -10,51 | 2.188 | -22,06 | ||||
| 2026-02-17 | 13F | SummitTX Capital, L.P. | 30.978 | 2,85 | 507 | -10,27 | ||||
| 2026-02-02 | 13F | Fifth Third Bancorp | 23 | 0,00 | 0 | |||||
| 2026-02-13 | 13F | Thornburg Investment Management Inc | 450.131 | 7.369 | ||||||
| 2026-02-17 | 13F | XTX Topco Ltd | 160.090 | 208,08 | 2.621 | 168,44 | ||||
| 2026-02-10 | 13F | Bruce G. Allen Investments, LLC | 33 | 0,00 | 1 | |||||
| 2026-02-17 | 13F | Man Group plc | 30.700 | 503 | ||||||
| 2026-02-13 | 13F | Y-Intercept (Hong Kong) Ltd | 0 | -100,00 | 0 | -100,00 | ||||
| 2026-02-18 | 13F | GWM Advisors LLC | 0 | -100,00 | 0 | |||||
| 2026-02-17 | 13F | Balyasny Asset Management Llc | 12.944 | -96,55 | 212 | -97,00 | ||||
| 2026-02-17 | 13F | Jump Financial, LLC | 192.093 | -73,16 | 3.145 | -76,62 | ||||
| 2025-11-14 | 13F | Wolverine Trading, Llc | 0 | -100,00 | 0 | -100,00 | ||||
| 2026-02-09 | 13F | Huntington National Bank | 35 | 0,00 | 1 | |||||
| 2026-04-17 | 13F | Bell Investment Advisors, Inc | 104 | 50,72 | 2 | 0,00 | ||||
| 2026-02-17 | 13F | Liontrust Investment Partners LLP | 231.700 | 953,18 | 3.793 | 754,05 | ||||
| 2026-02-13 | 13F | Bridgefront Capital, LLC | 16.725 | 33,52 | 274 | 16,17 | ||||
| 2026-02-13 | 13F | Korea Investment CORP | 161.000 | 14,84 | 2.636 | 0,04 | ||||
| 2026-02-12 | 13F | BlackRock, Inc. | 46.729.141 | 4,14 | 764.956 | -9,27 | ||||
| 2026-04-17 | 13F | Verde Servicos Internacionais S.A. | 168.923 | 3 | ||||||
| 2026-02-12 | 13F | Xponance, Inc. | 28.687 | -0,92 | 470 | -13,79 | ||||
| 2026-02-11 | 13F | Franklin Resources Inc | 2.734.137 | 10,34 | 44.758 | -3,88 | ||||
| 2026-02-20 | 13F/A | Atmos Capital Gestao De Recursos Ltda. | Call | 6.136.000 | 205,27 | 100.446 | 165,96 | |||
| 2026-02-20 | 13F/A | Atmos Capital Gestao De Recursos Ltda. | 5.621.659 | -32,66 | 92.027 | -41,34 | ||||
| 2026-04-07 | 13F | Farther Finance Advisors, LLC | 1.746 | -54,54 | 33 | -48,39 | ||||
| 2026-04-15 | 13F | Paragon Capital Management Ltd | 12.787 | -5,10 | 243 | 10,45 | ||||
| 2026-02-06 | 13F | Fairtree Asset Management (Pty) Ltd | 38.208 | 8,07 | 625 | -5,87 | ||||
| 2026-02-06 | 13F | Global Retirement Partners, LLC | 5.597 | 154,29 | 92 | 121,95 | ||||
| 2026-02-17 | 13F | EFG International AG | 48.637 | 796 | ||||||
| 2026-02-05 | 13F | Qsemble Capital Management, LP | 38.334 | 0,98 | 628 | -12,06 | ||||
| 2026-02-11 | 13F | O'shaughnessy Asset Management, Llc | 12.493 | 0,16 | 205 | -12,82 | ||||
| 2026-02-13 | 13F | Rokos Capital Management LLP | 231.317 | 3.790 | ||||||
| 2026-02-12 | 13F | Loomis Sayles & Co L P | 318.004 | -9,97 | 5.206 | -21,56 | ||||
| 2026-02-12 | 13F | Banco BTG Pactual S.A. | 23.909 | -61,10 | 391 | -66,12 | ||||
| 2026-02-11 | 13F | Capital World Investors | 37.497.038 | -6,04 | 613.829 | -18,14 | ||||
| 2026-02-06 | 13F | EverSource Wealth Advisors, LLC | 1.690 | 6,22 | 28 | -6,90 | ||||
| 2026-02-17 | 13F | Public Employees Retirement System Of Ohio | 1.936.961 | 54,12 | 31.708 | 34,28 | ||||
| 2026-01-30 | 13F | Pekin Hardy Strauss, Inc. | 14.500 | 237 | ||||||
| 2026-02-12 | 13F | Brinker Capital Investments, LLC | 17.777 | 10,93 | 291 | -3,32 | ||||
| 2026-02-12 | 13F | Hrt Financial Lp | 64.879 | -84,97 | 1 | -87,50 | ||||
| 2026-01-09 | 13F | Seafarer Capital Partners, LLC | 3.771.000 | 0,00 | 61.731 | -12,88 | ||||
| 2026-02-23 | 13F | Vinland Capital Management Gestora de Recursos LTDA. | Put | 0 | -100,00 | 0 | -100,00 | |||
| 2026-02-17 | 13F | 9823 Capital, L.P. | 11.198 | 183 | ||||||
| 2026-02-11 | 13F | LPL Financial LLC | 10.454 | -66,19 | 171 | -70,57 | ||||
| 2026-02-12 | 13F | California Public Employees Retirement System | 783.961 | 1,54 | 12.833 | -11,54 | ||||
| 2026-02-17 | 13F | Capital Fund Management S.a. | Call | 16.300 | 267 | |||||
| 2026-02-17 | 13F | Capital Fund Management S.a. | Put | 22.500 | -34,21 | 368 | -42,68 | |||
| 2026-02-10 | 13F | Bank of New York Mellon Corp | 1.255.393 | -1,77 | 20.551 | -14,42 | ||||
| 2026-01-27 | 13F | Asset Management One Co., Ltd. | 56.553 | -3,72 | 930 | -15,68 | ||||
| 2025-11-14 | 13F | Quarry LP | 0 | -100,00 | 0 | |||||
| 2026-01-23 | 13F | Halbert Hargrove Global Advisors, Llc | 0 | -100,00 | 0 | |||||
| 2026-02-17 | 13F | Royal Bank Of Canada | 469.548 | 19,35 | 7.686 | 3,98 | ||||
| 2026-02-17 | 13F | Mirabella Financial Services Llp | 262.897 | 4.304 | ||||||
| 2026-02-12 | 13F | CIBC Private Wealth Group, LLC | 133 | -15,29 | 2 | 0,00 | ||||
| 2026-04-23 | 13F | CWM Advisors, LLC | 89.121 | 1,03 | 1.697 | 17,45 | ||||
| 2026-02-17 | 13F | Bank Of America Corp /de/ | 3.857.852 | 0,78 | 63.153 | -12,20 | ||||
| 2026-04-22 | 13F | Advocate Investing Services LLC | 0 | -100,00 | 0 | |||||
| 2026-04-21 | 13F | OneAscent Financial Services LLC | 25.759 | 29,85 | 490 | 51,23 | ||||
| 2026-01-15 | 13F | Frank, Rimerman Advisors LLC | 14.606 | 0,00 | 239 | -12,77 | ||||
| 2026-01-23 | 13F | Diversify Advisory Services, LLC | 0 | -100,00 | 0 | |||||
| 2026-02-17 | 13F | Advisory Services Network, LLC | 0 | -100,00 | 0 | |||||
| 2025-11-06 | 13F | Whipplewood Advisors, LLC | 0 | -100,00 | 0 | |||||
| 2026-01-21 | 13F | Rheos Capital Works Inc. | 500.000 | 66,67 | 8 | 60,00 | ||||
| 2026-02-13 | 13F | State Street Corp | 9.503.007 | 1,55 | 155.564 | -11,53 | ||||
| 2026-04-22 | 13F | Janney Montgomery Scott LLC | 19.491 | -6,97 | 0 | |||||
| 2026-02-05 | 13F | Atria Investments Llc | 34.312 | -7,02 | 562 | -19,05 | ||||
| 2026-01-20 | 13F | Cromwell Holdings LLC | 53 | 0,00 | 1 | |||||
| 2025-10-30 | 13F | Rakuten Investment Management, Inc. | 0 | -100,00 | 0 | |||||
| 2025-11-17 | 13F | PharVision Advisers, LLC | 0 | -100,00 | 0 | |||||
| 2026-02-12 | 13F | Marex Group plc | 51.915 | 353,29 | 850 | 293,06 | ||||
| 2026-02-17 | 13F | Quantitative Investment Management, LLC | 0 | -100,00 | 0 | |||||
| 2026-02-13 | 13F | Manufacturers Life Insurance Company, The | 85.405 | 7,08 | 1.398 | -6,68 | ||||
| 2025-11-14 | 13F | Cubist Systematic Strategies, LLC | Put | 30.000 | 564 | |||||
| 2026-02-17 | 13F | Aster Capital Management (DIFC) Ltd | 3.390 | 55 | ||||||
| 2026-01-29 | 13F | IMC-Chicago, LLC | 132.945 | 114,06 | 2.176 | 86,62 | ||||
| 2025-11-14 | 13F | Petrus Trust Company, LTA | 0 | -100,00 | 0 | |||||
| 2026-01-29 | 13F | IMC-Chicago, LLC | Put | 175.400 | -20,38 | 2.871 | -30,64 | |||
| 2025-10-31 | 13F | Symphony Financial, Ltd. Co. | 0 | -100,00 | 0 | -100,00 | ||||
| 2026-02-12 | 13F | Aware Super Pty Ltd as trustee of Aware Super | 427.660 | 7.001 | ||||||
| 2026-01-29 | 13F | Quent Capital, LLC | 26 | -81,02 | 0 | -100,00 | ||||
| 2026-02-17 | 13F | Parallax Volatility Advisers, L.P. | Call | 119.600 | 1.958 | |||||
| 2026-02-05 | 13F | Allworth Financial LP | 505 | 35,75 | 8 | 33,33 | ||||
| 2026-02-17 | 13F | Canada Pension Plan Investment Board | 0 | -100,00 | 0 | |||||
| 2026-02-17 | 13F | Parallax Volatility Advisers, L.P. | 34.126 | 559 | ||||||
| 2026-04-07 | 13F | Signaturefd, Llc | 5.759 | -0,02 | 110 | 15,96 | ||||
| 2026-02-17 | 13F | PointState Capital LP | 571.756 | 9.360 | ||||||
| 2025-11-14 | 13F | WealthTrak Capital Management LLC | 0 | -100,00 | 0 | |||||
| 2026-01-30 | 13F | Mitsubishi UFJ Trust & Banking Corp | 905.893 | -12,54 | 14.829 | -23,81 | ||||
| 2025-11-10 | 13F | Barings Llc | 0 | -100,00 | 0 | |||||
| 2026-02-13 | 13F | Citigroup Inc | 1.103.495 | 19,59 | 18.064 | 4,19 | ||||
| 2026-02-10 | 13F | Nomura Asset Management Co Ltd | 56.100 | 0,00 | 918 | -12,90 | ||||
| 2026-02-17 | 13F | Graham Capital Management, L.P. | 20.650 | 11,50 | 338 | -2,87 | ||||
| 2026-01-26 | 13F | Cwm, Llc | 14.339 | -13,53 | 0 | |||||
| 2026-02-12 | 13F | Jane Street Group, Llc | Put | 25.800 | -71,55 | 422 | -75,23 | |||
| 2026-02-11 | 13F | Harvest Fund Management Co., Ltd | 52.676 | 48,22 | 1 | |||||
| 2026-02-12 | 13F | Jane Street Group, Llc | Call | 40.400 | -62,21 | 661 | -67,08 | |||
| 2026-02-17 | 13F | Polymer Capital Management (US) LLC | 18.873 | 309 | ||||||
| 2026-02-17 | 13F | Nomura Holdings Inc | 20.037 | 328 | ||||||
| 2026-02-17 | 13F | Citadel Advisors Llc | Call | 169.600 | -73,71 | 2.776 | -77,10 | |||
| 2026-02-17 | 13F | Citadel Advisors Llc | Put | 201.400 | -70,46 | 3.297 | -74,27 | |||
| 2026-02-11 | 13F | CenterBook Partners LP | 0 | -100,00 | 0 | -100,00 | ||||
| 2026-02-17 | 13F | Citadel Advisors Llc | 182.639 | -67,55 | 2.990 | -71,73 | ||||
| 2026-03-03 | 13F/A | Caitong International Asset Management Co., Ltd | 30 | -98,94 | 0 | -100,00 | ||||
| 2026-02-12 | 13F | APG Asset Management N.V. | 212.000 | 8,83 | 2.955 | -5,17 | ||||
| 2026-02-11 | 13F | Group One Trading, L.p. | Put | 95.800 | -46,90 | 1.568 | -53,73 | |||
| 2026-02-11 | 13F | Group One Trading, L.p. | 220.023 | 19,39 | 3.602 | 4,02 | ||||
| 2026-02-17 | 13F | Nissay Asset Management Corp /japan/ /adv | 270.979 | 4.436 | ||||||
| 2025-11-14 | 13F | Capitolis Liquid Global Markets LLC | 0 | -100,00 | 0 | |||||
| 2026-04-03 | 13F | Investors Research Corp | 0 | -100,00 | 0 | |||||
| 2026-02-17 | 13F | Squadra Investments - Gestao De Recursos Ltda. | Put | 0 | -100,00 | 0 | ||||
| 2026-02-12 | 13F | Bank Of Montreal /can/ | 1.290.621 | 21.127 | ||||||
| 2026-02-13 | 13F | Cornerstone Financial Management LLC | 56 | 1 | ||||||
| 2026-02-17 | 13F | Squadra Investments - Gestao De Recursos Ltda. | 4.793.735 | -30,20 | 78.473 | -39,19 | ||||
| 2026-02-10 | 13F | Goldman Sachs Group Inc | Call | 1.549.600 | 47,58 | 25.367 | 28,57 | |||
| 2026-02-10 | 13F | Goldman Sachs Group Inc | Put | 1.079.600 | -38,31 | 17.673 | -46,25 | |||
| 2026-02-13 | 13F | Marshall Wace, Llp | Put | 0 | -100,00 | 0 | ||||
| 2026-02-13 | 13F | Marshall Wace, Llp | 0 | -100,00 | 0 | |||||
| 2026-02-17 | 13F | D. E. Shaw & Co., Inc. | 296.491 | -18,37 | 4.854 | -28,88 | ||||
| 2026-02-10 | 13F | Goldman Sachs Group Inc | 1.570.073 | 69,48 | 25.702 | 47,65 | ||||
| 2026-02-13 | 13F | Marshall Wace, Llp | Call | 0 | -100,00 | 0 | ||||
| 2026-02-17 | 13F | Praetorian PR LLC | 1.000.000 | 0,00 | 16.370 | -12,88 | ||||
| 2026-02-13 | 13F | SPX Equities Gestao de Recursos Ltda | 4.195.379 | 109,74 | 68.678 | 82,73 | ||||
| 2026-02-04 | 13F | Swiss Life Asset Management Ltd | 46.486 | 30,13 | 761 | 13,26 | ||||
| 2026-04-13 | 13F | Global X Japan Co., Ltd. | 5.734 | 109 | ||||||
| 2026-04-16 | 13F | SG Americas Securities, LLC | 680.507 | 158,91 | 13 | 200,00 | ||||
| 2026-02-17 | 13F | Alliancebernstein L.p. | 487.810 | 185,22 | 7.985 | 148,52 | ||||
| 2025-11-14 | 13F | Susquehanna Portfolio Strategies, LLC | 0 | -100,00 | 0 | -100,00 | ||||
| 2026-04-13 | 13F | IFP Advisors, Inc | 117 | -12,69 | 2 | 0,00 | ||||
| 2026-02-05 | 13F | DnB Asset Management AS | 44.043 | -72,31 | 721 | -75,90 | ||||
| 2026-02-17 | 13F | Optiver Holding B.V. | 1.440.068 | 230,23 | 23.574 | 187,72 | ||||
| 2026-04-24 | 13F | Ninety One UK Ltd | 8.055.677 | 30,21 | 153.380 | 51,45 | ||||
| 2026-02-17 | 13F | Optiver Holding B.V. | Put | 433.100 | 7,92 | 7.090 | -5,98 | |||
| 2026-04-15 | 13F | Norden Group Llc | 10.983 | 209 | ||||||
| 2026-02-06 | 13F | Lsv Asset Management | 25.400 | 0,00 | 0 | |||||
| 2026-04-23 | 13F | SJS Investment Consulting Inc. | 5 | 0 | ||||||
| 2026-03-12 | 13F/A | Peak6 Llc | Put | 108.000 | -5,84 | 1.768 | -18,00 | |||
| 2026-02-11 | 13F | Cerity Partners LLC | 0 | -100,00 | 0 | |||||
| 2026-04-08 | 13F | Wealth Enhancement Advisory Services, Llc | 19.611 | 5,02 | 365 | 14,47 | ||||
| 2026-03-12 | 13F/A | Peak6 Llc | 96.030 | 528,96 | 1.572 | 449,65 | ||||
| 2026-02-09 | 13F | Keating Financial Advisory Services, Inc. | 2 | 0 | ||||||
| 2026-02-12 | 13F | Johnson Financial Group, Inc. | 91 | 0,00 | 1 | 0,00 | ||||
| 2026-04-13 | 13F | CGC Financial Services, LLC | 0 | -100,00 | 0 | |||||
| 2026-04-21 | 13F | Robeco Institutional Asset Management B.V. | 1.656.177 | 363,12 | 31.534 | 438,66 | ||||
| 2026-02-12 | 13F | Triumph Capital Management | 800 | 60,00 | 13 | 44,44 | ||||
| 2026-02-03 | 13F | Crossmark Global Holdings, Inc. | 361.263 | -52,97 | 5.914 | -59,03 | ||||
| 2025-11-14 | 13F | Orbis Allan Gray Ltd | 0 | -100,00 | 0 | -100,00 | ||||
| 2026-02-13 | 13F | Charles Schwab Investment Management Inc | 87.356 | 0,55 | 1.430 | -12,38 | ||||
| 2026-02-17 | 13F | Sig Brokerage, Lp | Call | 0 | -100,00 | 0 | ||||
| 2026-02-10 | 13F | State of Wyoming | 0 | -100,00 | 0 | |||||
| 2026-02-17 | 13F | Sig Brokerage, Lp | Put | 0 | -100,00 | 0 | ||||
| 2026-02-13 | 13F | Nutshell Asset Management Ltd | 200.000 | 3.274 | ||||||
| 2026-02-10 | 13F | Axq Capital, Lp | 34.574 | 22,35 | 566 | 6,60 | ||||
| 2025-11-14 | 13F | Wolverine Trading, Llc | Call | 30.000 | 9,49 | 571 | 5,75 | |||
| 2025-11-14 | 13F | Wolverine Trading, Llc | Put | 15.300 | -50,65 | 291 | -52,30 | |||
| 2026-01-22 | 13F | V-Square Quantitative Management LLC | 13.800 | 0,00 | 226 | -13,13 | ||||
| 2026-02-10 | 13F | Gulf International Bank (UK) Ltd | 17.346 | 0,00 | 0 | |||||
| 2026-02-13 | 13F | Parkside Financial Bank & Trust | 333 | 86,03 | 5 | 66,67 | ||||
| 2026-02-13 | 13F | Morgan Stanley | 9.524.277 | 13,24 | 155.912 | -1,34 | ||||
| 2026-02-13 | 13F | Ieq Capital, Llc | 27.119 | -41,43 | 444 | -49,02 | ||||
| 2026-04-24 | 13F | IFM Investors Pty Ltd | 35.523 | 33,03 | 676 | |||||
| 2025-11-12 | 13F | Itau Unibanco Holding S.A. | 0 | -100,00 | 0 | |||||
| 2026-02-12 | 13F | Cibc World Markets Corp | 0 | -100,00 | 0 | |||||
| 2025-11-14 | 13F | Skopos Labs, Inc. | 0 | -100,00 | 0 | |||||
| 2026-02-06 | 13F | Tortoise Investment Management, LLC | 0 | -100,00 | 0 | |||||
| 2026-02-02 | 13F | Hussman Strategic Advisors, Inc. | 84.000 | 1.375 | ||||||
| 2026-02-10 | 13F | Connor, Clark & Lunn Investment Management Ltd. | 141.112 | 882,06 | 2.310 | 758,74 | ||||
| 2026-04-23 | 13F | Lansforsakringar Fondforvaltning AB (publ) | 78.000 | 0,00 | 1.485 | 16,38 | ||||
| 2026-04-24 | 13F | Strs Ohio | 24.042 | -6,09 | 458 | 9,07 | ||||
| 2026-02-11 | 13F | Jpmorgan Chase & Co | 434.493 | -67,00 | 7.113 | -71,25 | ||||
| 2025-11-14 | 13F | Absoluto Partners Gestao de Recursos Ltda | 0 | -100,00 | 0 | |||||
| 2026-02-17 | 13F | SageView Advisory Group, LLC | 95 | 2 | ||||||
| 2026-04-15 | 13F | Exchange Traded Concepts, Llc | 196.959 | 8,49 | 3.750 | 26,22 | ||||
| 2026-01-30 | 13F | Jennison Associates Llc | 1.738.889 | -36,88 | 28.466 | -45,01 | ||||
| 2026-02-10 | 13F | National Pension Service | 107.022 | 9,68 | 1.752 | -4,47 | ||||
| 2026-01-23 | 13F | Westside Investment Management, Inc. | 545 | 0,00 | 9 | -11,11 | ||||
| 2026-02-17 | 13F | Quantinno Capital Management LP | 144.423 | 19,94 | 2.364 | 4,51 |