Grundlæggende statistik
| Institutionelle ejere | 140 total, 136 long only, 1 short only, 3 long/short - change of 3,70% MRQ |
| Del pris | 42,40 |
| Gennemsnitlig porteføljeallokering | 0.4180 % - change of 37,38% MRQ |
| Institutionelle aktier (lange) | 28.865.345 (ex 13D/G) - change of -3,61MM shares -11,11% MRQ |
| Institutionel værdi (lang) | $ 1.552.846 USD ($1000) |
Institutionelt ejerskab og aktionærer
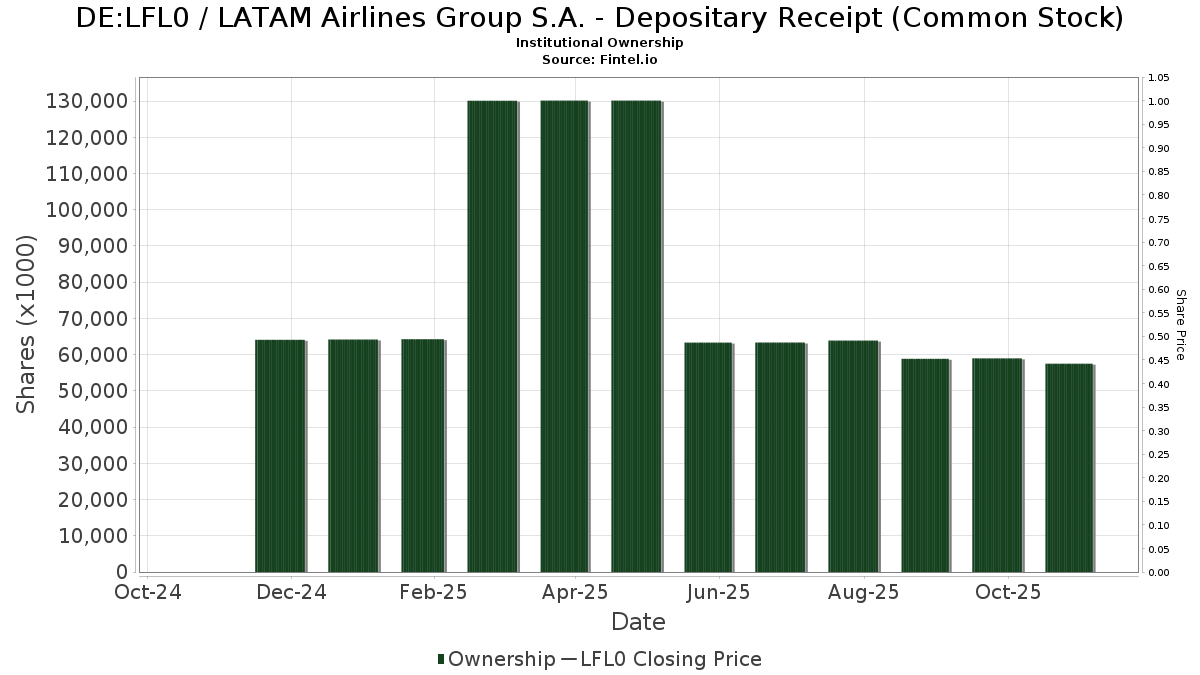
LATAM Airlines Group S.A. - Depositary Receipt (Common Stock) (DE:LFL0) har 140 institutionelle ejere og aktionærer, der har indsendt 13D/G- eller 13F-formularer til Securities Exchange Commission (SEC). Disse institutioner har i alt 28,865,345 aktier. Største aktionærer omfatter Olympus Peak Asset Management LP, Newport Trust Co, Morgan Stanley, Itau Unibanco Holding S.A., Two Sigma Investments, Lp, Robeco Institutional Asset Management B.V., Arrowstreet Capital, Limited Partnership, Alliancebernstein L.p., INCA Investments LLC, and Vanguard Group Inc .
LATAM Airlines Group S.A. - Depositary Receipt (Common Stock) (DB:LFL0) institutionel ejerskabsstruktur viser aktuelle positioner i virksomheden efter institutioner og fonde, samt seneste ændringer i positionsstørrelse. Større aktionærer kan omfatte individuelle investorer, investeringsforeninger, hedgefonde eller institutioner. Skema 13D angiver, at investoren besidder (eller besidder) mere end 5 % af virksomheden og har til hensigt (eller har til hensigt at) aktivt at forfølge en ændring i forretningsstrategi. Skema 13G indikerer en passiv investering på over 5%.
The share price as of March 11, 2026 is 42,40 / share. Previously, on March 13, 2025, the share price was 28,80 / share. This represents an increase of 47,22% over that period.
Fondens stemningsscore
Fund Sentiment Score (fka Ownership Accumulation Score) finder de aktier, der bliver mest købt af fonde. Det er resultatet af en sofistikeret, multi-faktor kvantitativ model, der identificerer virksomheder med de højeste niveauer af institutionel akkumulering. Scoringsmodellen bruger en kombination af den samlede stigning i oplyste ejere, ændringerne i porteføljeallokeringer i disse ejere og andre målinger. Tallet går fra 0 til 100, hvor højere tal indikerer et højere niveau af akkumulering for sine jævnaldrende, og 50 er gennemsnittet.
Opdateringsfrekvens: Dagligt
Se Ownership Explorer, som giver en liste over højest rangerende virksomheder.
AI+ Ask Fintel’s AI assistant about LATAM Airlines Group S.A. - Depositary Receipt (Common Stock).
Select a question to share a public post with an AI-crafted answer.
Thinking of good questions…
13F og NPORT arkivering
Detaljer om 13F-arkivering er gratis. Detaljer om NP-ansøgninger kræver et premium-medlemskab. Grønne rækker angiver nye positioner. Røde rækker angiver lukkede positioner. Klik på linket ikon for at se den fulde transaktionshistorik.
Opgrader
for at låse premium-data op og eksportere til Excel ![]() .
.
| Fil dato | Kilde | Investor | Type | Gennemsnitlig pris (Øst) |
Aktier | Δ Aktier (%) |
Rapporteret Værdi ($1000) |
Δ Værdi (%) |
Port Alloc (%) |
|
|---|---|---|---|---|---|---|---|---|---|---|
| 2026-02-11 | 13F | O'shaughnessy Asset Management, Llc | 13.036 | 704 | ||||||
| 2026-02-13 | 13F | Smartleaf Asset Management LLC | 40 | 300,00 | 2 | |||||
| 2025-10-23 | 13F | SG Americas Securities, LLC | 0 | -100,00 | 0 | |||||
| 2025-09-25 | NP | Dfa Investment Trust Co - The Emerging Markets Series This fund is a listed as child fund of Dimensional Fund Advisors Lp and if that institution has disclosed ownership in this security, then these positions will not be double counted when calculating total shares and total value | 19.271 | 0,00 | 836 | 37,95 | ||||
| 2025-09-25 | NP | DFA INVESTMENT DIMENSIONS GROUP INC - World ex U.S. Core Equity Portfolio Institutional Class Shares | 1.022 | 0,00 | 44 | 37,50 | ||||
| 2026-02-13 | 13F | Wells Fargo & Company/mn | 2.578 | -14,69 | 139 | 2,21 | ||||
| 2026-02-17 | 13F | XTX Topco Ltd | 0 | -100,00 | 0 | |||||
| 2025-09-25 | NP | DEHP - Dimensional Emerging Markets High Profitability ETF | 8.664 | -3,86 | 376 | 32,51 | ||||
| 2026-02-13 | 13F | Marshall Wace, Llp | 315.586 | 17.045 | ||||||
| 2025-09-25 | NP | DFA INVESTMENT DIMENSIONS GROUP INC - Emerging Markets Social Core Equity Portfolio Shares | 505 | 0,00 | 22 | 40,00 | ||||
| 2026-02-12 | 13F | Provida Pension Fund Administrator | 0 | -100,00 | 0 | |||||
| 2026-02-04 | 13F | INCA Investments LLC | 807.079 | 43.590 | ||||||
| 2026-02-17 | 13F | Olympus Peak Asset Management LP | 5.504.887 | -15,21 | 297.264 | 1,19 | ||||
| 2026-02-17 | 13F | Jump Financial, LLC | 211.200 | 11.407 | ||||||
| 2026-02-13 | 13F | Barclays Plc | 17.196 | 207,62 | 929 | 268,25 | ||||
| 2026-02-17 | 13F | Public Employees Retirement System Of Ohio | 55.572 | -49,33 | 3.001 | -39,53 | ||||
| 2026-01-29 | 13F | Vanguard Group Inc | 794.350 | -23,58 | 42.903 | -8,78 | ||||
| 2026-02-17 | 13F | Tudor Investment Corp Et Al | 0 | -100,00 | 0 | -100,00 | ||||
| 2026-02-10 | 13F | Seven Grand Managers, Llc | 100.000 | 0,00 | 5.401 | 19,36 | ||||
| 2026-01-16 | 13F | Ronald Blue Trust, Inc. | 6.226 | 3,65 | 336 | 23,99 | ||||
| 2026-01-28 | 13F | CAPROCK Group, Inc. | 4.179 | 232 | ||||||
| 2025-09-25 | NP | DFAE - Dimensional Emerging Core Equity Market ETF | 28.663 | 7,55 | 1.244 | 48,33 | ||||
| 2026-02-17 | 13F | Liontrust Investment Partners LLP | 4.026 | 0,00 | 217 | 19,23 | ||||
| 2026-02-02 | 13F | Advisors Preferred, LLC | 3.989 | 218 | ||||||
| 2026-02-12 | 13F | New York State Common Retirement Fund | 39.631 | 2.140 | ||||||
| 2026-02-17 | 13F | Aqr Capital Management Llc | 145.029 | 176,37 | 7.833 | 229,95 | ||||
| 2026-02-13 | 13F | Centiva Capital, LP | 0 | -100,00 | 0 | |||||
| 2026-02-18 | 13F | Vident Advisory, LLC | 21.391 | 40,40 | 1.155 | 67,63 | ||||
| 2026-02-24 | 13F | Bell Investment Advisors, Inc | 16 | -40,74 | 1 | -100,00 | ||||
| 2026-01-05 | 13F | GAMMA Investing LLC | 839 | 1,21 | 45 | 21,62 | ||||
| 2026-02-11 | 13F | Jpmorgan Chase & Co | 304.809 | -43,07 | 16.463 | -32,05 | ||||
| 2026-02-17 | 13F | Citadel Advisors Llc | Call | 93.300 | 0,97 | 5.039 | 20,52 | |||
| 2025-09-23 | NP | SLANX - DWS Latin America Equity Fund Class A | 91.864 | 3.986 | ||||||
| 2026-02-17 | 13F | Citadel Advisors Llc | 162.081 | 72,75 | 8.754 | 106,20 | ||||
| 2026-02-17 | 13F | Citadel Advisors Llc | Put | 4.900 | 265 | |||||
| 2026-02-12 | 13F | BlackRock, Inc. | 258.238 | -47,34 | 13.947 | -37,15 | ||||
| 2026-02-12 | 13F | Renaissance Technologies Llc | 444.800 | -8,67 | 24.024 | 9,02 | ||||
| 2025-11-14 | 13F | Virtu Financial LLC | 0 | -100,00 | 0 | |||||
| 2026-02-17 | 13F | Voleon Capital Management Lp | 9.234 | 499 | ||||||
| 2026-02-17 | 13F | Voloridge Investment Management, Llc | 143.716 | -28,54 | 7.762 | -14,70 | ||||
| 2026-02-17 | 13F | Bank Of America Corp /de/ | 46.692 | -73,61 | 2.522 | -68,52 | ||||
| 2026-02-17 | 13F | Two Sigma Advisers, Lp | 436.400 | 0,69 | 23.570 | 20,18 | ||||
| 2026-02-19 | 13F | Invesco Ltd. | 12.058 | 26,59 | 651 | 51,04 | ||||
| 2026-02-17 | 13F | Element Capital Management Llc | 0 | -100,00 | 0 | -100,00 | ||||
| 2026-02-17 | 13F | Royal Bank Of Canada | 2.672 | 340,20 | 144 | 433,33 | ||||
| 2026-02-17 | 13F | Susquehanna International Group, Llp | 63.748 | 53,93 | 3.443 | 83,82 | ||||
| 2026-01-27 | 13F | WealthCollab, LLC | 1 | 0 | ||||||
| 2026-02-10 | 13F | BW Gestao de Investimentos Ltda. | 0 | -100,00 | 0 | |||||
| 2026-02-17 | 13F | Susquehanna International Group, Llp | Put | 6.400 | -84,12 | 346 | -81,08 | |||
| 2026-02-17 | 13F | Susquehanna International Group, Llp | Call | 5.700 | -71,21 | 308 | -65,70 | |||
| 2026-02-13 | 13F | JustInvest LLC | 4.482 | 242 | ||||||
| 2026-02-13 | 13F | Atlas Capital Advisors Llc | 5.848 | 65,06 | 316 | 120,28 | ||||
| 2026-02-17 | 13F | Quantinno Capital Management LP | 48.069 | 7,50 | 2.596 | 28,32 | ||||
| 2025-11-14 | 13F | Cubist Systematic Strategies, LLC | 127.288 | -22,15 | 5.760 | -13,33 | ||||
| 2026-02-13 | 13F | First Trust Advisors Lp | 90.585 | 22,42 | 4.892 | 46,12 | ||||
| 2026-02-13 | 13F | Citigroup Inc | 22.267 | -20,44 | 1.203 | -5,06 | ||||
| 2026-02-06 | 13F | Pnc Financial Services Group, Inc. | 3.122 | 6,77 | 169 | 27,27 | ||||
| 2026-02-17 | 13F | Advisor Group Holdings, Inc. | 67 | 21,82 | 4 | 50,00 | ||||
| 2026-02-17 | 13F | Millennium Management Llc | 417.599 | 71,26 | 22.555 | 104,42 | ||||
| 2026-01-30 | 13F | R Squared Ltd | 0 | -100,00 | 0 | |||||
| 2026-02-17 | 13F | Balyasny Asset Management Llc | 8.849 | -96,82 | 478 | -96,21 | ||||
| 2026-01-29 | 13F | Pictet Asset Management Holding SA | 107.800 | 5.822 | ||||||
| 2026-02-12 | 13F | Jane Street Group, Llc | Call | 9.400 | 84,31 | 508 | 120,43 | |||
| 2026-02-06 | 13F | Larson Financial Group LLC | 27 | 800,00 | 1 | |||||
| 2026-02-12 | 13F | Jane Street Group, Llc | 42.154 | -96,32 | 2.277 | -95,61 | ||||
| 2026-02-13 | 13F | FORA Capital, LLC | 0 | -100,00 | 0 | |||||
| 2025-09-25 | NP | DEXC - Dimensional Emerging Markets ex China Core Equity ETF | 1.676 | 14,72 | 73 | 60,00 | ||||
| 2026-02-17 | 13F | Point72 Asset Management, L.P. | 283.746 | 46,87 | 15.325 | 75,30 | ||||
| 2026-02-17 | 13F | Lazard Asset Management Llc | 31.860 | 112,81 | 1.721 | 154,06 | ||||
| 2026-02-13 | 13F | Itau Unibanco Holding S.A. | 1.545.674 | 83.266 | ||||||
| 2026-02-12 | 13F | Raiffeisen Bank International AG | 0 | -100,00 | 0 | |||||
| 2026-02-06 | 13F | Global Retirement Partners, LLC | 6.187 | 1.175,67 | 334 | 1.490,48 | ||||
| 2026-02-10 | 13F | Nomura Asset Management Co Ltd | 20.958 | 54,58 | 1.132 | 84,50 | ||||
| 2026-02-17 | 13F | Mirabella Financial Services Llp | 22.500 | 1.215 | ||||||
| 2026-01-23 | 13F | Assetmark, Inc | 166 | 55,14 | 9 | 100,00 | ||||
| 2026-02-13 | 13F | Bridgewater Associates, LP | 18.446 | 73,48 | 996 | 107,07 | ||||
| 2026-02-12 | 13F | Banco BTG Pactual S.A. | 155.200 | 417,33 | 8.382 | 517,69 | ||||
| 2026-02-17 | 13F | Blackstone Group Inc | 0 | -100,00 | 0 | |||||
| 2026-02-11 | 13F | CenterBook Partners LP | 10.142 | 548 | ||||||
| 2026-02-13 | 13F | Bridgefront Capital, LLC | 5.059 | 273 | ||||||
| 2026-01-30 | 13F | Wealth High Governance Capital Ltda | 0 | -100,00 | 0 | -100,00 | ||||
| 2026-02-13 | 13F | Walleye Capital LLC | Put | 20.000 | 1.080 | |||||
| 2026-02-17 | 13F | Capital Fund Management S.a. | 14.455 | -33,33 | 781 | -28,24 | ||||
| 2026-02-11 | 13F | BI Asset Management Fondsmaeglerselskab A/S | 38.922 | 2 | ||||||
| 2026-02-17 | 13F | Heights Capital Management, Inc | 0 | -100,00 | 0 | |||||
| 2026-02-13 | 13F | Toroso Investments, LLC | 5.493 | 297 | ||||||
| 2026-02-11 | 13F | Simplex Trading, Llc | 779 | 42 | ||||||
| 2026-02-17 | 13F | Advisory Services Network, LLC | 0 | -100,00 | 0 | |||||
| 2026-02-17 | 13F | Two Sigma Investments, Lp | 1.146.605 | 20,16 | 61.928 | 43,42 | ||||
| 2026-02-13 | 13F | Rhumbline Advisers | 6.099 | 38,80 | 329 | 66,16 | ||||
| 2026-02-17 | 13F | Engineers Gate Manager LP | 37.175 | -31,60 | 2.008 | -18,38 | ||||
| 2026-02-11 | 13F | IMA Wealth, Inc. | 27 | 1 | ||||||
| 2026-02-13 | 13F | Verition Fund Management LLC | 58.763 | -87,11 | 3.174 | -84,62 | ||||
| 2026-01-27 | 13F | Zurcher Kantonalbank (Zurich Cantonalbank) | 38.295 | 49,48 | 2.068 | 78,43 | ||||
| 2026-02-06 | 13F | EverSource Wealth Advisors, LLC | 26 | 4,00 | 1 | 0,00 | ||||
| 2026-02-13 | 13F | Y-Intercept (Hong Kong) Ltd | 183.727 | 9.923 | ||||||
| 2026-02-13 | 13F | Arrowstreet Capital, Limited Partnership | 1.016.289 | -31,55 | 54.890 | -18,30 | ||||
| 2026-02-05 | 13F | May Hill Capital, LLC | 7.992 | 22,86 | 432 | 46,60 | ||||
| 2026-02-10 | 13F | Root Financial Partners, LLC | 21 | 1 | ||||||
| 2026-01-27 | 13F | Fundamenta Capital S.A. | 277.491 | 14.987 | ||||||
| 2026-02-17 | 13F | Man Group plc | 149.720 | 27,10 | 8.086 | 51,71 | ||||
| 2025-11-14 | 13F | Strategic Value Partners, LLC | 0 | -100,00 | 0 | -100,00 | ||||
| 2025-09-26 | NP | UBPIX - Ultralatin America Profund Investor Class | 2.087 | 12,20 | 91 | 55,17 | ||||
| 2026-02-03 | 13F | Crossmark Global Holdings, Inc. | 3.768 | -29,50 | 204 | -15,77 | ||||
| 2026-01-22 | 13F | Financial Consulate, Inc | 15 | 1 | ||||||
| 2025-09-25 | NP | DFAX - Dimensional World ex U.S. Core Equity 2 ETF | 4.551 | 35,00 | 197 | 85,85 | ||||
| 2026-01-08 | 13F | True Wealth Design, LLC | 9 | -10,00 | 0 | |||||
| 2026-02-17 | 13F | Alliancebernstein L.p. | 853.783 | 11,63 | 46.113 | 33,24 | ||||
| 2026-02-13 | 13F | Caitong International Asset Management Co., Ltd | 476 | -84,28 | 26 | -81,75 | ||||
| 2026-02-12 | 13F | Qtron Investments LLC | 9.439 | 510 | ||||||
| 2026-02-13 | 13F | Walleye Capital LLC | 6 | -100,00 | 0 | -100,00 | ||||
| 2026-02-17 | 13F | Bardin Hill Investment Partners LP | 65.709 | 3.549 | ||||||
| 2026-02-13 | 13F | Acumen Wealth Advisors, LLC | 104 | 6 | ||||||
| 2026-02-17 | 13F | Scientech Research LLC | 0 | -100,00 | 0 | |||||
| 2026-02-13 | 13F | SPX Equities Gestao de Recursos Ltda | 328.463 | -64,88 | 17.740 | -58,08 | ||||
| 2026-01-12 | 13F | Optivise Advisory Services LLC | 4.143 | -6,37 | 224 | 11,50 | ||||
| 2026-02-11 | 13F | Cerity Partners LLC | 6.264 | 338 | ||||||
| 2025-11-14 | 13F | Flow Traders U.s. Llc | 0 | -100,00 | 0 | |||||
| 2025-09-25 | NP | DAADX - Emerging Markets ex China Core Equity Portfolio Institutional Class | 2.442 | 0,00 | 106 | 38,16 | ||||
| 2026-02-05 | 13F | Atria Investments Llc | 4.311 | 233 | ||||||
| 2025-11-13 | 13F | Scoggin Management Lp | 0 | -100,00 | 0 | -100,00 | ||||
| 2026-01-30 | 13F | Kiker Wealth Management, LLC | 0 | -100,00 | 0 | |||||
| 2026-01-26 | 13F | Cwm, Llc | 3.493 | 0,00 | 0 | |||||
| 2026-02-09 | 13F | Accent Capital Management, LLC | 200 | 11 | ||||||
| 2026-02-12 | 13F | Dimensional Fund Advisors Lp | 228.517 | 34,70 | 12.343 | 60,86 | ||||
| 2026-02-10 | 13F | Bnp Paribas Arbitrage, Sa | 501.373 | -20,81 | 27.079 | -5,48 | ||||
| 2026-02-17 | 13F | Qube Research & Technologies Ltd | 191.211 | -39,51 | 10.327 | -27,79 | ||||
| 2026-01-29 | 13F | UBS Group AG | 610.678 | 8,07 | 32.983 | 28,99 | ||||
| 2026-01-23 | 13F | Farther Finance Advisors, LLC | 747 | 49,10 | 40 | 81,82 | ||||
| 2026-02-10 | 13F | Quantbot Technologies LP | 46.864 | 2.531 | ||||||
| 2026-02-12 | 13F | North of South Capital LLP | 16.743 | 904 | ||||||
| 2026-02-17 | 13F | Wellington Management Group Llp | 15.622 | 844 | ||||||
| 2026-02-10 | 13F | Goldman Sachs Group Inc | 251.486 | -46,44 | 13.583 | -36,08 | ||||
| 2026-01-28 | 13F | U S Global Investors Inc | 151.613 | 89,08 | 8.189 | 125,69 | ||||
| 2025-11-14 | 13F | Farallon Capital Management Llc | 0 | -100,00 | 0 | -100,00 | ||||
| 2025-11-14 | 13F | Hrt Financial Lp | 0 | -100,00 | 0 | |||||
| 2026-02-13 | 13F | Squarepoint Ops LLC | 4.018 | -95,60 | 217 | -94,75 | ||||
| 2026-02-17 | 13F | Caisse De Depot Et Placement Du Quebec | 138.910 | 7.503 | ||||||
| 2026-02-13 | 13F | SRS Capital Advisors, Inc. | 161 | 9 | ||||||
| 2026-02-17 | 13F | Graham Capital Management, L.P. | 10.875 | -56,22 | 587 | -47,78 | ||||
| 2026-02-17 | 13F | Ghisallo Capital Management LLC | 0 | -100,00 | 0 | |||||
| 2025-11-14 | 13F | Jain Global LLC | 0 | -100,00 | 0 | |||||
| 2026-02-13 | 13F | State Street Corp | 6.810 | 0,00 | 377 | 22,40 | ||||
| 2026-02-13 | 13F | Morgan Stanley | 2.091.845 | 11,23 | 112.981 | 32,77 | ||||
| 2026-02-17 | 13F | Par Capital Management Inc | 165.000 | 0,00 | 8.912 | 19,35 | ||||
| 2025-11-12 | 13F | Bardin Hill Management Partners Lp | 65.709 | 0,00 | 2.973 | 11,35 | ||||
| 2026-02-17 | 13F | Tower Research Capital LLC (TRC) | 302 | -76,98 | 16 | -72,88 | ||||
| 2026-01-23 | 13F | Robeco Institutional Asset Management B.V. | 1.018.218 | 87,30 | 54.994 | 123,56 | ||||
| 2026-02-13 | 13F | Ubs Asset Management Americas Inc | 126 | 7 | ||||||
| 2025-11-14 | 13F | Varde Management, L.P. | 0 | -100,00 | 0 | |||||
| 2026-02-06 | 13F | Verde Servicos Internacionais S.A. | 0 | -100,00 | 0 | |||||
| 2026-02-13 | 13F | Maven Securities LTD | 0 | -100,00 | 0 | |||||
| 2025-11-12 | 13F | NewSquare Capital LLC | 0 | -100,00 | 0 | -100,00 | ||||
| 2026-02-13 | 13F | Mariner, LLC | 4.152 | -6,17 | 224 | 12,00 | ||||
| 2026-02-17 | 13F | Hbk Investments L P | Put | 625.000 | -25,00 | 33.756 | -10,48 | |||
| 2026-02-17 | 13F | PharVision Advisers, LLC | 8.589 | 464 | ||||||
| 2025-11-03 | 13F | Activest Wealth Management | 0 | 0 | ||||||
| 2026-01-26 | 13F | Mirae Asset Global Investments Co., Ltd. | 2.386 | 19,60 | 129 | 42,22 | ||||
| 2026-02-17 | 13F | Schonfeld Strategic Advisors LLC | 40.845 | 2.206 | ||||||
| 2026-02-17 | 13F | Burkehill Global Management, LP | 0 | -100,00 | 0 | |||||
| 2026-02-17 | 13F | BlueCrest Capital Management Ltd | 0 | -100,00 | 0 | -100,00 | ||||
| 2026-01-30 | 13F | ABS Direct Equity Fund LLC | 26.457 | 1.429 | ||||||
| 2025-11-14 | 13F | D. E. Shaw & Co., Inc. | 0 | -100,00 | 0 | -100,00 | ||||
| 2026-02-13 | 13F | Thomist Capital Management, LP | 0 | -100,00 | 0 | |||||
| 2026-02-17 | 13F | Fmr Llc | 5.990 | -2,57 | 324 | 16,19 | ||||
| 2025-09-25 | NP | DFCEX - Emerging Markets Core Equity Portfolio - Institutional Class This fund is a listed as child fund of Dimensional Fund Advisors Lp and if that institution has disclosed ownership in this security, then these positions will not be double counted when calculating total shares and total value | 965 | 0,00 | 42 | 36,67 | ||||
| 2026-01-21 | 13F | Stone House Investment Management, LLC | 7 | 0 | ||||||
| 2026-01-27 | 13F | Financial Management Professionals, Inc. | 0 | -100,00 | 0 | |||||
| 2026-02-02 | 13F | Qrg Capital Management, Inc. | 6.504 | 7,04 | 351 | 28,10 | ||||
| 2026-02-09 | 13F | William Blair Investment Management, Llc | 702.358 | 37.930 | ||||||
| 2026-02-12 | 13F | Principal Securities, Inc. | 0 | -100,00 | 0 | |||||
| 2026-02-12 | 13F | Monashee Investment Management LLC | 0 | -100,00 | 0 | |||||
| 2026-02-04 | 13F | Aubrey Capital Management Ltd | 342.653 | 1,78 | 18.507 | 21,49 | ||||
| 2026-02-06 | 13F | Gsa Capital Partners Llp | 0 | -100,00 | 0 | -100,00 | ||||
| 2025-11-12 | 13F | LPL Financial LLC | 0 | -100,00 | 0 | -100,00 | ||||
| 2026-02-17 | 13F | Aquatic Capital Management LLC | 54.109 | 126,99 | 2.922 | 171,06 | ||||
| 2026-02-11 | 13F | Fox Run Management, L.l.c. | 4.180 | -64,15 | 226 | -57,31 | ||||
| 2026-02-17 | 13F | Shellback Capital, LP | 0 | -100,00 | 0 | |||||
| 2026-02-17 | 13F | Zimmer Partners, LP | 0 | -100,00 | 0 | |||||
| 2025-09-25 | NP | DFEM - Dimensional Emerging Markets Core Equity 2 ETF | 42.922 | 115,56 | 1.862 | 197,44 | ||||
| 2026-02-06 | 13F | Newport Trust Co | 3.974.931 | 0,00 | 214.686 | 19,36 | ||||
| 2026-02-11 | 13F | Capital Wealth Planning, LLC | 56.924 | 3.107 | ||||||
| 2026-02-17 | 13F | Fund 1 Investments, LLC | 0 | -100,00 | 0 | |||||
| 2026-02-17 | 13F | Northern Trust Corp | 44.568 | 6,52 | 2.407 | 27,15 | ||||
| 2026-02-18 | 13F | Mackenzie Financial Corp | 388.176 | 21.009 | ||||||
| 2026-02-13 | 13F | Sei Investments Co | 0 | -100,00 | 0 | |||||
| 2026-02-06 | 13F | Leonteq Securities AG | 1.436 | 78 | ||||||
| 2026-02-13 | 13F | Columbus Hill Capital Management, L.P. | 329.927 | -29,33 | 17.819 | -15,65 | ||||
| 2026-02-17 | 13F | ExodusPoint Capital Management, LP | 0 | -100,00 | 0 | -100,00 |
Other Listings
| US:LTM | 47,05 $ |