Grundlæggende statistik
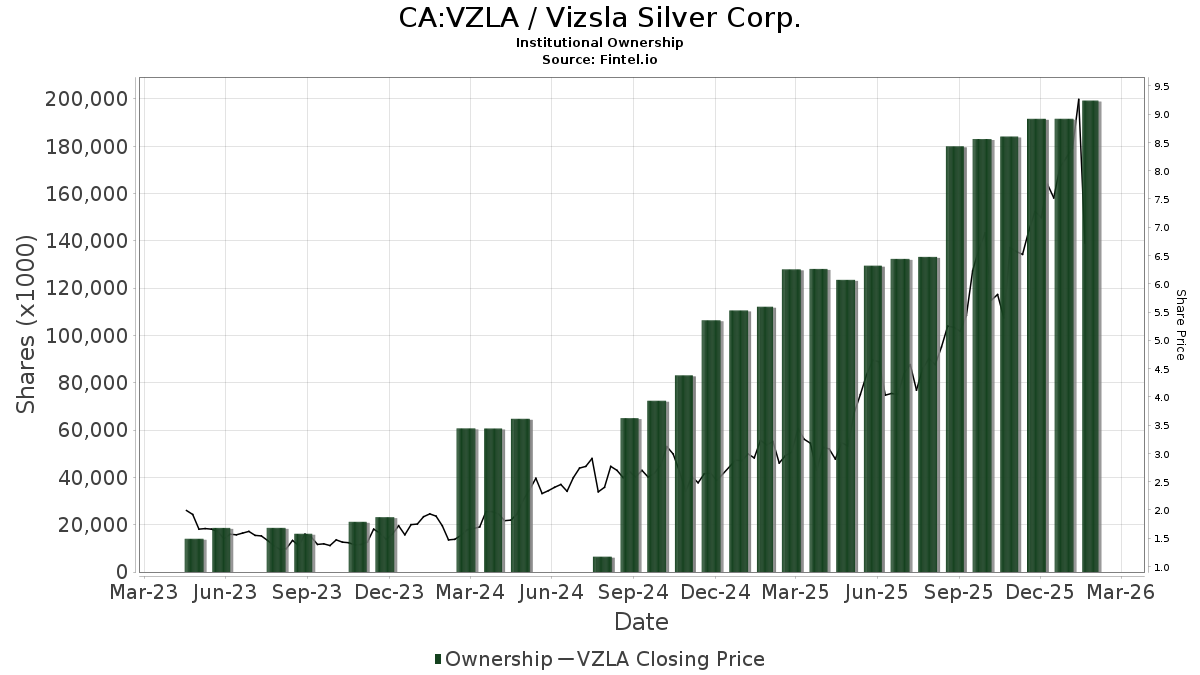
| Institutionelle aktier (lange) | 198.712.535 - 57,46% (ex 13D/G) - change of 6,65MM shares 3,46% MRQ |
| Institutionel værdi (lang) | $ 948.480 USD ($1000) |
Institutionelt ejerskab og aktionærer
Vizsla Silver Corp. (CA:VZLA) har 151 institutionelle ejere og aktionærer, der har indsendt 13D/G- eller 13F-formularer til Securities Exchange Commission (SEC). Disse institutioner har i alt 198,712,535 aktier. Største aktionærer omfatter Sprott Inc., Toroso Investments, LLC, Franklin Resources Inc, MIRAE ASSET GLOBAL ETFS HOLDINGS Ltd., Van Eck Associates Corp, UBS Group AG, Jupiter Asset Management Ltd, Amplify ETF Trust - Amplify Junior Silver Miners ETF, SIL - Global X Silver Miners ETF, and SPROTT FUNDS TRUST - Sprott Gold Equity Fund Institutional Class .
Vizsla Silver Corp. (TSX:VZLA) institutionel ejerskabsstruktur viser aktuelle positioner i virksomheden efter institutioner og fonde, samt seneste ændringer i positionsstørrelse. Større aktionærer kan omfatte individuelle investorer, investeringsforeninger, hedgefonde eller institutioner. Skema 13D angiver, at investoren besidder (eller besidder) mere end 5 % af virksomheden og har til hensigt (eller har til hensigt at) aktivt at forfølge en ændring i forretningsstrategi. Skema 13G indikerer en passiv investering på over 5%.
The share price as of February 26, 2026 is 5,74 / share. Previously, on February 28, 2025, the share price was 2,78 / share. This represents an increase of 106,47% over that period.
Fondens stemningsscore
Fund Sentiment Score (fka Ownership Accumulation Score) finder de aktier, der bliver mest købt af fonde. Det er resultatet af en sofistikeret, multi-faktor kvantitativ model, der identificerer virksomheder med de højeste niveauer af institutionel akkumulering. Scoringsmodellen bruger en kombination af den samlede stigning i oplyste ejere, ændringerne i porteføljeallokeringer i disse ejere og andre målinger. Tallet går fra 0 til 100, hvor højere tal indikerer et højere niveau af akkumulering for sine jævnaldrende, og 50 er gennemsnittet.
Opdateringsfrekvens: Dagligt
Se Ownership Explorer, som giver en liste over højest rangerende virksomheder.
AI+ Ask Fintel’s AI assistant about Vizsla Silver Corp..
Select a question to share a public post with an AI-crafted answer.
Thinking of good questions…
13F og NPORT arkivering
Detaljer om 13F-arkivering er gratis. Detaljer om NP-ansøgninger kræver et premium-medlemskab. Grønne rækker angiver nye positioner. Røde rækker angiver lukkede positioner. Klik på linket ikon for at se den fulde transaktionshistorik.
Opgrader
for at låse premium-data op og eksportere til Excel ![]() .
.
| Fil dato | Kilde | Investor | Type | Gennemsnitlig pris (Øst) |
Aktier | Δ Aktier (%) |
Rapporteret Værdi ($1000) |
Δ Værdi (%) |
Port Alloc (%) |
|
|---|---|---|---|---|---|---|---|---|---|---|
| 2026-02-13 | 13F | Van Eck Associates Corp | 12.864.195 | -5,32 | 70 | 20,69 | ||||
| 2026-01-30 | 13F | Bogart Wealth, LLC | 6.000 | 0,00 | 33 | 28,00 | ||||
| 2026-02-17 | 13F | Amundi | 3.750.000 | 15,38 | 20.512 | 37,20 | ||||
| 2026-01-29 | 13F | D.a. Davidson & Co. | 220.000 | 0,00 | 1.203 | 26,63 | ||||
| 2026-02-17 | 13F/A | Northwest & Ethical Investments L.P. | 39.750 | 218 | ||||||
| 2025-11-14 | 13F | Boothbay Fund Management, Llc | 0 | -100,00 | 0 | |||||
| 2026-02-17 | 13F | Bank Of America Corp /de/ | 7.426.573 | -1,83 | 40.623 | 24,30 | ||||
| 2026-02-04 | 13F | Oxbow Advisors, LLC | 86.120 | 0,00 | 471 | 26,61 | ||||
| 2026-02-05 | 13F | Allworth Financial LP | 170 | 1 | ||||||
| 2026-02-17 | 13F | Raffles Associates Lp | 1.654.010 | -2,07 | 9.047 | 24,00 | ||||
| 2026-02-17 | 13F | Scientech Research LLC | 31.282 | 171 | ||||||
| 2025-08-28 | NP | Amplify ETF Trust - Amplify Junior Silver Miners ETF | 8.354.397 | -13,59 | 24.562 | 32,52 | ||||
| 2026-02-17 | 13F | Janus Henderson Group Plc | 979.063 | -50,59 | 5.360 | -37,46 | ||||
| 2026-02-11 | 13F | OneAscent Financial Services LLC | 30.000 | 50,00 | 164 | 90,70 | ||||
| 2026-01-08 | 13F | Wealth Enhancement Advisory Services, Llc | 11.076 | 0,00 | 65 | 32,65 | ||||
| 2026-02-13 | 13F | OMERS ADMINISTRATION Corp | 0 | -100,00 | 0 | |||||
| 2025-11-14 | 13F | Walleye Capital LLC | 0 | -100,00 | 0 | |||||
| 2026-02-05 | 13F | LGT Fund Management Co Ltd. | 400.000 | 0,00 | 2.250 | 25,64 | ||||
| 2026-02-17 | 13F | DZ BANK AG Deutsche Zentral Genossenschafts Bank, Frankfurt am Main | 2.000.000 | 0,00 | 10.940 | 26,71 | ||||
| 2026-02-17 | 13F | Susquehanna International Group, Llp | Put | 872.200 | 4.771 | |||||
| 2026-02-06 | 13F | Banque Cantonale Vaudoise | 16.500 | 0,00 | 90 | |||||
| 2026-02-17 | 13F | Susquehanna International Group, Llp | Call | 1.157.300 | 6.330 | |||||
| 2026-02-17 | 13F | Cetera Investment Advisers | 14.554 | 80 | ||||||
| 2026-02-17 | 13F | Susquehanna International Group, Llp | 1.180.036 | 1.083,94 | 6.455 | 1.400,93 | ||||
| 2026-01-21 | 13F | Stone House Investment Management, LLC | 270 | 0,00 | 1 | 0,00 | ||||
| 2026-01-28 | 13F | Mountain Capital Investment Advisors, Inc | 13.270 | 88 | ||||||
| 2026-02-17 | 13F | Two Sigma Advisers, Lp | 228.300 | -14,43 | 1.249 | 8,33 | ||||
| 2026-02-10 | 13F | Goldman Sachs Group Inc | 1.057.917 | -15,11 | 5.787 | 7,49 | ||||
| 2026-02-12 | 13F | Nuveen, LLC | 263.339 | 12,12 | 1.445 | 42,41 | ||||
| 2025-11-07 | 13F | Shell Asset Management Co | 4.846 | 0 | ||||||
| 2026-02-17 | 13F | Keebeck Alpha, LP | 34.489 | 189 | ||||||
| 2026-02-17 | 13F | Edmond De Rothschild Holding S.a. | 149.202 | -62,37 | 819 | -52,13 | ||||
| 2026-01-23 | 13F | Farther Finance Advisors, LLC | 520 | 4,00 | 3 | 0,00 | ||||
| 2025-11-13 | 13F | Vestcor Inc | 0 | -100,00 | 0 | |||||
| 2026-02-13 | 13F | Caitong International Asset Management Co., Ltd | 10.321 | 10.764,21 | 56 | |||||
| 2026-02-03 | 13F | Privium Fund Management B.V. | 204.654 | 0,00 | 1.119 | 26,58 | ||||
| 2026-02-17 | 13F | Millennium Management Llc | 1.525.746 | 57,34 | 8.359 | 99,62 | ||||
| 2026-02-13 | 13F | Mml Investors Services, Llc | 0 | -100,00 | 0 | |||||
| 2026-01-29 | 13F | Vanguard Group Inc | 302.308 | 0,00 | 1.656 | 26,90 | ||||
| 2026-02-13 | 13F | Marshall Wace, Llp | 433.723 | 2.372 | ||||||
| 2026-02-17 | 13F | Cresset Asset Management, LLC | 11.125 | 61 | ||||||
| 2026-02-12 | 13F | Hrt Financial Lp | 153.146 | 417,72 | 1 | |||||
| 2025-11-12 | 13F | Forge First Asset Management Inc. | 0 | -100,00 | 0 | -100,00 | ||||
| 2026-01-28 | 13F | Barrett & Company, Inc. | 600 | 0,00 | 3 | 50,00 | ||||
| 2026-02-18 | 13F | Caitlin John, LLC | 1.400 | 40,00 | 8 | 75,00 | ||||
| 2026-02-18 | 13F | Mackenzie Financial Corp | 3.348.762 | -22,34 | 18.837 | 1,19 | ||||
| 2026-02-09 | 13F | Themes Management Co LLC | 45.900 | 251 | ||||||
| 2025-11-13 | 13F | Hudson Bay Capital Management LP | 0 | -100,00 | 0 | |||||
| 2026-01-22 | 13F | Financial Consulate, Inc | 1.000 | 5 | ||||||
| 2026-02-06 | 13F | Mizuho Markets Americas Llc | 1.845.862 | 10.097 | ||||||
| 2025-11-06 | 13F | Cardinal Point Capital Management, ULC | 0 | -100,00 | 0 | -100,00 | ||||
| 2026-02-12 | 13F | Jane Street Group, Llc | Call | 498.900 | 2.729 | |||||
| 2026-02-12 | 13F | Jane Street Group, Llc | 386.668 | 141,94 | 2.115 | 206,52 | ||||
| 2026-02-13 | 13F | Barclays Plc | 42.934 | 235 | ||||||
| 2026-02-12 | 13F | Jane Street Group, Llc | Put | 596.500 | 3.263 | |||||
| 2025-11-13 | 13F | VGI Partners Ltd | 0 | -100,00 | 0 | -100,00 | ||||
| 2026-02-17 | 13F | Investment Management Corp of Ontario | 42.400 | 232 | ||||||
| 2026-02-18 | 13F | Papamarkou Wellner Asset Management inc. | 60.887 | -0,43 | 334 | 26,52 | ||||
| 2026-02-12 | 13F | Hollencrest Capital Management | 30.000 | 164 | ||||||
| 2026-02-17 | 13F | Alliancebernstein L.p. | 47.200 | 258 | ||||||
| 2026-02-17 | 13F | Fmr Llc | 1.996.900 | -29,91 | 10.941 | -11,07 | ||||
| 2026-02-12 | 13F | Marex Group plc | 0 | -100,00 | 0 | -100,00 | ||||
| 2026-01-27 | 13F | TD Waterhouse Canada Inc. | 28.350 | 128,63 | 155 | 187,04 | ||||
| 2026-02-11 | 13F | Jpmorgan Chase & Co | 142 | -99,94 | 1 | -100,00 | ||||
| 2026-02-13 | 13F | Diametric Capital, LP | 0 | -100,00 | 0 | |||||
| 2026-02-10 | 13F | Td Asset Management Inc | 1.067.907 | 161,72 | 5.859 | 232,46 | ||||
| 2026-02-02 | 13F | Triasima Portfolio Management inc. | 520.768 | -1,10 | 2.857 | 25,59 | ||||
| 2026-01-30 | 13F | New Harbor Financial Group, LLC | 31.376 | -10,35 | 172 | 13,25 | ||||
| 2026-02-17 | 13F | Nokomis Capital, L.L.C. | 1.143.852 | 0,00 | 6.257 | 26,61 | ||||
| 2026-02-17 | 13F | Elequin Capital Lp | 691 | 4 | ||||||
| 2026-02-12 | 13F | EAM Global Investors LLC | 0 | -100,00 | 0 | |||||
| 2026-02-12 | 13F | Alps Advisors Inc | 5.733.091 | 69,09 | 31.360 | 114,11 | ||||
| 2026-02-13 | 13F | Evelyn Partners Investment Management Services Ltd | 2.157 | 12 | ||||||
| 2026-02-13 | 13F | SRS Capital Advisors, Inc. | 2.500 | 0,00 | 14 | 30,00 | ||||
| 2026-01-29 | 13F | IMC-Chicago, LLC | 44.038 | 241 | ||||||
| 2026-02-09 | 13F | Legal & General Group Plc | 275.252 | -8,19 | 1.510 | 16,60 | ||||
| 2026-02-17 | 13F | MIRAE ASSET GLOBAL ETFS HOLDINGS Ltd. | 13.002.158 | 14,10 | 71.330 | 44,92 | ||||
| 2026-01-29 | 13F | Pictet Asset Management Holding SA | 58.466 | 18,83 | 321 | 50,94 | ||||
| 2026-02-10 | 13F | Jupiter Asset Management Ltd | 10.013.434 | 34,08 | 54.934 | 70,30 | ||||
| 2026-02-04 | 13F | Ground Swell Capital, LLC | 15.540 | 85 | ||||||
| 2026-02-04 | 13F | Tsfg, Llc | 1.770 | 0,00 | 0 | |||||
| 2026-02-13 | 13F | Quarry LP | 0 | -100,00 | 0 | |||||
| 2026-02-13 | 13F | Toroso Investments, LLC | 13.701.975 | -5,08 | 74.950 | 20,19 | ||||
| 2026-02-17 | 13F | Schonfeld Strategic Advisors LLC | 0 | -100,00 | 0 | |||||
| 2026-02-17 | 13F | Raymond James Financial Inc | 235.460 | 8,09 | 1.288 | 36,77 | ||||
| 2026-02-09 | 13F | Geode Capital Management, Llc | 243.550 | 29,28 | 1.365 | 67,90 | ||||
| 2026-02-05 | 13F | Cambridge Investment Research Advisors, Inc. | 136.474 | -23,08 | 1 | |||||
| 2026-02-12 | 13F | Hohimer Wealth Management, Llc | 0 | -100,00 | 0 | |||||
| 2026-02-17 | 13F | Citadel Advisors Llc | Put | 122.000 | 667 | |||||
| 2026-02-13 | 13F | Morgan Stanley | 1.166.982 | 2,76 | 6.383 | 30,13 | ||||
| 2026-02-14 | 13F | Rockefeller Capital Management L.P. | 2.000 | 0,00 | 11 | 25,00 | ||||
| 2026-02-06 | 13F | Pnc Financial Services Group, Inc. | 100 | 1 | ||||||
| 2026-02-10 | 13F | Quantbot Technologies LP | 141.272 | 11,25 | 773 | 40,88 | ||||
| 2026-02-17 | 13F | Citadel Advisors Llc | Call | 123.300 | 674 | |||||
| 2026-02-17 | 13F | Citadel Advisors Llc | 1.149.958 | 1.611,78 | 6.290 | 2.068,97 | ||||
| 2026-02-13 | 13F | BRITISH COLUMBIA INVESTMENT MANAGEMENT Corp | 183.639 | 1.006 | ||||||
| 2026-02-13 | 13F | Manufacturers Life Insurance Company, The | 0 | -100,00 | 0 | |||||
| 2026-02-17 | 13F | Susquehanna Advisors Group, Inc. | 692.100 | 810,66 | 3.786 | 1.053,96 | ||||
| 2026-02-17 | 13F | Orion Resource Partners LP | 0 | -100,00 | 0 | |||||
| 2026-02-17 | 13F | Advisor Group Holdings, Inc. | 8.814 | 114,98 | 48 | 182,35 | ||||
| 2025-08-28 | NP | SPROTT FUNDS TRUST - Sprott Gold Equity Fund Institutional Class | 7.563.950 | -3,14 | 22.329 | 25,07 | ||||
| 2026-02-17 | 13F | Caption Management, LLC | Put | 1.102.200 | 6.029 | |||||
| 2026-02-17 | 13F | Caption Management, LLC | Call | 1.889.400 | 10.335 | |||||
| 2026-02-03 | 13F | SBI Securities Co., Ltd. | 1 | -66,67 | 0 | |||||
| 2026-02-17 | 13F | Harvest Investment Services, LLC | 35.450 | 194 | ||||||
| 2025-11-14 | 13F | Virtu Financial LLC | 0 | -100,00 | 0 | |||||
| 2026-02-17 | 13F | Balyasny Asset Management Llc | 448.733 | 2.458 | ||||||
| 2026-02-05 | 13F | Accredited Investors Inc. | 15.600 | 0,00 | 85 | 26,87 | ||||
| 2026-02-09 | 13F | Integrity Alliance, Llc. | 10.310 | 56 | ||||||
| 2026-02-17 | 13F | Tower Research Capital LLC (TRC) | 13.314 | 73 | ||||||
| 2026-02-17 | 13F | Engineers Gate Manager LP | 0 | -100,00 | 0 | |||||
| 2026-02-13 | 13F | Integrated Wealth Concepts LLC | 35.600 | -4,22 | 195 | 21,25 | ||||
| 2026-02-12 | 13F | Swiss National Bank | 686.300 | 8,30 | 3.768 | 37,63 | ||||
| 2026-01-20 | 13F | Steel Peak Wealth Management LLC | 21.514 | 118 | ||||||
| 2026-01-29 | 13F | UBS Group AG | Call | 12.847.950 | 70.278 | |||||
| 2026-01-29 | 13F | UBS Group AG | 6.118.877 | 366,57 | 33.470 | 490,82 | ||||
| 2026-02-06 | 13F | Auxano Advisors, LLC | 115.000 | 629 | ||||||
| 2026-01-27 | 13F | Zurcher Kantonalbank (Zurich Cantonalbank) | 102.200 | 96,54 | 561 | 150,00 | ||||
| 2025-11-14 | 13F | Verition Fund Management LLC | 0 | -100,00 | 0 | |||||
| 2026-02-11 | 13F | Fore Capital, LLC | 0 | -100,00 | 0 | |||||
| 2026-02-13 | 13F | National Bank Of Canada /fi/ | 204.879 | 1.122 | ||||||
| 2026-01-16 | 13F | Ronald Blue Trust, Inc. | 4.000 | 0,00 | 22 | 23,53 | ||||
| 2026-02-12 | 13F | Renaissance Technologies Llc | 0 | -100,00 | 0 | |||||
| 2025-10-23 | 13F | SG Americas Securities, LLC | 0 | -100,00 | 0 | |||||
| 2026-02-13 | 13F | Wells Fargo & Company/mn | 143.800 | 1.697,50 | 787 | 2.211,76 | ||||
| 2026-02-17 | 13F | PenderFund Capital Management Ltd. | 83.000 | 0,00 | 454 | 26,82 | ||||
| 2026-02-13 | 13F | Fourth Sail Capital LP | 6.166.612 | 42,35 | 33.731 | 80,25 | ||||
| 2026-02-10 | 13F | CIBC World Markets Inc. | 45.324 | 40,67 | 248 | 78,42 | ||||
| 2025-11-14 | 13F | Anson Funds Management LP | 0 | -100,00 | 0 | |||||
| 2026-02-17 | 13F | Voloridge Investment Management, Llc | 126.899 | 694 | ||||||
| 2026-02-04 | 13F | BCJ Capital Management, LLC | 1.443.076 | 66,01 | 7.894 | 110,20 | ||||
| 2026-02-13 | 13F | Dynamic Technology Lab Private Ltd | 0 | -100,00 | 0 | |||||
| 2026-02-11 | 13F | Deutsche Bank Ag\ | 22.007 | 485,29 | 120 | 650,00 | ||||
| 2026-02-13 | 13F | NewGen Asset Management Ltd | 900.000 | 4.923 | ||||||
| 2025-11-07 | 13F | Bastion Asset Management Inc. | 0 | -100,00 | 0 | -100,00 | ||||
| 2026-02-17 | 13F | XTX Topco Ltd | 61.648 | 337 | ||||||
| 2025-11-13 | 13F | Periscope Capital Inc. | 0 | -100,00 | 0 | |||||
| 2025-11-14 | 13F | Aigen Investment Management, Lp | 0 | -100,00 | 0 | |||||
| 2026-02-17 | 13F | D. E. Shaw & Co., Inc. | 0 | -100,00 | 0 | |||||
| 2026-02-13 | 13F | Citigroup Inc | 1.794.087 | 13.004,13 | 9.842 | 16.581,36 | ||||
| 2026-02-17 | 13F | Two Sigma Investments, Lp | 1.403.088 | -22,49 | 7.675 | -1,85 | ||||
| 2025-11-14 | 13F | Murchinson Ltd. | 0 | -100,00 | 0 | |||||
| 2026-02-09 | 13F | Waratah Capital Advisors Ltd. | 6.343.121 | -3,22 | 34.697 | 22,54 | ||||
| 2026-02-11 | 13F | Franklin Resources Inc | 13.311.000 | -4,76 | 72.910 | 20,82 | ||||
| 2025-11-14 | 13F | Gotham Asset Management, LLC | 0 | -100,00 | 0 | -100,00 | ||||
| 2026-02-10 | 13F | Bnp Paribas Arbitrage, Sa | 15.700 | -98,43 | 86 | -98,03 | ||||
| 2026-02-12 | 13F | BlackRock, Inc. | 393.054 | -12,48 | 2.150 | 10,82 | ||||
| 2026-01-28 | 13F | U S Global Investors Inc | 1.050.000 | 0,00 | 5.756 | 27,01 | ||||
| 2026-02-06 | 13F | HighTower Advisors, LLC | 20.219 | 7,94 | 111 | 37,50 | ||||
| 2026-02-13 | 13F | Public Sector Pension Investment Board | 20.100 | 110 | ||||||
| 2026-02-17 | 13F | Public Employees Retirement System Of Ohio | 92.817 | 35,09 | 509 | 71,96 | ||||
| 2026-01-15 | 13F | Allspring Global Investments Holdings, LLC | 1.000.000 | 5.470 | ||||||
| 2026-02-13 | 13F | Pale Fire Capital SE | 38.201 | 24,32 | 209 | 57,58 | ||||
| 2026-01-14 | 13F | ORG Partners LLC | 1.250 | 7 | ||||||
| 2026-02-13 | 13F | Pathstone Holdings, LLC | 0 | -100,00 | 0 | |||||
| 2025-11-17 | 13F | Connective Capital Management, LLC | 0 | -100,00 | 0 | -100,00 | ||||
| 2026-02-12 | 13F | StoneX Group Inc. | 10.910 | 60 | ||||||
| 2026-02-17 | 13F | Private Advisor Group, LLC | 10.000 | 0,00 | 55 | 25,58 | ||||
| 2026-02-06 | 13F | Global Retirement Partners, LLC | 150 | 1 | ||||||
| 2025-11-21 | 13F | Nebula Research & Development LLC | 0 | -100,00 | 0 | |||||
| 2025-09-29 | NP | SIL - Global X Silver Miners ETF This fund is a listed as child fund of Mirae Asset Global Investments Co., Ltd. and if that institution has disclosed ownership in this security, then these positions will not be double counted when calculating total shares and total value | 7.679.723 | 35,40 | 22.830 | 91,72 | ||||
| 2026-02-13 | 13F | Wexford Capital Lp | 360.000 | 1.969 | ||||||
| 2026-02-02 | 13F | Intact Investment Management Inc. | 0 | -100,00 | 0 | -100,00 | ||||
| 2026-02-17 | 13F | Toronto Dominion Bank | 100.162 | -83,12 | 549 | -78,61 | ||||
| 2026-01-20 | 13F | Corundum Trust Company, INC | 70.250 | 16,60 | 384 | 47,69 | ||||
| 2026-02-11 | 13F | LPL Financial LLC | 84.868 | 86,05 | 464 | 135,53 | ||||
| 2026-02-17 | 13F | Prelude Capital Management, Llc | 34.489 | 53,85 | 189 | 95,83 | ||||
| 2026-02-10 | 13F | PCJ Investment Counsel Ltd. | 551.440 | -2,70 | 3.021 | 23,51 | ||||
| 2025-09-26 | NP | EPGFX - EuroPac Gold Fund Class A | 0 | -100,00 | 0 | -100,00 | ||||
| 2026-02-17 | 13F | Ninepoint Partners LP | 3.410.000 | 143,24 | 18.653 | 207,99 | ||||
| 2026-01-20 | 13F | AdvisorNet Financial, Inc | 400 | 166,67 | 2 | |||||
| 2026-02-03 | 13F | K.J. Harrison & Partners Inc | 361.500 | -44,51 | 1.983 | -30,20 | ||||
| 2025-09-23 | NP | FKRCX - Franklin Gold & Precious Metals Fund Class A | 3.367.000 | 219,42 | 9.987 | 222,27 | ||||
| 2026-02-10 | 13F | CIBC Asset Management Inc | 318.586 | 1.747 | ||||||
| 2026-02-17 | 13F | Aquatic Capital Management LLC | 2.506 | -90,81 | 14 | -88,89 | ||||
| 2026-02-02 | 13F | Wolverine Asset Management Llc | Put | 937.100 | 5.126 | |||||
| 2026-02-10 | 13F | Bank of New York Mellon Corp | 0 | -100,00 | 0 | |||||
| 2025-11-06 | 13F | Baader Bank INC | 0 | -100,00 | 0 | |||||
| 2026-02-04 | 13F | Swiss Life Asset Management Ltd | 14.681 | 20,50 | 80 | 53,85 | ||||
| 2026-02-17 | 13F | Jones Financial Companies Lllp | 32.277 | 2.985,76 | 177 | 4.300,00 | ||||
| 2026-02-18 | 13F | GWM Advisors LLC | 118.285 | 647 | ||||||
| 2026-02-06 | 13F/A | Rathbone Brothers plc | 18.300 | -26,80 | 100 | -7,41 | ||||
| 2026-02-12 | 13F | Sprott Inc. | 20.712.812 | -9,36 | 113.449 | 14,95 | ||||
| 2026-02-17 | 13F | Integrated Advisors Network LLC | 68.650 | 376 | ||||||
| 2026-02-12 | 13F | Federation des caisses Desjardins du Quebec | 114.820 | 45,16 | 629 | 84,16 | ||||
| 2026-02-13 | 13F | Extract Advisors LLC | 775.430 | 4.248 | ||||||
| 2026-02-17 | 13F | Royal Bank Of Canada | 2.811.838 | 14,31 | 15.380 | 44,74 | ||||
| 2026-02-17 | 13F | Parvin Asset Management, LLC | 2.350 | 13 | ||||||
| 2025-08-29 | NP | JOHN HANCOCK INVESTMENT TRUST - John Hancock Diversified Real Assets Fund Class NAV | 70.312 | -78,37 | 207 | -72,27 | ||||
| 2026-02-11 | 13F | Erste Asset Management GmbH | 66.000 | 364 | ||||||
| 2026-02-13 | 13F | Mariner, LLC | 52.556 | 3,72 | 287 | 31,65 | ||||
| 2026-02-17 | 13F | Quadrature Capital Ltd | 69.352 | 379 | ||||||
| 2025-11-06 | 13F | Verde Servicos Internacionais S.A. | 0 | -100,00 | 0 | |||||
| 2026-02-11 | 13F | Simplex Trading, Llc | 89.091 | 865,55 | 487 | |||||
| 2026-02-05 | 13F | DnB Asset Management AS | 30.000 | 0,00 | 164 | 27,13 | ||||
| 2026-02-12 | 13F | Bank Of Montreal /can/ | 3.020.511 | 24.064,09 | 16.549 | 31.124,53 | ||||
| 2026-02-17 | 13F | Ameriprise Financial Inc | 26.624 | 1,19 | 146 | 28,32 | ||||
| 2026-02-17 | 13F | Mason Hill Advisors Llc | 3.494.700 | -41,67 | 19.148 | -26,00 |
Other Listings
| US:VZLA | 4,38 $ |