Grundlæggende statistik
| Institutionelle aktier (lange) | 363.714.040 - 62,47% (ex 13D/G) - change of -95,77MM shares -20,84% MRQ |
| Institutionel værdi (lang) | $ 5.185.238 USD ($1000) |
Institutionelt ejerskab og aktionærer
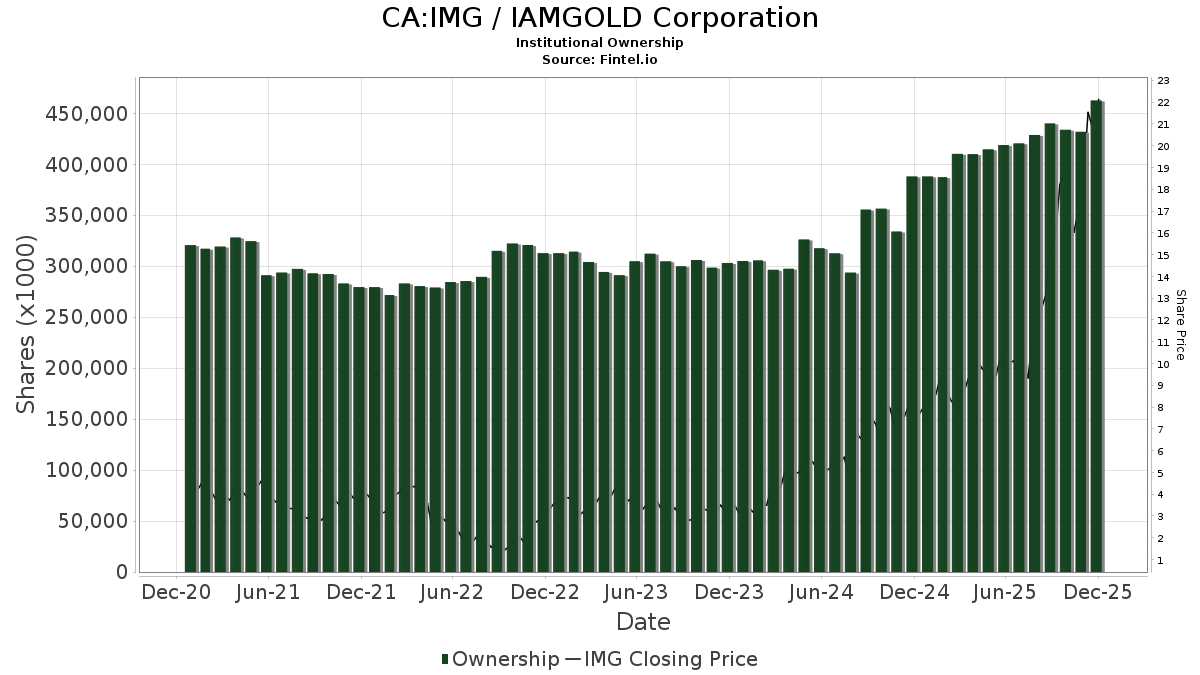
IAMGOLD Corporation (CA:IMG) har 272 institutionelle ejere og aktionærer, der har indsendt 13D/G- eller 13F-formularer til Securities Exchange Commission (SEC). Disse institutioner har i alt 363,714,040 aktier. Største aktionærer omfatter Van Eck Associates Corp, FIL Ltd, Fmr Llc, Vanguard Group Inc, Donald Smith & Co., Inc., BlackRock, Inc., Bank Of America Corp /de/, American Century Companies Inc, Dimensional Fund Advisors Lp, and Ci Investments Inc. .
IAMGOLD Corporation (TSX:IMG) institutionel ejerskabsstruktur viser aktuelle positioner i virksomheden efter institutioner og fonde, samt seneste ændringer i positionsstørrelse. Større aktionærer kan omfatte individuelle investorer, investeringsforeninger, hedgefonde eller institutioner. Skema 13D angiver, at investoren besidder (eller besidder) mere end 5 % af virksomheden og har til hensigt (eller har til hensigt at) aktivt at forfølge en ændring i forretningsstrategi. Skema 13G indikerer en passiv investering på over 5%.
The share price as of April 24, 2026 is 23,52 / share. Previously, on April 28, 2025, the share price was 199,20 / share. This represents a decline of 88,19% over that period.
Fondens stemningsscore
Fund Sentiment Score (fka Ownership Accumulation Score) finder de aktier, der bliver mest købt af fonde. Det er resultatet af en sofistikeret, multi-faktor kvantitativ model, der identificerer virksomheder med de højeste niveauer af institutionel akkumulering. Scoringsmodellen bruger en kombination af den samlede stigning i oplyste ejere, ændringerne i porteføljeallokeringer i disse ejere og andre målinger. Tallet går fra 0 til 100, hvor højere tal indikerer et højere niveau af akkumulering for sine jævnaldrende, og 50 er gennemsnittet.
Opdateringsfrekvens: Dagligt
Se Ownership Explorer, som giver en liste over højest rangerende virksomheder.
AI+ Ask Fintel’s AI assistant about IAMGOLD Corporation.
Select a question to share a public post with an AI-crafted answer.
Thinking of good questions…
13F og NPORT arkivering
Detaljer om 13F-arkivering er gratis. Detaljer om NP-ansøgninger kræver et premium-medlemskab. Grønne rækker angiver nye positioner. Røde rækker angiver lukkede positioner. Klik på linket ikon for at se den fulde transaktionshistorik.
Opgrader
for at låse premium-data op og eksportere til Excel ![]() .
.
| Fil dato | Kilde | Investor | Type | Gennemsnitlig pris (Øst) |
Aktier | Δ Aktier (%) |
Rapporteret Værdi ($1000) |
Δ Værdi (%) |
Port Alloc (%) |
|
|---|---|---|---|---|---|---|---|---|---|---|
| 2026-04-24 | 13F | Triasima Portfolio Management inc. | 190.733 | -69,28 | 3.575 | -65,16 | ||||
| 2026-02-17 | 13F | Prelude Capital Management, Llc | 11.911 | -60,82 | 196 | -50,13 | ||||
| 2026-02-13 | 13F | Great West Life Assurance Co /can/ | 77.462 | -53,39 | 1 | -50,00 | ||||
| 2026-02-13 | 13F | Quarry LP | 636 | -98,45 | 10 | -98,12 | ||||
| 2026-02-13 | 13F | American Century Companies Inc | 8.828.236 | -8,02 | 145.661 | 17,43 | ||||
| 2025-11-14 | 13F | Point72 (DIFC) Ltd | 0 | -100,00 | 0 | -100,00 | ||||
| 2026-02-17 | 13F | Hartree Partners, LP | 0 | -100,00 | 0 | |||||
| 2026-02-17 | 13F | Lazard Asset Management Llc | 26.484 | -61,48 | 437 | -50,79 | ||||
| 2026-02-17 | 13F | Engineers Gate Manager LP | 34.128 | 563 | ||||||
| 2026-02-12 | 13F | Penserra Capital Management LLC | 159.225 | 3 | ||||||
| 2026-02-10 | 13F | Scheer, Rowlett & Associates Investment Management Ltd. | 0 | -100,00 | 0 | |||||
| 2026-04-09 | 13F | Nelson, Van Denburg & Campbell Wealth Management Group, LLC | 29.000 | 0,00 | 546 | 14,02 | ||||
| 2026-02-10 | 13F | State of Wyoming | 13.278 | 219 | ||||||
| 2026-02-13 | 13F | Thomist Capital Management, LP | 493.625 | -53,00 | 8.268 | -38,64 | ||||
| 2026-02-11 | 13F | Winton Capital Group Ltd | 305.068 | -23,10 | 5.031 | -1,93 | ||||
| 2026-02-13 | 13F | First Trust Advisors Lp | 320.007 | 2.763,08 | 5.281 | 3.566,67 | ||||
| 2026-02-13 | 13F | Marshall Wace, Llp | 799.472 | 13.183 | ||||||
| 2026-02-13 | 13F | Mudita Advisors LLP | 0 | -100,00 | 0 | |||||
| 2026-02-17 | 13F | Toronto Dominion Bank | Call | 120.000 | -20,00 | 1.980 | 2,22 | |||
| 2026-02-09 | 13F | Todd Asset Management Llc | 0 | -100,00 | 0 | -100,00 | ||||
| 2026-02-17 | 13F | Toronto Dominion Bank | 225.960 | -5,06 | 3.729 | 21,28 | ||||
| 2026-01-14 | 13F | Appian Way Asset Management LP | 0 | -100,00 | 0 | -100,00 | ||||
| 2026-02-13 | 13F | Wexford Capital Lp | 0 | -100,00 | 0 | -100,00 | ||||
| 2026-03-06 | 13F | Hsbc Holdings Plc | 0 | -100,00 | 0 | |||||
| 2026-02-17 | 13F | Qube Research & Technologies Ltd | 74.012 | 1.220 | ||||||
| 2026-02-13 | 13F | Evelyn Partners Investment Management LLP | 0 | -100,00 | 0 | -100,00 | ||||
| 2025-11-14 | 13F | Mml Investors Services, Llc | 0 | -100,00 | 0 | |||||
| 2026-02-03 | 13F/A | Bank Of America Corp /de/ | Put | 0 | -100,00 | 0 | -100,00 | |||
| 2026-02-09 | 13F | Kingsview Wealth Management, LLC | 0 | -100,00 | 0 | -100,00 | ||||
| 2026-02-13 | 13F | Candriam Luxembourg S.C.A. | 1.540.000 | -25,24 | 25.396 | -4,66 | ||||
| 2026-04-15 | 13F | FNY Investment Advisers, LLC | 0 | -100,00 | 0 | |||||
| 2026-02-12 | 13F | Sprott Inc. | 6.902.659 | -5,62 | 113.833 | 20,38 | ||||
| 2026-02-13 | 13F | National Bank Of Canada /fi/ | 1.426.707 | -34,81 | 23.400 | -16,80 | ||||
| 2026-02-04 | 13F | Swiss Life Asset Management Ltd | 26.214 | 0,00 | 432 | 27,43 | ||||
| 2026-02-12 | 13F | Sprott Inc. | Call | 60.000 | 1.140 | |||||
| 2026-02-17 | 13F | Murchinson Ltd. | 0 | -100,00 | 0 | -100,00 | ||||
| 2026-02-17 | 13F | Asset One Wealth Management LLC | 107.423 | 1.954 | ||||||
| 2026-02-12 | 13F | Callan Family Office, LLC | 12.030 | 198 | ||||||
| 2025-11-14 | 13F | Axa S.a. | 0 | -100,00 | 0 | -100,00 | ||||
| 2026-02-17 | 13F | Millennium Management Llc | 3.300.768 | 1,16 | 54.432 | 29,01 | ||||
| 2026-04-20 | 13F | Banque Cantonale Vaudoise | 1.479 | -50,47 | 28 | -42,86 | ||||
| 2026-02-18 | 13F | GWM Advisors LLC | 75 | 0,00 | 1 | |||||
| 2025-11-12 | 13F | Picton Mahoney Asset Management | Call | 0 | -100,00 | 0 | -100,00 | |||
| 2026-02-06 | 13F | Leonteq Securities AG | 1.300 | 21 | ||||||
| 2026-02-13 | 13F | Morgan Stanley | 1.322.664 | 6,23 | 21.811 | 35,47 | ||||
| 2026-02-10 | 13F | CIBC Asset Management Inc | 530.449 | -2,06 | 8.759 | 25,31 | ||||
| 2026-02-17 | 13F | State Of Wisconsin Investment Board | 14.788 | 244 | ||||||
| 2026-02-10 | 13F | CIBC World Markets Inc. | 1.793.058 | -10,48 | 29.585 | 14,35 | ||||
| 2026-02-17 | 13F | Canada Pension Plan Investment Board | 0 | -100,00 | 0 | |||||
| 2026-02-12 | 13F | DJE Kapital AG | 259.800 | 9,21 | 4.305 | 150,96 | ||||
| 2026-02-17 | 13F | SIG North Trading, ULC | Call | 265.800 | -14,62 | 4.383 | 8,89 | |||
| 2026-02-17 | 13F | SIG North Trading, ULC | 78.889 | 328,88 | 1.301 | 448,52 | ||||
| 2026-02-26 | 13F/A | Banque Transatlantique SA | 0 | -100,00 | 0 | -100,00 | ||||
| 2026-02-17 | 13F | SIG North Trading, ULC | Put | 47.800 | 246,38 | 788 | 342,70 | |||
| 2025-11-07 | 13F | Berkshire Asset Management Llc/pa | 0 | -100,00 | 0 | -100,00 | ||||
| 2026-04-13 | 13F | E Fund Management Co., Ltd. | 21.516 | 405 | ||||||
| 2026-01-13 | 13F | Synergy Financial Management, LLC | 18.875 | -73,91 | 311 | -58,42 | ||||
| 2026-02-10 | 13F | Jupiter Asset Management Ltd | 0 | -100,00 | 0 | |||||
| 2026-04-10 | 13F | IAM Advisory, LLC | 47.113 | 887 | ||||||
| 2026-02-17 | 13F | Millennium Management Llc | Put | 0 | -100,00 | 0 | ||||
| 2026-02-06 | 13F | Harvest Portfolios Group Inc. | 122.519 | -10,88 | 2.022 | 13,80 | ||||
| 2026-02-12 | 13F | Dimensional Fund Advisors Lp | 7.773.004 | -21,07 | 128.190 | 0,68 | ||||
| 2025-10-27 | 13F | Eastern Bank | 0 | -100,00 | 0 | |||||
| 2026-02-11 | 13F | CLARET ASSET MANAGEMENT Corp | 60.350 | 0,00 | 1 | |||||
| 2026-04-14 | 13F | Thurston, Springer, Miller, Herd & Titak, Inc. | 6.840 | 98,09 | 129 | 128,57 | ||||
| 2026-02-13 | 13F | L1 Capital Pty Ltd | 1.252.077 | 961,46 | 20.647 | 1.281,00 | ||||
| 2025-11-13 | 13F | Bank Of Montreal /can/ | Put | 0 | -100,00 | 0 | -100,00 | |||
| 2026-02-17 | 13F | Parallax Volatility Advisers, L.P. | Call | 25.000 | 0,00 | 412 | 27,55 | |||
| 2026-01-23 | 13F | Stonehaven Wealth & Tax Solutions, Llc | 0 | -100,00 | 0 | -100,00 | ||||
| 2026-04-07 | 13F | CoreCap Advisors, LLC | 100 | 0,00 | 2 | 0,00 | ||||
| 2026-01-20 | 13F | Raab & Moskowitz Asset Management LLC | 10.923 | 0,00 | 180 | 27,66 | ||||
| 2026-02-13 | 13F | Blueshift Asset Management, LLC | 14.388 | 237 | ||||||
| 2026-04-24 | 13F | Medallion Wealth Advisors, LLC | 4.000 | 0,00 | 75 | 15,38 | ||||
| 2026-02-17 | 13F | Alliancebernstein L.p. | 82.391 | 0,00 | 1.359 | 27,51 | ||||
| 2026-02-05 | 13F | Allworth Financial LP | 81 | 912,50 | 1 | |||||
| 2025-11-14 | 13F/A | Skopos Labs, Inc. | 0 | -100,00 | 0 | -100,00 | ||||
| 2026-02-13 | 13F | Walleye Capital LLC | 455.373 | -54,47 | 7.509 | -41,93 | ||||
| 2026-02-17 | 13F | Advisory Services Network, LLC | 0 | -100,00 | 0 | -100,00 | ||||
| 2026-02-12 | 13F | Marex Group plc | 75.000 | -6,85 | 1.237 | 18,96 | ||||
| 2026-02-17 | 13F | Scientech Research LLC | 0 | -100,00 | 0 | -100,00 | ||||
| 2025-10-28 | 13F | Campbell & CO Investment Adviser LLC | 0 | -100,00 | 0 | |||||
| 2026-02-13 | 13F/A | Alberta Investment Management Corp | 0 | -100,00 | 0 | -100,00 | ||||
| 2026-02-13 | 13F | Smartleaf Asset Management LLC | 273 | 5 | ||||||
| 2026-02-13 | 13F | Aviso Financial Inc. | 0 | -100,00 | 0 | |||||
| 2026-01-27 | 13F | TD Waterhouse Canada Inc. | 19.072 | 54,17 | 313 | 94,41 | ||||
| 2026-02-17 | 13F | Citadel Advisors Llc | Put | 329.400 | -1,20 | 5.432 | 26,01 | |||
| 2026-02-13 | 13F | Rhumbline Advisers | 409 | 0,00 | 7 | 20,00 | ||||
| 2026-02-17 | 13F | Citadel Advisors Llc | Call | 856.000 | -12,23 | 14.115 | 11,93 | |||
| 2026-02-17 | 13F | Oxford Asset Management Llp | 51.825 | -47,93 | 855 | 66,47 | ||||
| 2026-02-12 | 13F | CoreCommodity Management, LLC | 38.363 | -12,76 | 633 | 11,27 | ||||
| 2026-02-13 | 13F | Mariner, LLC | 110.033 | 0,56 | 1.814 | 28,29 | ||||
| 2025-11-10 | 13F | Stevens Capital Management Lp | 0 | -100,00 | 0 | |||||
| 2026-02-17 | 13F | EFG International AG | 5.000 | 82 | ||||||
| 2026-02-17 | 13F | Dauntless Investment Group, LLC | 0 | -100,00 | 0 | -100,00 | ||||
| 2026-01-29 | 13F | IMC-Chicago, LLC | Put | 125.300 | 6,01 | 2.066 | 35,21 | |||
| 2026-02-11 | 13F | Deutsche Bank Ag\ | 3.415.886 | 56,17 | 56.328 | 99,16 | ||||
| 2026-01-29 | 13F | IMC-Chicago, LLC | Call | 253.000 | 66,67 | 4.172 | 112,59 | |||
| 2026-01-27 | 13F | WealthCollab, LLC | 261 | 0,00 | 4 | 33,33 | ||||
| 2026-02-13 | 13F | MAI Capital Management | 100 | 0,00 | 2 | 0,00 | ||||
| 2026-02-11 | 13F | O'shaughnessy Asset Management, Llc | 90.328 | 1.491 | ||||||
| 2025-11-07 | 13F | Shell Asset Management Co | 8.711 | -71,33 | 0 | |||||
| 2026-02-06 | 13F | Bastion Asset Management Inc. | 0 | -100,00 | 0 | -100,00 | ||||
| 2026-01-23 | 13F | LOM Asset Management Ltd | 2.954 | 67 | ||||||
| 2026-02-06 | 13F | Global Retirement Partners, LLC | 2.000 | 33 | ||||||
| 2026-02-17 | 13F/A | Northwest & Ethical Investments L.P. | 343.605 | 0,42 | 5.716 | 30,03 | ||||
| 2026-02-09 | 13F | GeoSphere Capital Management | 225.000 | 0,00 | 3.710 | 27,54 | ||||
| 2026-02-12 | 13F | CIBC Private Wealth Group, LLC | 250 | 0,00 | 4 | 33,33 | ||||
| 2026-02-17 | 13F | Citadel Advisors Llc | 3.361.994 | 113,23 | 55.439 | 171,93 | ||||
| 2026-02-17 | 13F | Merewether Investment Management, LP | 3.335.790 | -2,82 | 55.007 | 23,94 | ||||
| 2026-04-07 | 13F | Signaturefd, Llc | 6.546 | 2,55 | 123 | 17,14 | ||||
| 2026-02-12 | 13F | Hrt Financial Lp | 443.223 | 7 | ||||||
| 2026-02-17 | 13F | Gotham Asset Management, LLC | 104.847 | 52,91 | 1.729 | 95,03 | ||||
| 2026-02-17 | 13F | MIRAE ASSET GLOBAL ETFS HOLDINGS Ltd. | 777 | 13 | ||||||
| 2026-02-12 | 13F | Nuveen, LLC | 428.797 | -79,86 | 7.085 | -74,25 | ||||
| 2026-02-17 | 13F | Ameriprise Financial Inc | 123.854 | -1,49 | 2.042 | 25,66 | ||||
| 2026-02-10 | 13F | Connor, Clark & Lunn Investment Management Ltd. | 4.955.204 | 46,36 | 81.773 | 86,99 | ||||
| 2026-01-07 | 13F | Aventura Private Wealth, LLC | 3.500 | 0,00 | 58 | 26,67 | ||||
| 2026-01-21 | 13F | Sound Income Strategies, LLC | 400 | 7 | ||||||
| 2026-02-13 | 13F | Barclays Plc | 401.178 | -39,21 | 6.615 | -22,48 | ||||
| 2025-11-14 | 13F | Moore Capital Management, Lp | 0 | -100,00 | 0 | |||||
| 2026-01-29 | 13F | Sanctuary Advisors, LLC | 0 | -100,00 | 0 | -100,00 | ||||
| 2026-02-17 | 13F | D. E. Shaw & Co., Inc. | Call | 370.000 | 6.101 | |||||
| 2026-02-17 | 13F | D. E. Shaw & Co., Inc. | 2.083.614 | -50,99 | 34.364 | -37,47 | ||||
| 2026-02-17 | 13F | Trexquant Investment LP | 394.726 | -61,10 | 6.509 | -50,39 | ||||
| 2025-11-10 | 13F | Tableaux Llc | 0 | -100,00 | 0 | -100,00 | ||||
| 2026-02-12 | 13F | Cibc World Markets Corp | Call | 0 | -100,00 | 0 | -100,00 | |||
| 2025-11-03 | 13F | Ruffer LLP | 0 | -100,00 | 0 | |||||
| 2026-02-03 | 13F | Navellier & Associates Inc | 97.007 | 1.600 | ||||||
| 2026-02-13 | 13F | Toroso Investments, LLC | 70.609 | 4,02 | 1.164 | 32,73 | ||||
| 2026-04-22 | 13F | Smallwood Wealth Investment Management, LLC | 29 | 1 | ||||||
| 2026-02-13 | 13F | P Schoenfeld Asset Management Lp | 563.937 | -80,21 | 9.299 | -74,76 | ||||
| 2026-02-13 | 13F | P Schoenfeld Asset Management Lp | Put | 500.000 | 0,00 | 8.245 | 27,53 | |||
| 2026-02-17 | 13F | Graham Capital Management, L.P. | 40.018 | 100,35 | 660 | 155,43 | ||||
| 2026-02-13 | 13F | Neuberger Berman Group LLC | 52.702 | 5,19 | 871 | 34,47 | ||||
| 2026-02-12 | 13F | SWAN Capital LLC | 150 | 0,00 | 2 | 100,00 | ||||
| 2026-02-11 | 13F | Fox Run Management, L.l.c. | 43.640 | 720 | ||||||
| 2026-02-17 | 13F | Susquehanna International Group, Llp | Put | 322.900 | -12,71 | 5.325 | 11,33 | |||
| 2026-02-05 | 13F/A | Fulcrum Asset Management LLP | 20.066 | 336 | ||||||
| 2026-02-17 | 13F | Susquehanna International Group, Llp | Call | 1.626.500 | 10,56 | 26.821 | 41,00 | |||
| 2026-02-17 | 13F | Susquehanna International Group, Llp | 130.240 | -44,38 | 2.148 | -29,07 | ||||
| 2026-02-17 | 13F | Royal Bank Of Canada | 3.801.052 | -7,54 | 62.679 | 17,92 | ||||
| 2026-02-17 | 13F | Cetera Investment Advisers | Call | 0 | -100,00 | 0 | ||||
| 2026-02-13 | 13F | National Bank Of Canada /fi/ | Put | 38 | -49,33 | 63 | -35,42 | |||
| 2026-02-17 | 13F | Adage Capital Partners Gp, L.l.c. | 1.050.000 | 162,50 | 17.314 | 234,76 | ||||
| 2026-02-13 | 13F | NewGen Asset Management Ltd | 0 | -100,00 | 0 | -100,00 | ||||
| 2026-02-17 | 13F | Capstone Investment Advisors, Llc | 0 | -100,00 | 0 | -100,00 | ||||
| 2026-02-17 | 13F | Man Group plc | 293.321 | -59,00 | 4.837 | -47,72 | ||||
| 2026-02-17 | 13F | ExodusPoint Capital Management, LP | 0 | -100,00 | 0 | -100,00 | ||||
| 2025-11-13 | 13F | NewGen Equity Long/Short Fund | 780.000 | -15,78 | 9.032 | 32,49 | ||||
| 2026-03-12 | 13F/A | Peak6 Llc | Call | 284.300 | 25,85 | 4.688 | 60,55 | |||
| 2026-02-17 | 13F | Guggenheim Capital Llc | 391.897 | -19,35 | 6.462 | 2,87 | ||||
| 2026-02-17 | 13F | Edmond De Rothschild Holding S.a. | 343.513 | 21,90 | 5.665 | 55,48 | ||||
| 2026-03-12 | 13F/A | Peak6 Llc | Put | 2.000 | 33 | |||||
| 2026-04-20 | 13F | Ronald Blue Trust, Inc. | 21.065 | 946,97 | 396 | 1.100,00 | ||||
| 2026-02-13 | 13F | National Bank Of Canada /fi/ | Call | 344 | -85,68 | 568 | -81,73 | |||
| 2025-11-13 | 13F | Eisler Capital Management Ltd. | 168.689 | 2.212 | ||||||
| 2026-02-13 | 13F | Bridgefront Capital, LLC | 17.175 | 283 | ||||||
| 2025-10-28 | 13F | Ritholtz Wealth Management | 0 | -100,00 | 0 | -100,00 | ||||
| 2026-02-09 | 13F | Geode Capital Management, Llc | 2.300.370 | -3,95 | 49.855 | 20,46 | ||||
| 2026-02-17 | 13F | Amundi | 4.290.442 | -12,24 | 70.749 | 5,48 | ||||
| 2026-02-10 | 13F | PCJ Investment Counsel Ltd. | 642.050 | -14,06 | 10.595 | 9,80 | ||||
| 2026-02-10 | 13F | Goldman Sachs Group Inc | 951.940 | -51,88 | 15.697 | -38,63 | ||||
| 2026-02-17 | 13F | Tower Research Capital LLC (TRC) | 17.504 | 189,61 | 289 | 269,23 | ||||
| 2026-02-09 | 13F | Employees Retirement System of Texas | 6.172 | 0 | ||||||
| 2026-02-19 | 13F | Invesco Ltd. | 2.613.267 | -14,05 | 43.093 | 9,62 | ||||
| 2026-02-06 | 13F | EverSource Wealth Advisors, LLC | 1.562 | -5,68 | 26 | 19,05 | ||||
| 2026-02-17 | 13F | Farringdon Capital, Ltd. | 0 | -100,00 | 0 | |||||
| 2026-04-07 | 13F | Farther Finance Advisors, LLC | 79 | 2 | ||||||
| 2026-02-09 | 13F | Williamson Legacy Group, LLC | 94.233 | 1.554 | ||||||
| 2026-02-13 | 13F | OMERS ADMINISTRATION Corp | 0 | -100,00 | 0 | |||||
| 2026-01-28 | 13F | U S Global Investors Inc | 575.000 | 15,00 | 9.482 | 46,65 | ||||
| 2026-02-05 | 13F | Gabelli Funds Llc | 2.290.700 | 10,32 | 37.774 | 40,69 | ||||
| 2026-02-12 | 13F | Counterpoint Mutual Funds LLC | 0 | -100,00 | 0 | |||||
| 2026-02-17 | 13F | Woodline Partners LP | 2.597.330 | -54,56 | 42.830 | -42,05 | ||||
| 2026-02-11 | 13F | Group One Trading, L.p. | Put | 152.200 | 4,68 | 2.510 | 33,46 | |||
| 2026-02-11 | 13F | Group One Trading, L.p. | Call | 868.400 | 7,02 | 14.320 | 36,49 | |||
| 2025-11-12 | 13F | Headlands Technologies LLC | 0 | -100,00 | 0 | |||||
| 2026-01-30 | 13F | Wealth High Governance Capital Ltda | 244.105 | -59,32 | 4.025 | -48,12 | ||||
| 2026-02-17 | 13F | Raymond James Financial Inc | 50.052 | -72,88 | 825 | -65,42 | ||||
| 2026-02-11 | 13F | Havemeyer Place LP | 73.243 | 1.208 | ||||||
| 2026-02-09 | 13F | William Blair Investment Management, Llc | 1.221.611 | -9,16 | 20.144 | 15,85 | ||||
| 2026-02-17 | 13F | SummitTX Capital, L.P. | 11.842 | 195 | ||||||
| 2026-02-09 | 13F | Hantz Financial Services, Inc. | 140 | 0 | ||||||
| 2026-02-11 | 13F | Donald Smith & Co., Inc. | 19.630.207 | -20,38 | 323.702 | 1,55 | ||||
| 2026-02-13 | 13F | Towarzystwo Funduszy Inwestycyjnych Pzu Sa | 0 | -100,00 | 0 | |||||
| 2026-02-13 | 13F | Cornerstone Financial Management LLC | 165 | 3 | ||||||
| 2026-02-17 | 13F | Optiver Holding B.V. | 0 | -100,00 | 0 | |||||
| 2026-02-06 | 13F | Larson Financial Group LLC | 26 | 0 | ||||||
| 2026-02-17 | 13F | Investment Management Corp of Ontario | 71.870 | 237,67 | 1.185 | 330,91 | ||||
| 2026-02-10 | 13F | Bank of New York Mellon Corp | 167.557 | 9,11 | 2.763 | 39,19 | ||||
| 2026-02-13 | 13F | Entropy Technologies, LP | 259.453 | 37,60 | 4.278 | 75,54 | ||||
| 2026-02-12 | 13F | Commonwealth Equity Services, Llc | 25.389 | -35,16 | 419 | |||||
| 2026-02-13 | 13F | JustInvest LLC | 40.823 | 6,04 | 673 | 35,41 | ||||
| 2026-02-17 | 13F | Ninepoint Partners LP | 418.900 | 0,00 | 6.908 | 27,53 | ||||
| 2026-04-23 | 13F | Summer Road Llc | 1.200 | 0,00 | 23 | 15,79 | ||||
| 2026-02-11 | 13F | LPL Financial LLC | 73.243 | 79,53 | 1.208 | 129,03 | ||||
| 2026-02-17 | 13F | Caption Management, LLC | Call | 1.175.500 | 35,90 | 19.384 | 73,31 | |||
| 2026-01-27 | 13F | Financial Management Professionals, Inc. | 0 | -100,00 | 0 | |||||
| 2026-02-13 | 13F | Manufacturers Life Insurance Company, The | 0 | -100,00 | 0 | |||||
| 2026-02-13 | 13F | Public Sector Pension Investment Board | 0 | -100,00 | 0 | |||||
| 2026-02-17 | 13F | Fmr Llc | 32.713.937 | 50,27 | 539.778 | 91,92 | ||||
| 2026-02-17 | 13F | Wellington Management Group Llp | 0 | -100,00 | 0 | |||||
| 2026-02-11 | 13F | Picton Mahoney Asset Management | 5.028.974 | 29,17 | 83.106 | 166.112,00 | ||||
| 2026-02-17 | 13F | Cresset Asset Management, LLC | 14.578 | 3,19 | 240 | 31,87 | ||||
| 2025-11-04 | 13F | IMC-Chicago, LLC | 0 | -100,00 | 0 | -100,00 | ||||
| 2026-02-17 | 13F | Cetera Investment Advisers | 279.653 | -14,14 | 4.611 | 9,50 | ||||
| 2026-02-19 | 13F/A | T. Rowe Price Investment Management, Inc. | 3.198.582 | -10,79 | 53 | 13,04 | ||||
| 2026-02-18 | 13F | VGI Partners Ltd | 0 | -100,00 | 0 | -100,00 | ||||
| 2026-04-24 | 13F | Ninety One UK Ltd | 5.051.910 | -1,80 | 95.077 | 12,07 | ||||
| 2026-02-06 | 13F | Prescott Group Capital Management, L.l.c. | 60.000 | 0,00 | 989 | 27,61 | ||||
| 2026-02-12 | 13F | Ci Investments Inc. | 7.362.433 | -1,60 | 121.407 | 126.364,58 | ||||
| 2026-02-17 | 13F | FIL Ltd | 36.367.149 | 124,04 | 600.135 | 186,17 | ||||
| 2026-02-17 | 13F | Capital Fund Management S.a. | Put | 74.400 | 15,71 | 1.227 | 47,53 | |||
| 2026-02-17 | 13F | Capital Fund Management S.a. | Call | 156.900 | 38,60 | 2.587 | 76,83 | |||
| 2026-02-02 | 13F | Intact Investment Management Inc. | 1.072.681 | -33,45 | 17.701 | -15,01 | ||||
| 2026-02-04 | 13F | Ameritas Advisory Services, LLC | 0 | -100,00 | 0 | -100,00 | ||||
| 2026-02-03 | 13F | We Are One Seven, LLC | 17.424 | -34,49 | 287 | -16,33 | ||||
| 2026-04-24 | 13F | UMA Financial Services, Inc. | 113 | 0,00 | 2 | 100,00 | ||||
| 2026-02-17 | 13F | Boothbay Fund Management, Llc | 33.705 | -51,42 | 556 | -38,06 | ||||
| 2026-04-23 | 13F | Oppenheimer & Co Inc | 18.590 | -35,25 | 350 | -26,22 | ||||
| 2025-11-14 | 13F | Brevan Howard Capital Management LP | 0 | -100,00 | 0 | -100,00 | ||||
| 2026-02-04 | 13F | Pensionmark Financial Group, Llc | 10.869 | 179 | ||||||
| 2026-01-27 | 13F | Zurcher Kantonalbank (Zurich Cantonalbank) | 169.329 | 8,76 | 2.798 | 39,09 | ||||
| 2026-02-17 | 13F | Jain Global LLC | 79.000 | 233,52 | 1.304 | 325,82 | ||||
| 2026-02-18 | 13F | Beacon Pointe Advisors, LLC | 10.033 | -11,47 | 165 | 13,01 | ||||
| 2026-02-12 | 13F | Hollencrest Capital Management | 60.298 | 0,00 | 994 | 27,60 | ||||
| 2026-01-23 | 13F | Assetmark, Inc | 85 | 21,43 | 1 | |||||
| 2026-02-10 | 13F | Hillsdale Investment Management Inc. | 1.068.910 | 23,98 | 17.671 | 58,69 | ||||
| 2026-02-11 | 13F | Allianz Asset Management GmbH | 37.492 | -89,45 | 620 | -86,51 | ||||
| 2026-02-11 | 13F | Simplex Trading, Llc | Put | 78.500 | -55,22 | 1.294 | 64.600,00 | |||
| 2026-02-13 | 13F | BRITISH COLUMBIA INVESTMENT MANAGEMENT Corp | 311.951 | -6,93 | 5.148 | 18,90 | ||||
| 2026-02-11 | 13F | Simplex Trading, Llc | Call | 508.700 | -4,15 | 8.388 | 139.700,00 | |||
| 2026-02-17 | 13F | Credit Agricole S A | 120.943 | -68,82 | 1.994 | -60,24 | ||||
| 2026-02-17 | 13F | Lighthouse Investment Partners, LLC | 0 | -100,00 | 0 | -100,00 | ||||
| 2026-01-15 | 13F | Allspring Global Investments Holdings, LLC | 3.917.300 | 11,65 | 64.645 | 42,65 | ||||
| 2026-02-13 | 13F | Squarepoint Ops LLC | Put | 12.700 | 0,00 | 209 | 27,44 | |||
| 2025-11-13 | 13F | Groupe la Francaise | 0 | -100,00 | 0 | -100,00 | ||||
| 2026-02-17 | 13F | Quadrature Capital Ltd | 331.778 | -87,58 | 5.482 | -84,13 | ||||
| 2025-11-12 | 13F | HAP Trading, LLC | Call | 19.000 | 70 | |||||
| 2026-02-11 | 13F | Tiaa Trust, National Association | 10.393 | 0,62 | 171 | 28,57 | ||||
| 2026-02-24 | 13F | DGS Capital Management, LLC | 27.094 | -0,84 | 447 | 26,35 | ||||
| 2026-02-13 | 13F | Sofos Investments, Inc. | 0 | -100,00 | 0 | -100,00 | ||||
| 2026-02-17 | 13F | Advisor Group Holdings, Inc. | 10.540 | -8,65 | 174 | 29,10 | ||||
| 2026-02-10 | 13F | Rothschild Investment Llc | 300 | 0,00 | 5 | 33,33 | ||||
| 2026-02-10 | 13F | Acadian Asset Management Llc | 65.800 | -36,18 | 1 | 0,00 | ||||
| 2026-02-12 | 13F | Renaissance Technologies Llc | 3.510.819 | -47,08 | 57.893 | -32,51 | ||||
| 2026-04-20 | 13F | Cardinal Point Capital Management, ULC | 19.300 | -38,83 | 362 | -30,52 | ||||
| 2026-02-10 | 13F | Bnp Paribas Arbitrage, Sa | 9.953 | -89,12 | 164 | -86,13 | ||||
| 2026-02-13 | 13F | Verition Fund Management LLC | 575.273 | -75,16 | 9.486 | -68,32 | ||||
| 2026-02-11 | 13F | Parallel Advisors, LLC | 3.595 | 0,31 | 59 | 28,26 | ||||
| 2026-04-22 | 13F | Pictet Asset Management Holding SA | 121.914 | 14,06 | 2.285 | 29,39 | ||||
| 2026-01-30 | 13F | Us Bancorp \de\ | 525 | 0,00 | 9 | 33,33 | ||||
| 2026-02-13 | 13F | Golden State Wealth Management, LLC | 100 | 0,00 | 2 | 0,00 | ||||
| 2025-11-25 | 13F | Briaud Financial Planning, Inc | 0 | -100,00 | 0 | |||||
| 2026-02-17 | 13F | Creative Planning | 15.674 | -1,96 | 258 | 25,24 | ||||
| 2026-02-18 | 13F | Mackenzie Financial Corp | 7.085.205 | -36,64 | 118.379 | -18,04 | ||||
| 2026-02-17 | 13F | Keebeck Alpha, LP | 11.881 | -60,92 | 196 | -50,38 | ||||
| 2026-01-29 | 13F | UBS Group AG | 538.012 | -43,81 | 8.872 | -28,34 | ||||
| 2026-02-23 | 13F | Virtu Financial LLC | 0 | -100,00 | 0 | |||||
| 2026-02-13 | 13F | Hudson Bay Capital Management LP | 0 | -100,00 | 0 | -100,00 | ||||
| 2026-02-09 | 13F | Catalyst Funds Management Pty Ltd | 12.300 | 203 | ||||||
| 2026-02-10 | 13F | BW Gestao de Investimentos Ltda. | 155.895 | -61,03 | 2.571 | -50,31 | ||||
| 2026-02-17 | 13F | Tudor Investment Corp Et Al | Put | 34.700 | 572 | |||||
| 2026-02-17 | 13F | Tudor Investment Corp Et Al | Call | 39.300 | 648 | |||||
| 2026-01-28 | 13F | HB Wealth Management, LLC | 109.000 | 0,00 | 1.797 | 27,54 | ||||
| 2026-01-28 | 13F | Arizona State Retirement System | 0 | -100,00 | 0 | -100,00 | ||||
| 2026-02-13 | 13F | Vontobel Holding Ltd. | 428.560 | -14,29 | 7.072 | 9,51 | ||||
| 2026-02-12 | 13F | Insigneo Advisory Services, Llc | 15.535 | 256 | ||||||
| 2026-02-12 | 13F | Scotia Capital Inc. | 45.768 | 41,31 | 752 | 80,77 | ||||
| 2026-02-06 | 13F | Associated Banc-corp | 18.251 | 0,00 | 301 | 27,66 | ||||
| 2026-02-06 | 13F | Vestmark Advisory Solutions, Inc. | 33.757 | 557 | ||||||
| 2026-02-17 | 13F | Point72 Asset Management, L.P. | Put | 158.400 | 2.612 | |||||
| 2026-02-17 | 13F | Point72 Asset Management, L.P. | Call | 571.300 | 9.421 | |||||
| 2026-02-17 | 13F | Point72 Asset Management, L.P. | 1.527.199 | -9,36 | 25.187 | 15,62 | ||||
| 2025-11-13 | 13F | Dynamic Technology Lab Private Ltd | 0 | -100,00 | 0 | |||||
| 2026-04-17 | 13F | Bell Investment Advisors, Inc | 100 | -27,01 | 2 | -50,00 | ||||
| 2026-04-22 | 13F | Stone House Investment Management, LLC | 20 | 0 | ||||||
| 2026-02-10 | 13F | Envestnet Asset Management Inc | 23.405 | -11,97 | 386 | 12,24 | ||||
| 2026-02-12 | 13F | Alps Advisors Inc | 356.027 | 0,52 | 5.871 | 28,19 | ||||
| 2026-02-09 | 13F | Themes Management Co LLC | 101.831 | 1.680 | ||||||
| 2026-01-26 | 13F | La Banque Postale Asset Management SA | 58.049 | 152,50 | 957 | 222,22 | ||||
| 2026-03-03 | 13F/A | Caitong International Asset Management Co., Ltd | 0 | -100,00 | 0 | |||||
| 2026-04-08 | 13F | E Fund Management (Hong Kong) Co., Ltd. | 21.516 | -37,11 | 405 | -52,47 | ||||
| 2026-02-18 | 13F | Vident Advisory, LLC | 99.567 | -54,67 | 1.642 | -42,20 | ||||
| 2026-02-04 | 13F | Tsfg, Llc | 0 | -100,00 | 0 | |||||
| 2026-02-05 | 13F | Cambridge Investment Research Advisors, Inc. | 25.649 | 73,66 | 0 | |||||
| 2026-02-12 | 13F | BlackRock, Inc. | 19.301.077 | -23,50 | 318.275 | -2,44 | ||||
| 2025-11-12 | 13F | Northwest & Ethical Investments L.P. | Call | 0 | -100,00 | 0 | -100,00 | |||
| 2026-02-13 | 13F | Schroder Investment Management Group | 4.080.553 | 10,05 | 68.349 | 43,67 | ||||
| 2026-02-10 | 13F | Savant Capital, LLC | 20.497 | 14,51 | 338 | 45,89 | ||||
| 2026-04-22 | 13F | Continuum Advisory, LLC | 0 | -100,00 | 0 | |||||
| 2026-02-13 | 13F | FORA Capital, LLC | 0 | -100,00 | 0 | |||||
| 2026-02-17 | 13F | Aqr Capital Management Llc | 92.514 | 1.527 | ||||||
| 2026-04-22 | 13F | Apollon Wealth Management, LLC | 35.189 | 0,00 | 662 | 14,14 | ||||
| 2026-04-16 | 13F | Fiduciary Advisors, Inc. | 8 | 0,00 | 0 | |||||
| 2026-02-17 | 13F | Two Sigma Investments, Lp | 560.193 | -40,80 | 9.238 | -24,50 | ||||
| 2026-01-29 | 13F | Golden State Equity Partners | 30.000 | -57,14 | 495 | -45,41 | ||||
| 2026-02-11 | 13F | Tradition Wealth Management, LLC | 0 | -100,00 | 0 | -100,00 | ||||
| 2026-02-17 | 13F | Jones Financial Companies Lllp | 142 | -95,08 | 2 | -94,29 | ||||
| 2026-02-05 | 13F | Leuthold Group, Llc | 613.738 | -25,39 | 10.121 | -4,85 | ||||
| 2026-02-13 | 13F | Citigroup Inc | 77.141 | 231,60 | 1.275 | 324,67 | ||||
| 2026-02-13 | 13F | Arrowstreet Capital, Limited Partnership | 6.023.434 | -46,08 | 99.377 | -31,15 | ||||
| 2026-04-07 | 13F | Alpha Omega Wealth Management LLC | 12.000 | 0,00 | 226 | 14,21 | ||||
| 2026-02-10 | 13F | Td Asset Management Inc | 3.431.834 | 38,97 | 56.707 | 77,69 | ||||
| 2026-02-17 | 13F | Anson Funds Management LP | Call | 0 | -100,00 | 0 | -100,00 | |||
| 2026-02-17 | 13F | Polar Asset Management Partners Inc. | 180.000 | -21,74 | 2.971 | 0,00 | ||||
| 2026-02-17 | 13F | XTX Topco Ltd | 21.483 | -85,38 | 354 | -81,36 | ||||
| 2026-02-10 | 13F/A | Northwestern Mutual Wealth Management Co | 10.763 | 1,54 | 177 | 29,20 | ||||
| 2026-02-13 | 13F | Winmill & Co. Inc | 1.190.000 | -4,49 | 19.623 | 21,81 | ||||
| 2026-04-13 | 13F | IFP Advisors, Inc | 2.449 | 672,56 | 46 | 820,00 | ||||
| 2025-11-14 | 13F | Paulson & Co. Inc. | 0 | -100,00 | 0 | |||||
| 2026-02-09 | 13F | Legal & General Group Plc | 1.922.766 | -12,66 | 31.771 | 11,68 | ||||
| 2026-02-10 | 13F | Measured Wealth Private Client Group, LLC | 65.613 | -13,54 | 1.082 | 10,19 | ||||
| 2026-02-17 | 13F | Nomura Holdings Inc | 1.288.777 | -11,04 | 21.252 | 13,45 | ||||
| 2025-11-14 | 13F | EAM Global Investors LLC | 0 | -100,00 | 0 | -100,00 | ||||
| 2026-02-17 | 13F | Covalis Capital Llp | 0 | -100,00 | 0 | -100,00 | ||||
| 2025-11-12 | 13F | Stifel Financial Corp | 0 | -100,00 | 0 | |||||
| 2026-04-21 | 13F | Alpine Associates Management Inc. | 0 | -100,00 | 0 | |||||
| 2026-02-17 | 13F | Susquehanna Advisors Group, Inc. | 339.200 | 5.593 | ||||||
| 2026-01-30 | 13F | Precision Wealth Strategies, LLC | 12.232 | 202 | ||||||
| 2026-02-10 | 13F | Natixis Advisors, L.p. | 24.286 | 0,00 | 0 | |||||
| 2026-02-13 | 13F | Pale Fire Capital SE | 0 | -100,00 | 0 | -100,00 | ||||
| 2025-11-07 | 13F | HighTower Advisors, LLC | 0 | -100,00 | 0 | |||||
| 2025-11-14 | 13F | Capula Management Ltd | 0 | -100,00 | 0 | |||||
| 2026-02-17 | 13F | Balyasny Asset Management Llc | 35.723 | -82,21 | 589 | -77,31 | ||||
| 2026-02-12 | 13F | Jane Street Group, Llc | 2.075.522 | 510,64 | 34.225 | 678,90 | ||||
| 2026-02-12 | 13F | Jane Street Group, Llc | Put | 20.800 | 3,48 | 343 | 32,05 | |||
| 2026-02-12 | 13F | Jane Street Group, Llc | Call | 185.900 | 36,99 | 3.065 | 74,74 | |||
| 2026-02-17 | 13F | Sciencast Management LP | 26.399 | 435 | ||||||
| 2026-02-05 | 13F | Gamco Investors, Inc. Et Al | 378.025 | -3,88 | 6.242 | 22,78 | ||||
| 2026-02-17 | 13F | Orion Resource Partners LP | 124.438 | 5,40 | 2.054 | 34,62 | ||||
| 2026-01-29 | 13F | Teachers Retirement System Of The State Of Kentucky | 0 | -100,00 | 0 | |||||
| 2026-02-06 | 13F | Cumberland Partners Ltd | 27.400 | 453 | ||||||
| 2026-02-13 | 13F | Y-Intercept (Hong Kong) Ltd | 0 | -100,00 | 0 | |||||
| 2026-02-09 | 13F | Harbour Investments, Inc. | 97 | 438,89 | 2 | |||||
| 2026-02-06 | 13F | GPS Wealth Strategies Group, LLC | 0 | -100,00 | 0 | -100,00 | ||||
| 2026-02-11 | 13F | Erste Asset Management GmbH | 79.500 | 0,00 | 1.310 | 28,46 | ||||
| 2026-02-17 | 13F | Weiss Asset Management LP | 103.560 | 1.708 | ||||||
| 2026-02-11 | 13F | Jpmorgan Chase & Co | Call | 0 | -100,00 | 0 | -100,00 | |||
| 2026-02-17 | 13F | Voloridge Investment Management, Llc | 3.502.469 | 261,80 | 57.756 | 361,41 | ||||
| 2026-02-13 | 13F | Pin Oak Investment Advisors Inc | 1.798 | 0 | ||||||
| 2025-12-09 | 13F/A | Tudor Investment Corp Et Al | 0 | -100,00 | 0 | |||||
| 2026-02-17 | 13F | Schonfeld Strategic Advisors LLC | 307.771 | -37,35 | 5.075 | -20,09 | ||||
| 2026-02-17 | 13F | DZ BANK AG Deutsche Zentral Genossenschafts Bank, Frankfurt am Main | 0 | -100,00 | 0 | |||||
| 2026-02-13 | 13F | Eschler Asset Management LLP | 84.717 | 1.397 | ||||||
| 2025-11-14 | 13F | Cubist Systematic Strategies, LLC | Call | 112.300 | 1.452 | |||||
| 2025-11-14 | 13F | Cubist Systematic Strategies, LLC | 243.339 | 3.146 | ||||||
| 2026-04-17 | 13F | PKO Investment Management Joint-Stock Co | 211.974 | -21,49 | 3.978 | -10,89 | ||||
| 2026-02-06 | 13F/A | Rathbone Brothers plc | 41.890 | 3,71 | 691 | 32,18 | ||||
| 2026-02-02 | 13F | Danske Bank A/s | 0 | -100,00 | 0 | -100,00 | ||||
| 2025-11-14 | 13F | EAM Investors, LLC | 0 | -100,00 | 0 | -100,00 | ||||
| 2026-02-17 | 13F | Bank Of America Corp /de/ | 9.155.154 | -18,22 | 150.968 | 4,30 | ||||
| 2026-02-12 | 13F | Swiss National Bank | 1.139.000 | 1,29 | 18.834 | 29,59 | ||||
| 2026-02-13 | 13F | Charles Schwab Investment Management Inc | 1.492.579 | 0,31 | 24.663 | 28,27 | ||||
| 2025-11-13 | 13F | Macquarie Group Ltd | 0 | -100,00 | 0 | -100,00 | ||||
| 2026-02-17 | 13F | Russell Investments Group, Ltd. | 188.494 | -48,97 | 3.115 | -34,76 | ||||
| 2026-02-17 | 13F | Quantitative Investment Management, LLC | 0 | -100,00 | 0 | |||||
| 2026-02-09 | 13F | Royce & Associates Lp | 500.000 | 0,00 | 8.245 | 27,53 | ||||
| 2026-02-17 | 13F | Public Employees Retirement System Of Ohio | 196.534 | -10,85 | 3.247 | 13,97 | ||||
| 2026-02-17 | 13F | New Vernon Capital Holdings II LLC | 6.813 | 0,00 | 154 | 75,00 | ||||
| 2025-11-12 | 13F | 111 Capital | 0 | -100,00 | 0 | -100,00 | ||||
| 2026-02-06 | 13F | Profund Advisors Llc | 60.253 | -15,08 | 994 | 8,29 | ||||
| 2026-02-10 | 13F | Linscomb & Williams, Inc. | 20.000 | 0,00 | 330 | 27,52 | ||||
| 2025-11-21 | 13F/A | CIBC Bancorp USA Inc. | Call | 226.000 | 2.922 | |||||
| 2026-02-13 | 13F | Victory Capital Management Inc | 2.130.244 | 0,00 | 35.128 | 27,53 | ||||
| 2026-02-05 | 13F | Baader Bank INC | 0 | -100,00 | 0 | -100,00 | ||||
| 2026-02-13 | 13F | Bornite Capital Management LP | 0 | -100,00 | 0 | -100,00 | ||||
| 2025-11-14 | 13F | Eqis Capital Management, Inc. | 0 | -100,00 | 0 | |||||
| 2026-02-12 | 13F | Federation des caisses Desjardins du Quebec | 1.450.075 | 26,31 | 23.877 | 61,20 | ||||
| 2026-02-09 | 13F | Waratah Capital Advisors Ltd. | 2.603.269 | 23,17 | 42.928 | 57,08 | ||||
| 2026-02-03 | 13F | SBI Securities Co., Ltd. | 3.476 | 366,58 | 57 | 533,33 | ||||
| 2026-01-29 | 13F | Vanguard Group Inc | 23.836.156 | 4,69 | 393.328 | 33,72 | ||||
| 2026-02-12 | 13F | Bank Of Montreal /can/ | Call | 100.000 | 0,00 | 1.650 | 27,81 | |||
| 2026-02-12 | 13F | Bank Of Montreal /can/ | 3.329.868 | 0,07 | 54.951 | 27,85 | ||||
| 2025-11-14 | 13F | Point72 Asia (Singapore) Pte. Ltd. | 0 | -100,00 | 0 | -100,00 | ||||
| 2026-04-22 | 13F | Louisbourg Investments Inc. | 318.300 | 3,21 | 5.974 | 17,21 | ||||
| 2026-02-04 | 13F | BCJ Capital Management, LLC | 0 | -100,00 | 0 | -100,00 | ||||
| 2026-02-17 | 13F | 683 Capital Management, LLC | 900.000 | 0,00 | 14.841 | 27,53 | ||||
| 2026-02-12 | 13F | Wealthspire Advisors, LLC | 0 | -100,00 | 0 | -100,00 | ||||
| 2026-02-11 | 13F | Jpmorgan Chase & Co | 543.297 | -54,11 | 8.959 | -41,49 | ||||
| 2026-02-13 | 13F | Extract Advisors LLC | 1.232.612 | 20.326 | ||||||
| 2026-02-13 | 13F | Ubs Asset Management Americas Inc | 0 | -100,00 | 0 | |||||
| 2026-01-21 | 13F/A | Euro Pacific Asset Management, LLC | 1.343.139 | -8,85 | 22 | 15,79 | ||||
| 2026-02-13 | 13F | Van Eck Associates Corp | 45.453.726 | -12,58 | 750 | 11,46 | ||||
| 2025-11-14 | 13F | Two Sigma Advisers, Lp | 0 | -100,00 | 0 | |||||
| 2026-02-17 | 13F | Driehaus Capital Management Llc | 3.274.437 | 13,37 | 53.995 | 44,59 | ||||
| 2026-02-13 | 13F | Wells Fargo & Company/mn | 46.579 | 125,35 | 768 | 187,64 | ||||
| 2026-02-17 | 13F | Captrust Financial Advisors | 12.995 | 214 | ||||||
| 2026-02-13 | 13F | Gallo Partners, LP | 59.572 | -82,29 | 982 | -77,41 | ||||
| 2026-01-14 | 13F | ORG Partners LLC | 670 | 0,00 | 11 | 37,50 | ||||
| 2026-02-11 | 13F | Franklin Resources Inc | 32.011 | 4,83 | 528 | 34,01 | ||||
| 2026-02-10 | 13F | Godfrey Financial Associates, Inc. | 51 | 1 | ||||||
| 2026-02-17 | 13F | Cantor Fitzgerald, L. P. | 0 | -100,00 | 0 | |||||
| 2026-02-13 | 13F | Centiva Capital, LP | 0 | -100,00 | 0 | |||||
| 2025-11-14 | 13F | Wolverine Trading, Llc | 39.206 | 503 | ||||||
| 2025-11-14 | 13F | Wolverine Trading, Llc | Call | 148.400 | 1.904 | |||||
| 2026-02-13 | 13F | Flow Traders U.s. Llc | 0 | -100,00 | 0 | |||||
| 2025-11-14 | 13F | Wolverine Trading, Llc | Put | 34.900 | 448 | |||||
| 2026-02-12 | 13F | Chilton Capital Management Llc | 2.300 | 0,00 | 38 | 27,59 | ||||
| 2026-04-15 | 13F | Generali Investments CEE, investicni spolecnost, a.s. | 20.000 | 0,00 | 376 | 14,29 |