Grundlæggende statistik
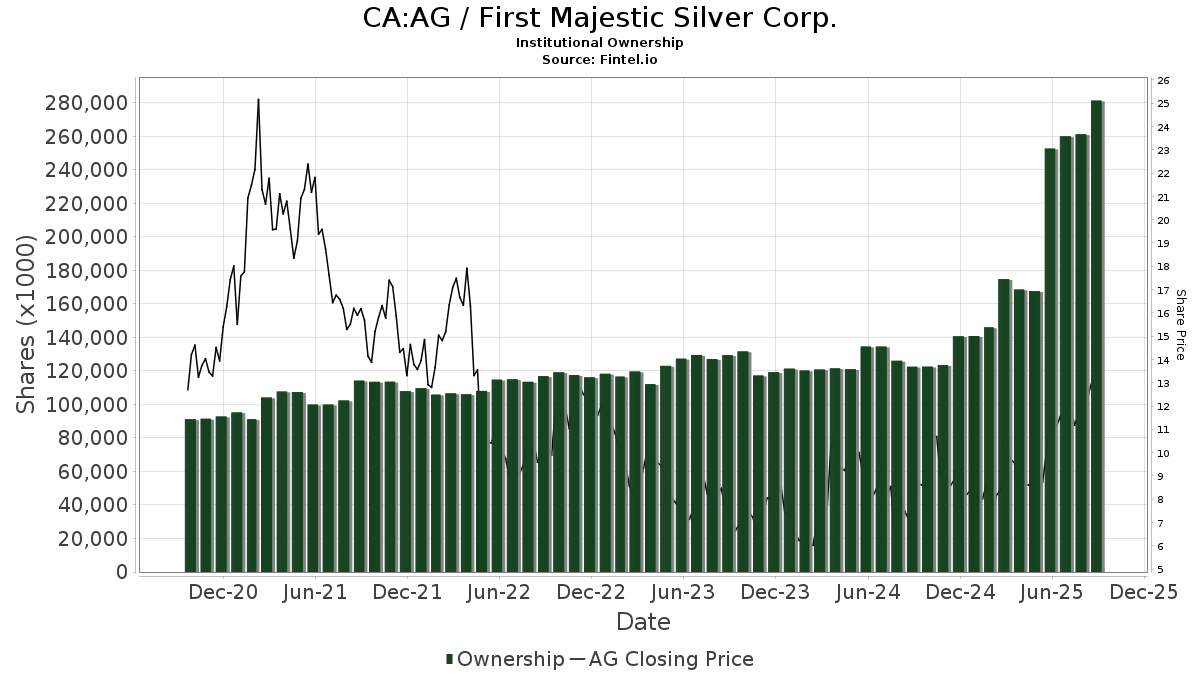
| Institutionelle aktier (lange) | 226.066.085 - 45,79% (ex 13D/G) - change of -64,27MM shares -22,14% MRQ |
| Institutionel værdi (lang) | $ 3.097.945 USD ($1000) |
Institutionelt ejerskab og aktionærer
First Majestic Silver Corp. (CA:AG) har 327 institutionelle ejere og aktionærer, der har indsendt 13D/G- eller 13F-formularer til Securities Exchange Commission (SEC). Disse institutioner har i alt 226,066,085 aktier. Største aktionærer omfatter Van Eck Associates Corp, Toroso Investments, LLC, MIRAE ASSET GLOBAL ETFS HOLDINGS Ltd., Vanguard Group Inc, Arrowstreet Capital, Limited Partnership, Exor Capital LLP, Alps Advisors Inc, Jupiter Asset Management Ltd, Susquehanna International Group, Llp, and Susquehanna International Group, Llp .
First Majestic Silver Corp. (TSX:AG) institutionel ejerskabsstruktur viser aktuelle positioner i virksomheden efter institutioner og fonde, samt seneste ændringer i positionsstørrelse. Større aktionærer kan omfatte individuelle investorer, investeringsforeninger, hedgefonde eller institutioner. Skema 13D angiver, at investoren besidder (eller besidder) mere end 5 % af virksomheden og har til hensigt (eller har til hensigt at) aktivt at forfølge en ændring i forretningsstrategi. Skema 13G indikerer en passiv investering på over 5%.
The share price as of April 24, 2026 is 28,07 / share. Previously, on April 28, 2025, the share price was 8,64 / share. This represents an increase of 224,88% over that period.
Fondens stemningsscore
Fund Sentiment Score (fka Ownership Accumulation Score) finder de aktier, der bliver mest købt af fonde. Det er resultatet af en sofistikeret, multi-faktor kvantitativ model, der identificerer virksomheder med de højeste niveauer af institutionel akkumulering. Scoringsmodellen bruger en kombination af den samlede stigning i oplyste ejere, ændringerne i porteføljeallokeringer i disse ejere og andre målinger. Tallet går fra 0 til 100, hvor højere tal indikerer et højere niveau af akkumulering for sine jævnaldrende, og 50 er gennemsnittet.
Opdateringsfrekvens: Dagligt
Se Ownership Explorer, som giver en liste over højest rangerende virksomheder.
AI+ Ask Fintel’s AI assistant about First Majestic Silver Corp..
Select a question to share a public post with an AI-crafted answer.
Thinking of good questions…
13F og NPORT arkivering
Detaljer om 13F-arkivering er gratis. Detaljer om NP-ansøgninger kræver et premium-medlemskab. Grønne rækker angiver nye positioner. Røde rækker angiver lukkede positioner. Klik på linket ikon for at se den fulde transaktionshistorik.
Opgrader
for at låse premium-data op og eksportere til Excel ![]() .
.
| Fil dato | Kilde | Investor | Type | Gennemsnitlig pris (Øst) |
Aktier | Δ Aktier (%) |
Rapporteret Værdi ($1000) |
Δ Værdi (%) |
Port Alloc (%) |
|
|---|---|---|---|---|---|---|---|---|---|---|
| 2026-02-18 | 13F | Garton & Associates Financial Advisors LLC | 4.967 | 83 | ||||||
| 2026-01-16 | 13F | Genesis Financial Group, LLC | 19.500 | 325 | ||||||
| 2026-02-05 | 13F | Baader Bank INC | 15.014 | -40,45 | 154 | -19,37 | ||||
| 2026-02-17 | 13F | SummitTX Capital, L.P. | 18.638 | 311 | ||||||
| 2026-02-10 | 13F | Jupiter Asset Management Ltd | 9.393.080 | -3,15 | 156.489 | 31,29 | ||||
| 2026-02-17 | 13F | Guggenheim Capital Llc | 351.499 | -24,55 | 5.856 | 2,27 | ||||
| 2026-02-17 | 13F | Man Group plc | 1.750.500 | 102,63 | 29.163 | 174,68 | ||||
| 2025-11-14 | 13F | Zacks Investment Management | 0 | -100,00 | 0 | -100,00 | ||||
| 2026-02-17 | 13F | Investment Management Corp of Ontario | 56.447 | 229,83 | 940 | 347,62 | ||||
| 2026-02-12 | 13F | Penserra Capital Management LLC | 46.356 | 1 | ||||||
| 2025-11-12 | 13F | Parametrica Management Ltd | 0 | -100,00 | 0 | -100,00 | ||||
| 2026-02-11 | 13F | Total Wealth Planning & Management, Inc. | 46.152 | -19,67 | 769 | 61,68 | ||||
| 2026-02-12 | 13F | DJE Kapital AG | 0 | -100,00 | 0 | -100,00 | ||||
| 2026-01-29 | 13F | RMG Wealth Management LLC | 725 | 0,00 | 17 | 77,78 | ||||
| 2026-02-17 | 13F | Aqr Capital Management Llc | 23.413 | 391 | ||||||
| 2026-02-17 | 13F | Creative Planning | 25.833 | -9,13 | 430 | 23,21 | ||||
| 2026-02-12 | 13F | Mark Sheptoff Financial Planning, Llc | 575 | 10 | ||||||
| 2026-02-17 | 13F | IHT Wealth Management, LLC | 12.494 | 3,06 | 208 | 40,54 | ||||
| 2026-04-17 | 13F | Vermillion Wealth Management, Inc. | 76 | 2 | ||||||
| 2026-04-21 | 13F | PharVision Advisers, LLC | 0 | -100,00 | 0 | |||||
| 2026-02-11 | 13F | Simplex Trading, Llc | Call | 1.797.600 | 3,70 | 29.948 | 142.509,52 | |||
| 2026-02-17 | 13F | Point72 Asset Management, L.P. | 137.661 | 2.288 | ||||||
| 2026-02-11 | 13F | Simplex Trading, Llc | Put | 563.300 | -55,36 | 9.385 | 62.460,00 | |||
| 2026-02-11 | 13F | Simplex Trading, Llc | 9.307 | -97,85 | 155 | 3.000,00 | ||||
| 2026-02-17 | 13F | Point72 Asset Management, L.P. | Call | 11.300 | 188 | |||||
| 2026-01-23 | 13F | Assetmark, Inc | 119 | 0,00 | 2 | 0,00 | ||||
| 2025-11-06 | 13F | Claudia M.p. Batlle, Crp (r) Llc | 0 | -100,00 | 0 | -100,00 | ||||
| 2026-02-12 | 13F | Hollencrest Capital Management | 14.530 | 10,92 | 242 | 51,25 | ||||
| 2026-02-10 | 13F | Bnp Paribas Arbitrage, Sa | 37.883 | -91,32 | 631 | -88,23 | ||||
| 2026-02-13 | 13F | Mariner, LLC | 68.389 | 32,57 | 1.139 | 79,65 | ||||
| 2026-02-17 | 13F | Numerai GP LLC | 58.158 | -12,91 | 969 | 18,05 | ||||
| 2026-02-17 | 13F | Susquehanna International Group, Llp | Call | 8.484.300 | 12,61 | 141.348 | 52,66 | |||
| 2026-02-17 | 13F | Susquehanna International Group, Llp | 5.355.767 | 81,09 | 89.227 | 145,48 | ||||
| 2026-04-22 | 13F | Coastal Investment Advisors, Inc. | 416.889 | -30,50 | 8.955 | -10,39 | ||||
| 2026-02-17 | 13F | Asset One Wealth Management LLC | 29.278 | 597 | ||||||
| 2026-02-17 | 13F | Amundi | 980.059 | -28,78 | 16.328 | -7,60 | ||||
| 2026-02-17 | 13F | Susquehanna International Group, Llp | Put | 3.374.300 | 31,17 | 56.216 | 77,82 | |||
| 2026-02-12 | 13F | Moneta Group Investment Advisors Llc | 44.964 | 8,26 | 749 | 46,86 | ||||
| 2026-02-17 | 13F | Blair William & Co/il | 0 | -100,00 | 0 | |||||
| 2026-02-17 | 13F | Balyasny Asset Management Llc | 0 | -100,00 | 0 | |||||
| 2025-11-12 | 13F | R Squared Ltd | 0 | -100,00 | 0 | -100,00 | ||||
| 2025-11-10 | 13F | Atomi Financial Group, Inc. | 0 | -100,00 | 0 | -100,00 | ||||
| 2026-04-15 | 13F | Financial Management Professionals, Inc. | 110 | 0,00 | 2 | 100,00 | ||||
| 2025-11-14 | 13F | Credit Agricole S A | 0 | -100,00 | 0 | -100,00 | ||||
| 2026-02-02 | 13F | Wolverine Asset Management Llc | Put | 2.611.000 | -35,39 | 43.499 | -12,42 | |||
| 2026-02-18 | 13F | State of Tennessee, Treasury Department | 10.903 | 227 | ||||||
| 2025-11-14 | 13F | Aigen Investment Management, Lp | 0 | -100,00 | 0 | |||||
| 2026-01-30 | 13F | Bogart Wealth, LLC | 3.500 | 52,17 | 58 | 107,14 | ||||
| 2026-02-17 | 13F | Bank Of America Corp /de/ | Call | 0 | -100,00 | 0 | ||||
| 2026-02-06 | 13F | FourThought Financial Partners, LLC | 55.596 | 926 | ||||||
| 2026-02-17 | 13F | SIG North Trading, ULC | Call | 328.100 | 71,78 | 5.466 | 132,89 | |||
| 2026-02-17 | 13F | SIG North Trading, ULC | 541.959 | 27,33 | 9.029 | 72,61 | ||||
| 2026-02-17 | 13F | SIG North Trading, ULC | Put | 310.000 | 67,21 | 5.165 | 126,69 | |||
| 2026-02-02 | 13F | Wolverine Asset Management Llc | 287.477 | -51,93 | 4.789 | -34,83 | ||||
| 2026-02-11 | 13F | Winton Capital Group Ltd | 38.000 | 633 | ||||||
| 2026-02-17 | 13F | DZ BANK AG Deutsche Zentral Genossenschafts Bank, Frankfurt am Main | 1.135.376 | -23,66 | 18.933 | 3,66 | ||||
| 2025-11-14 | 13F | Point72 Asia (Singapore) Pte. Ltd. | 0 | -100,00 | 0 | -100,00 | ||||
| 2026-02-13 | 13F | AlTi Global, Inc. | 106.955 | 0,00 | 1.753 | 38,91 | ||||
| 2026-02-17 | 13F | State Of Wisconsin Investment Board | 11.231 | 188 | ||||||
| 2026-02-12 | 13F | Sprott Inc. | 619.628 | -69,58 | 10.325 | -58,66 | ||||
| 2026-02-17 | 13F | Toronto Dominion Bank | Call | 2.800 | -70,53 | 47 | -60,34 | |||
| 2026-02-17 | 13F | Caption Management, LLC | Call | 0 | -100,00 | 0 | ||||
| 2026-01-28 | 13F | Key Client Fiduciary Advisors, LLC | 0 | -100,00 | 0 | -100,00 | ||||
| 2026-02-17 | 13F | Toronto Dominion Bank | Put | 2.800 | -50,00 | 47 | -32,35 | |||
| 2026-02-17 | 13F | Prelude Capital Management, Llc | 16.815 | -41,56 | 280 | -20,68 | ||||
| 2026-04-13 | 13F | Hm Payson & Co | 3.430 | 243,00 | 74 | 356,25 | ||||
| 2026-02-17 | 13F | Toronto Dominion Bank | 240.318 | 171,58 | 4.010 | 268,81 | ||||
| 2026-01-28 | 13F | Mountain Capital Investment Advisors, Inc | 23.061 | 20,29 | 587 | 149,36 | ||||
| 2026-04-23 | 13F | American National Bank | 7.970 | 0,00 | 171 | 29,55 | ||||
| 2026-03-06 | 13F | Hsbc Holdings Plc | 287.277 | -61,80 | 4.786 | -48,20 | ||||
| 2026-02-17 | 13F | Caption Management, LLC | 75.500 | 1.258 | ||||||
| 2026-02-17 | 13F | Pinnacle Financial Partners, Inc. | 36.554 | 609 | ||||||
| 2026-02-23 | 13F | Virtu Financial LLC | 0 | -100,00 | 0 | |||||
| 2026-02-17 | 13F | Nomura Holdings Inc | Call | 0 | -100,00 | 0 | -100,00 | |||
| 2026-02-13 | 13F | Change Path, LLC | 17.937 | 299 | ||||||
| 2025-11-10 | 13F | Optiver Holding B.V. | 0 | -100,00 | 0 | |||||
| 2026-02-17 | 13F | Two Sigma Investments, Lp | 1.616.331 | 23,67 | 26.928 | 67,65 | ||||
| 2026-04-17 | 13F | RFG Advisory, LLC | 147.127 | 21,57 | 3.160 | 56,75 | ||||
| 2026-02-13 | 13F | Y-Intercept (Hong Kong) Ltd | 0 | -100,00 | 0 | -100,00 | ||||
| 2026-01-28 | 13F | Key Client Fiduciary Advisors, LLC | Call | 0 | -100,00 | 0 | -100,00 | |||
| 2026-01-28 | 13F | Teacher Retirement System Of Texas | 4.918.000 | 9,75 | 81.934 | 48,78 | ||||
| 2026-04-23 | 13F | Forum Financial Management, LP | 0 | -100,00 | 0 | -100,00 | ||||
| 2026-04-20 | 13F | Banque Cantonale Vaudoise | 9.974 | -54,53 | 214 | -41,37 | ||||
| 2025-11-14 | 13F | Cubist Systematic Strategies, LLC | 0 | -100,00 | 0 | -100,00 | ||||
| 2026-02-10 | 13F | Sittner & Nelson, Llc | 3.000 | 66 | ||||||
| 2026-02-13 | 13F | Quarry LP | 7.361 | 58,13 | 123 | 114,04 | ||||
| 2026-02-12 | 13F | Brinker Capital Investments, LLC | 24.999 | 2,96 | 416 | 39,60 | ||||
| 2026-02-17 | 13F | Jones Financial Companies Lllp | 16.568 | 163,57 | 276 | 263,16 | ||||
| 2026-02-17 | 13F | Cetera Investment Advisers | 357.191 | -20,44 | 5.951 | 7,85 | ||||
| 2026-02-17 | 13F | Cetera Investment Advisers | Call | 1.500 | -77,94 | 15 | -61,11 | |||
| 2026-02-23 | 13F | Wealth Preservation Advisors, LLC | 2.576 | 0,00 | 43 | 35,48 | ||||
| 2025-11-14 | 13F | Wolverine Trading, Llc | 33.556 | -85,61 | 416 | -77,75 | ||||
| 2026-02-05 | 13F | Tucker Asset Management Llc | 20 | 0 | ||||||
| 2025-11-14 | 13F | Wolverine Trading, Llc | Call | 1.471.700 | 143,10 | 18.264 | 276,17 | |||
| 2025-11-14 | 13F | Wolverine Trading, Llc | Put | 564.600 | 64,18 | 7.007 | 154,02 | |||
| 2026-02-10 | 13F | Ritter Daniher Financial Advisory LLC / DE | 700 | 12 | ||||||
| 2026-02-17 | 13F | Engineers Gate Manager LP | 90.213 | -49,27 | 1.503 | -31,26 | ||||
| 2026-02-19 | 13F | Invesco Ltd. | 1.552.733 | 49,09 | 25.869 | 102,09 | ||||
| 2026-02-10 | 13F | Exor Capital LLP | 10.046.918 | 0,24 | 167.382 | 35,89 | ||||
| 2026-04-20 | 13F | Ronald Blue Trust, Inc. | 1.806 | -14,25 | 39 | 8,57 | ||||
| 2026-02-02 | 13F | Wolverine Asset Management Llc | Call | 101.600 | 1.693 | |||||
| 2026-02-17 | 13F | Perritt Capital Management Inc | 0 | -100,00 | 0 | |||||
| 2026-01-15 | 13F | Cherry Creek Investment Advisors, Inc. | 11.578 | 0,00 | 193 | 35,21 | ||||
| 2026-02-13 | 13F | OMERS ADMINISTRATION Corp | 0 | -100,00 | 0 | -100,00 | ||||
| 2026-02-17 | 13F | Bank Of America Corp /de/ | 3.163.816 | -25,69 | 52.709 | 0,74 | ||||
| 2026-02-13 | 13F | Great West Life Assurance Co /can/ | 155.515 | -21,07 | 3 | 0,00 | ||||
| 2025-10-28 | 13F | Csenge Advisory Group | 0 | -100,00 | 0 | |||||
| 2026-02-17 | 13F | Integrated Advisors Network LLC | 0 | -100,00 | 0 | |||||
| 2026-02-12 | 13F | BRYN MAWR TRUST Co | 15.000 | 0,00 | 250 | 35,33 | ||||
| 2026-02-10 | 13F | CIBC World Markets Inc. | 62.283 | 5,54 | 1.040 | 43,51 | ||||
| 2026-02-17 | 13F | Old Mission Capital Llc | 17.558 | 293 | ||||||
| 2026-04-21 | 13F | Financial Consulate, Inc | 50 | 0,00 | 1 | |||||
| 2026-02-10 | 13F | CIBC Asset Management Inc | 426.933 | -2,44 | 7.127 | 32,79 | ||||
| 2026-02-17 | 13F | D. E. Shaw & Co., Inc. | Call | 145.800 | -2,02 | 2.429 | 32,88 | |||
| 2026-02-13 | 13F | JustInvest LLC | 17.728 | 12,82 | 295 | 52,85 | ||||
| 2026-02-17 | 13F | Brevan Howard Capital Management LP | 18.174 | 303 | ||||||
| 2026-02-17 | 13F | D. E. Shaw & Co., Inc. | Put | 28.200 | 470 | |||||
| 2026-02-13 | 13F | Bank Of Nova Scotia | 66.668 | 1.109 | ||||||
| 2026-02-17 | 13F | D. E. Shaw & Co., Inc. | 725.783 | 0,46 | 12.092 | 36,20 | ||||
| 2026-02-03 | 13F | Legacy Wealth Managment, LLC/ID | 400 | 0,00 | 7 | 50,00 | ||||
| 2026-02-06 | 13F | Leonteq Securities AG | 7.983 | -61,95 | 133 | -48,64 | ||||
| 2026-01-07 | 13F | Aventura Private Wealth, LLC | 2.513 | 0,00 | 42 | 36,67 | ||||
| 2026-02-05 | 13F | Cambridge Investment Research Advisors, Inc. | 106.948 | -41,50 | 2 | -50,00 | ||||
| 2026-02-13 | 13F | Marshall Wace, Llp | 0 | -100,00 | 0 | -100,00 | ||||
| 2025-11-21 | 13F | Nebula Research & Development LLC | 0 | -100,00 | 0 | -100,00 | ||||
| 2026-02-11 | 13F | Parallel Advisors, LLC | 1.540 | -7,45 | 26 | 25,00 | ||||
| 2026-02-17 | 13F | Royal Bank Of Canada | 452.311 | -67,24 | 7.535 | -55,59 | ||||
| 2026-04-15 | 13F | Hatch Cove Capital, Llc | 0 | -100,00 | 0 | |||||
| 2026-02-17 | 13F | Captrust Financial Advisors | 108.752 | 243,35 | 1.812 | 365,55 | ||||
| 2026-04-13 | 13F | Creative Financial Designs Inc /adv | 16.854 | -33,44 | 362 | -14,01 | ||||
| 2026-04-16 | 13F | First Community Trust Na | 128 | 0,00 | 3 | 0,00 | ||||
| 2026-02-11 | 13F | Group One Trading, L.p. | Put | 714.300 | -45,76 | 11.900 | -26,47 | |||
| 2025-11-13 | 13F | Renaissance Technologies Llc | 0 | -100,00 | 0 | |||||
| 2026-02-11 | 13F | Group One Trading, L.p. | Call | 1.314.600 | 14,51 | 21.901 | 55,24 | |||
| 2026-01-28 | 13F | CAPROCK Group, Inc. | 85.000 | 0,00 | 1.416 | 82,24 | ||||
| 2026-02-11 | 13F | Group One Trading, L.p. | 1.452.576 | -13,08 | 24.200 | 17,83 | ||||
| 2026-01-29 | 13F | UBS Group AG | 1.128.351 | -25,52 | 18.798 | 0,96 | ||||
| 2026-04-22 | 13F | Stone House Investment Management, LLC | 333 | 0,00 | 7 | 40,00 | ||||
| 2025-11-13 | 13F | MYDA Advisors LLC | 0 | -100,00 | 0 | |||||
| 2026-02-09 | 13F | Quest Partners LLC | 4.352 | 0,00 | 73 | 35,85 | ||||
| 2026-01-22 | 13F | Brookwood Investment Group LLC | Call | 16.500 | 14 | |||||
| 2026-04-17 | 13F | AdvisorNet Financial, Inc | 6.878 | 13,24 | 148 | 45,54 | ||||
| 2026-02-13 | 13F | Vontobel Holding Ltd. | 47.002 | 6,58 | 783 | 44,46 | ||||
| 2026-02-17 | 13F | LMR Partners LLP | Put | 0 | -100,00 | 0 | -100,00 | |||
| 2026-01-27 | 13F | Fiscal Wisdom Wealth Management, LLC | 50.449 | -37,33 | 840 | -17,57 | ||||
| 2026-02-13 | 13F | Kestra Advisory Services, LLC | 0 | -100,00 | 0 | |||||
| 2026-01-21 | 13F | New Wave Wealth Advisors Llc | 18.850 | 314 | ||||||
| 2026-02-11 | 13F | Franklin Resources Inc | 26.706 | 4,90 | 446 | 42,63 | ||||
| 2026-02-12 | 13F | SWAN Capital LLC | 150 | -40,00 | 2 | -33,33 | ||||
| 2026-02-13 | 13F | Schroder Investment Management Group | 1.017.370 | -46,35 | 16.949 | -27,97 | ||||
| 2026-01-29 | 13F | UBS Group AG | Put | 237.300 | 0,00 | 3.953 | 35,56 | |||
| 2026-02-13 | 13F | Manufacturers Life Insurance Company, The | 0 | -100,00 | 0 | |||||
| 2026-04-08 | 13F | Miracle Mile Advisors, LLC | 0 | -100,00 | 0 | |||||
| 2026-01-27 | 13F | Zurcher Kantonalbank (Zurich Cantonalbank) | 150.422 | 2,00 | 2.513 | 38,71 | ||||
| 2026-04-22 | 13F | Pictet Asset Management Holding SA | 182.238 | 127,60 | 3.905 | 192,00 | ||||
| 2026-04-24 | 13F | Raiffeisen Bank International AG | Call | 3.500 | 0,00 | 75 | 53,06 | |||
| 2026-02-13 | 13F | National Bank Of Canada /fi/ | 427.076 | -68,80 | 7.110 | -57,67 | ||||
| 2026-04-22 | 13F | Spire Wealth Management | 0 | -100,00 | 0 | |||||
| 2026-01-15 | 13F | Lodestone Wealth Management LLC | 1.500 | 25 | ||||||
| 2026-02-17 | 13F | Schonfeld Strategic Advisors LLC | 0 | -100,00 | 0 | |||||
| 2026-04-13 | 13F | Artemis Investment Management LLP | 0 | -100,00 | 0 | |||||
| 2026-02-13 | 13F | National Bank Of Canada /fi/ | Call | 188 | -72,51 | 314 | -62,74 | |||
| 2026-01-07 | 13F | Marotta Asset Management | 76.500 | 0,00 | 1.274 | 35,97 | ||||
| 2026-04-06 | 13F | CX Institutional | 100 | 0 | ||||||
| 2026-02-02 | 13F | Danske Bank A/s | Call | 5.000 | 0,00 | 59 | 61,11 | |||
| 2026-02-04 | 13F | Atlantic Union Bankshares Corp | 0 | -100,00 | 0 | |||||
| 2026-02-11 | 13F | Fox Run Management, L.l.c. | 41.754 | 696 | ||||||
| 2026-04-08 | 13F | Wealth Enhancement Advisory Services, Llc | 12.146 | 265 | ||||||
| 2026-02-13 | 13F | Bridgewater Associates, LP | 54.838 | 914 | ||||||
| 2026-02-09 | 13F | Harbour Investments, Inc. | 24.656 | 2,91 | 411 | 39,46 | ||||
| 2026-04-13 | 13F | IFP Advisors, Inc | 4.077 | 88 | ||||||
| 2026-02-17 | 13F | Russell Investments Group, Ltd. | 207.365 | 300,88 | 3.463 | 445,35 | ||||
| 2026-04-17 | 13F | Paragon Capital Management Inc | 10.000 | 0,00 | 215 | 28,92 | ||||
| 2026-02-13 | 13F | Evelyn Partners Investment Management (Europe) Ltd | 4.700 | 0,00 | 78 | 36,84 | ||||
| 2026-02-13 | 13F | Mml Investors Services, Llc | 10.320 | -24,34 | 172 | 2,40 | ||||
| 2026-02-06 | 13F | Pnc Financial Services Group, Inc. | 530 | 9 | ||||||
| 2026-02-18 | 13F | Vident Advisory, LLC | 59.779 | 996 | ||||||
| 2026-04-24 | 13F | Oakworth Capital, Inc. | 1.200 | 33,33 | 26 | 78,57 | ||||
| 2026-02-03 | 13F | McIlrath & Eck, LLC | 200 | 0,00 | 3 | 50,00 | ||||
| 2026-02-04 | 13F | Tsfg, Llc | 925 | 0,00 | 0 | |||||
| 2026-02-12 | 13F | Rossby Financial, LCC | 260 | 0,00 | 4 | 33,33 | ||||
| 2026-02-03 | 13F | SBI Securities Co., Ltd. | 15.789 | 257,54 | 263 | 387,04 | ||||
| 2026-04-22 | 13F | Bravera Wealth | 1.882 | 0,00 | 40 | 29,03 | ||||
| 2026-01-16 | 13F | Sharp Financial Services, LLC | 18.990 | 0,00 | 316 | 35,62 | ||||
| 2026-02-03 | 13F | Entruity Wealth, LLC | 25.713 | 0,00 | 428 | 35,44 | ||||
| 2026-02-13 | 13F | National Bank Of Canada /fi/ | Put | 165 | -63,33 | 275 | -50,18 | |||
| 2026-02-10 | 13F | PCJ Investment Counsel Ltd. | 256.360 | -29,53 | 4.277 | -4,23 | ||||
| 2026-01-29 | 13F | Vanguard Group Inc | 18.995.222 | 5,24 | 316.914 | 42,97 | ||||
| 2025-11-13 | 13F | Tradition Wealth Management, LLC | 0 | -100,00 | 0 | |||||
| 2026-04-22 | 13F | Atlantic Edge Private Wealth Management, LLC | 50 | 1 | ||||||
| 2026-04-15 | 13F | FNY Investment Advisers, LLC | Call | 0 | -100,00 | 0 | ||||
| 2026-04-16 | 13F | SG Americas Securities, LLC | Put | 150.000 | 0 | |||||
| 2026-02-17 | 13F | SPWM Advisors LLC | 15.164 | 253 | ||||||
| 2026-02-06 | 13F | EverSource Wealth Advisors, LLC | 1.341 | 3,23 | 22 | 46,67 | ||||
| 2026-02-09 | 13F | Mizuho Securities Usa Llc | 90.000 | 1.469 | ||||||
| 2026-02-13 | 13F | State Street Corp | 10.047 | 167 | ||||||
| 2026-02-14 | 13F | Rockefeller Capital Management L.P. | 141.161 | 10,36 | 2.352 | 49,65 | ||||
| 2026-04-23 | 13F | Harbor Investment Advisory, Llc | 1.500 | 32 | ||||||
| 2026-02-13 | 13F | Verition Fund Management LLC | Call | 46.400 | -41,27 | 773 | -20,31 | |||
| 2026-02-13 | 13F | Verition Fund Management LLC | 70.069 | -44,35 | 1.167 | -24,56 | ||||
| 2026-02-17 | 13F | Clear Street Markets Llc | Put | 13.000 | -87,00 | 217 | -82,42 | |||
| 2026-02-13 | 13F | Verition Fund Management LLC | Put | 140.600 | -45,86 | 2.342 | -26,61 | |||
| 2026-02-17 | 13F | Scientech Research LLC | 0 | -100,00 | 0 | |||||
| 2026-02-17 | 13F | Trexquant Investment LP | 611.874 | -32,23 | 10.194 | -8,14 | ||||
| 2026-04-09 | 13F | Pacifica Partners Inc. | 340 | 0,00 | 7 | 40,00 | ||||
| 2026-02-18 | 13F/A | Alberta Investment Management Corp | 0 | -100,00 | 0 | -100,00 | ||||
| 2026-04-09 | 13F | Veracity Capital LLC | 18.325 | -21,57 | 394 | 1,03 | ||||
| 2026-04-20 | 13F | SILVER OAK SECURITIES, Inc | 38.257 | -1,59 | 822 | 24,77 | ||||
| 2026-02-06 | 13F | Auxano Advisors, LLC | 102.000 | 1.699 | ||||||
| 2026-02-13 | 13F | Arrowstreet Capital, Limited Partnership | 15.041.912 | 408,13 | 250.821 | 589,86 | ||||
| 2026-04-23 | 13F | Sawyer & Company, Inc | 1.365 | -49,91 | 29 | -35,56 | ||||
| 2026-02-11 | 13F | M Holdings Securities, Inc. | 22.230 | 0 | ||||||
| 2026-02-17 | 13F | Tudor Investment Corp Et Al | 133.896 | -45,29 | 2.231 | -25,84 | ||||
| 2026-02-10 | 13F | Moors & Cabot, Inc. | 35.680 | 1,09 | 594 | 37,18 | ||||
| 2026-02-09 | 13F | Employees Retirement System of Texas | 4.252 | 0 | ||||||
| 2026-02-12 | 13F | Steward Partners Investment Advisory, Llc | 200 | 0,00 | 3 | 50,00 | ||||
| 2026-02-17 | 13F | Advisor Group Holdings, Inc. | 60.615 | 57,71 | 1.010 | 156,74 | ||||
| 2026-02-02 | 13F | Danske Bank A/s | 2 | 0,00 | 0 | |||||
| 2026-02-13 | 13F | Bridgefront Capital, LLC | 12.731 | 212 | ||||||
| 2026-02-13 | 13F | Squarepoint Ops LLC | Put | 46.400 | -81,02 | 773 | -74,27 | |||
| 2026-02-13 | 13F | Squarepoint Ops LLC | 219.052 | 63,53 | 3.649 | 121,69 | ||||
| 2026-02-03 | 13F | Cabot Wealth Management Inc | 11.290 | 188 | ||||||
| 2026-04-21 | 13F | Wedbush Securities Inc | 13.549 | 0 | ||||||
| 2026-02-13 | 13F | Squarepoint Ops LLC | Call | 11.500 | -87,29 | 192 | -82,82 | |||
| 2026-04-24 | 13F | Mitchell Mcleod Pugh & Williams Inc | 10.940 | 0,00 | 235 | -2,50 | ||||
| 2026-02-17 | 13F | Elequin Capital Lp | 219 | 4 | ||||||
| 2026-02-17 | 13F | Farringdon Capital, Ltd. | 0 | -100,00 | 0 | |||||
| 2026-04-16 | 13F | Toth Financial Advisory Corp | 100 | 0,00 | 2 | 100,00 | ||||
| 2026-02-17 | 13F | Tudor Investment Corp Et Al | Put | 23.000 | 383 | |||||
| 2026-01-30 | 13F | Us Bancorp \de\ | 3.585 | 39,98 | 60 | 90,32 | ||||
| 2026-04-20 | 13F | Kestra Private Wealth Services, Llc | Call | 0 | -100,00 | 0 | ||||
| 2026-02-13 | 13F | Morgan Stanley | 3.809.109 | 63,15 | 63.460 | 121,17 | ||||
| 2026-03-12 | 13F/A | Peak6 Llc | Put | 200.300 | -68,61 | 3.337 | -57,45 | |||
| 2026-02-10 | 13F | Bank of New York Mellon Corp | 0 | -100,00 | 0 | |||||
| 2026-03-12 | 13F/A | Peak6 Llc | Call | 33.300 | -90,37 | 555 | -86,96 | |||
| 2026-02-13 | 13F | Toroso Investments, LLC | Call | 90.500 | 1.508 | |||||
| 2026-02-13 | 13F | Toroso Investments, LLC | 24.336.779 | 15,81 | 405.451 | 56,99 | ||||
| 2026-03-12 | 13F/A | Peak6 Llc | 1.264.470 | 42,49 | 21.066 | 93,16 | ||||
| 2026-02-13 | 13F | Financial Sense Advisors, Inc. | 0 | -100,00 | 0 | -100,00 | ||||
| 2026-04-02 | 13F | Hilltop National Bank | 174 | 0,00 | 4 | 50,00 | ||||
| 2026-02-13 | 13F | Neuberger Berman Group LLC | 48.843 | 816 | ||||||
| 2026-02-09 | 13F | SLT Holdings LLC | 0 | -100,00 | 0 | |||||
| 2026-02-09 | 13F | SLT Holdings LLC | Call | 0 | -100,00 | 0 | ||||
| 2026-02-17 | 13F | XTX Topco Ltd | 14.409 | -82,93 | 240 | -76,86 | ||||
| 2026-02-17 | 13F | Citadel Advisors Llc | Put | 3.119.100 | -8,40 | 51.964 | 24,18 | |||
| 2026-02-12 | 13F | Kovack Advisors, Inc. | 33.645 | 566 | ||||||
| 2026-04-07 | 13F | CoreCap Advisors, LLC | 11.700 | -26,69 | 251 | -5,28 | ||||
| 2026-01-28 | 13F | Chicago Partners Investment Group LLC | 7.950 | 202 | ||||||
| 2026-02-12 | 13F | CIBC Private Wealth Group, LLC | 897 | 0,00 | 15 | 27,27 | ||||
| 2026-01-29 | 13F | IMC-Chicago, LLC | 1.439.550 | 126,90 | 23.983 | 207,58 | ||||
| 2025-11-14 | 13F | Luminist Capital LLC | 0 | -100,00 | 0 | -100,00 | ||||
| 2026-01-29 | 13F | IMC-Chicago, LLC | Put | 1.235.000 | 68,62 | 20.575 | 128,59 | |||
| 2026-01-29 | 13F | IMC-Chicago, LLC | Call | 1.664.000 | 54,55 | 27.722 | 109,51 | |||
| 2025-11-12 | 13F | HAP Trading, LLC | Put | 11.700 | 4 | |||||
| 2025-11-12 | 13F | HAP Trading, LLC | Call | 258.200 | 742 | |||||
| 2026-04-15 | 13F | Generali Investments CEE, investicni spolecnost, a.s. | 27.233 | 0,00 | 585 | 28,92 | ||||
| 2026-02-12 | 13F | Commonwealth Equity Services, Llc | 57.593 | 23,43 | 959 | |||||
| 2025-11-14 | 13F | Two Sigma Advisers, Lp | 0 | -100,00 | 0 | |||||
| 2026-02-17 | 13F | Royal Bank Of Canada | Call | 0 | -100,00 | 0 | -100,00 | |||
| 2026-04-09 | 13F | Firethorn Wealth Partners, Llc | 9.995 | 215 | ||||||
| 2025-11-13 | 13F | Newbridge Financial Services Group, Inc. | 0 | -100,00 | 0 | |||||
| 2026-02-17 | 13F | Citadel Advisors Llc | Call | 2.411.900 | -0,25 | 40.182 | 35,22 | |||
| 2026-02-12 | 13F | Chilton Capital Management Llc | 2.850 | 0,00 | 47 | 34,29 | ||||
| 2026-02-17 | 13F | Citadel Advisors Llc | 4.910.061 | -59,62 | 81.802 | -45,27 | ||||
| 2026-02-12 | 13F | Nuveen, LLC | 1.251.442 | -20,75 | 20.907 | 7,80 | ||||
| 2026-02-13 | 13F | Gts Securities Llc | 25.268 | -30,14 | 421 | -5,41 | ||||
| 2026-02-17 | 13F | Raymond James Financial Inc | 452.621 | 8,09 | 7.541 | 46,52 | ||||
| 2026-02-20 | 13F | Sunbelt Securities, Inc. | 710 | 0,00 | 12 | 37,50 | ||||
| 2026-02-13 | 13F | Van Eck Associates Corp | 40.140.689 | -7,14 | 669 | 25,80 | ||||
| 2026-02-17 | 13F | DV Trading LLC | 4 | 0 | ||||||
| 2026-02-12 | 13F | Quadrant Capital Group Llc | 275 | -65,15 | 5 | -55,56 | ||||
| 2026-02-13 | 13F | Bard Associates Inc | 3.150 | 52 | ||||||
| 2026-02-17 | 13F | MIRAE ASSET GLOBAL ETFS HOLDINGS Ltd. | 19.182.180 | 1,32 | 320.461 | 37,81 | ||||
| 2026-01-21 | 13F/A | Euro Pacific Asset Management, LLC | 38.660 | 9,35 | 0 | |||||
| 2026-04-23 | 13F | J.w. Cole Advisors, Inc. | 159.108 | -11,79 | 3.418 | 319,78 | ||||
| 2026-02-10 | 13F | Foundations Investment Advisors, LLC | 105.943 | 747,54 | 1.765 | 1.053,59 | ||||
| 2026-02-18 | 13F | NFP Retirement, Inc. | 32.450 | 1,41 | 541 | 37,40 | ||||
| 2026-02-13 | 13F | Walleye Capital LLC | 2 | 0 | ||||||
| 2026-02-13 | 13F | Walleye Capital LLC | Call | 220.000 | -35,84 | 3.665 | -13,03 | |||
| 2026-02-13 | 13F | Smartleaf Asset Management LLC | 1.040 | 18 | ||||||
| 2026-02-17 | 13F | Bank Of America Corp /de/ | Put | 0 | -100,00 | 0 | ||||
| 2026-02-10 | 13F | Greenwich Wealth Management LLC | 100.000 | 0,00 | 2 | 0,00 | ||||
| 2026-02-13 | 13F | Walleye Capital LLC | Put | 301.500 | 238,38 | 5.023 | 358,63 | |||
| 2026-04-07 | 13F | Signaturefd, Llc | 25.837 | -0,89 | 555 | 27,65 | ||||
| 2026-02-17 | 13F | Fmr Llc | 237.161 | -78,77 | 3.951 | -71,23 | ||||
| 2026-04-09 | 13F | Towarzystwo Funduszy Inwestycyjnych Allianz Polska S.A. | 41.500 | -50,95 | 891 | -37,78 | ||||
| 2026-02-10 | 13F | Goldman Sachs Group Inc | 1.169.563 | -43,81 | 19.485 | -23,83 | ||||
| 2026-02-13 | 13F | Motiv8 Investments LLC | 100 | 0 | ||||||
| 2026-02-18 | 13F | Caitlin John, LLC | 500 | -16,67 | 8 | 14,29 | ||||
| 2026-01-21 | 13F | Flagship Harbor Advisors, Llc | 140 | 2 | ||||||
| 2026-01-28 | 13F | Geneos Wealth Management Inc. | 191.102 | 2,92 | 3.184 | 39,54 | ||||
| 2026-02-10 | 13F | Goldman Sachs Group Inc | Put | 120.000 | 0,00 | 1.999 | 35,62 | |||
| 2026-04-07 | 13F | Farther Finance Advisors, LLC | 5.098 | 39,02 | 113 | 85,25 | ||||
| 2026-02-17 | 13F | Private Advisor Group, LLC | 109.269 | -10,50 | 1.820 | 21,33 | ||||
| 2026-02-13 | 13F | Rhumbline Advisers | 5.756 | -16,13 | 96 | 13,10 | ||||
| 2026-02-11 | 13F | Deutsche Bank Ag\ | 39.279 | -12,99 | 654 | 18,05 | ||||
| 2026-02-17 | 13F | Lighthouse Investment Partners, LLC | 0 | -100,00 | 0 | |||||
| 2026-04-20 | 13F | Cardinal Point Capital Management, ULC | 15.700 | -29,91 | 336 | -10,43 | ||||
| 2026-02-17 | 13F | FIL Ltd | Put | 3.550.000 | -45,93 | 59.143 | -26,70 | |||
| 2026-02-17 | 13F | ExodusPoint Capital Management, LP | 0 | -100,00 | 0 | -100,00 | ||||
| 2026-02-12 | 13F | Andina Capital Management, LLC | 0 | -100,00 | 0 | -100,00 | ||||
| 2026-02-10 | 13F | Hillsdale Investment Management Inc. | 1.639.690 | -38,62 | 27.406 | -16,44 | ||||
| 2026-02-17 | 13F | O'Domhnaill Enterprises, Inc. | 308.161 | 5.134 | ||||||
| 2026-02-04 | 13F | Oxbow Advisors, LLC | 40.472 | -5,26 | 674 | 28,38 | ||||
| 2026-02-17 | 13F | Jain Global LLC | 42.590 | 131,88 | 710 | 215,56 | ||||
| 2026-02-06 | 13F | Profund Advisors Llc | 47.317 | -16,48 | 788 | 13,22 | ||||
| 2026-04-14 | 13F | Opal Wealth Advisors, LLC | 1.400 | 30 | ||||||
| 2026-02-09 | 13F | Themes Management Co LLC | 44.152 | 737 | ||||||
| 2026-02-13 | 13F | Stifel Financial Corp | 116.911 | 683,01 | 1.948 | 963,93 | ||||
| 2026-02-18 | 13F | Mackenzie Financial Corp | 2.869.121 | 67,33 | 48.502 | 130,40 | ||||
| 2026-04-14 | 13F | Nbc Securities, Inc. | 139 | 0,00 | 3 | 0,00 | ||||
| 2026-02-13 | 13F | Ubs Asset Management Americas Inc | 68 | -99,98 | 1 | -99,98 | ||||
| 2025-11-10 | 13F | Raiffeisen Bank International AG | 0 | -100,00 | 0 | -100,00 | ||||
| 2026-03-13 | 13F/A | Pensionmark Financial Group, Llc | 11.462 | 191 | ||||||
| 2026-02-05 | 13F | Allworth Financial LP | 5.790 | 5,25 | 96 | 43,28 | ||||
| 2026-02-17 | 13F | Millennium Management Llc | Call | 165.100 | -13,70 | 2.751 | 16,97 | |||
| 2025-11-14 | 13F | Point72 (DIFC) Ltd | 0 | -100,00 | 0 | -100,00 | ||||
| 2026-02-17 | 13F | Millennium Management Llc | Put | 182.900 | 3,51 | 3.047 | 40,35 | |||
| 2026-02-17 | 13F | Millennium Management Llc | 55.288 | -92,23 | 921 | -89,47 | ||||
| 2026-02-17 | 13F | Capital Fund Management S.a. | Put | 89.400 | -59,62 | 1.489 | -45,28 | |||
| 2026-02-17 | 13F | Parvin Asset Management, LLC | 81.350 | 0,59 | 1.355 | 36,46 | ||||
| 2026-02-13 | 13F | Public Sector Pension Investment Board | 26.772 | 447 | ||||||
| 2026-02-17 | 13F | Capital Fund Management S.a. | Call | 146.800 | -56,91 | 2.446 | -41,60 | |||
| 2026-02-13 | 13F | SRS Capital Advisors, Inc. | 1.900 | -24,84 | 32 | 0,00 | ||||
| 2026-04-14 | 13F | Tradewinds Capital Management, LLC | 300 | -59,46 | 6 | -50,00 | ||||
| 2026-02-11 | 13F | LPL Financial LLC | 642.322 | -10,95 | 10.701 | 20,72 | ||||
| 2026-01-30 | 13F | New Harbor Financial Group, LLC | 11.491 | 191 | ||||||
| 2026-02-13 | 13F | MAI Capital Management | 10.000 | 0,00 | 167 | 36,07 | ||||
| 2026-02-12 | 13F | Alps Advisors Inc | 9.621.720 | 33,58 | 160.298 | 81,07 | ||||
| 2026-02-09 | 13F | Huntington National Bank | 1 | 0,00 | 0 | |||||
| 2026-02-09 | 13F | Legal & General Group Plc | 431.594 | -51,53 | 7.210 | -34,07 | ||||
| 2026-02-17 | 13F | Cresset Asset Management, LLC | 17.900 | 0,00 | 298 | 36,07 | ||||
| 2025-11-14 | 13F | Capstone Investment Advisors, Llc | 16.582 | 204 | ||||||
| 2026-02-17 | 13F | Keebeck Alpha, LP | 16.815 | -39,89 | 280 | -18,37 | ||||
| 2026-02-12 | 13F | Swiss National Bank | 870.880 | 2,12 | 14.560 | 38,97 | ||||
| 2026-02-13 | 13F | Pine Valley Investments Ltd Liability Co | Call | 233 | -47,17 | |||||
| 2026-02-13 | 13F | Pine Valley Investments Ltd Liability Co | 47.852 | -3,46 | 797 | 30,87 | ||||
| 2025-10-31 | 13F | La Banque Postale Asset Management SA | 0 | -100,00 | 0 | -100,00 | ||||
| 2025-11-12 | 13F | Catalyst Funds Management Pty Ltd | 0 | -100,00 | 0 | -100,00 | ||||
| 2026-02-13 | 13F | Charles Schwab Investment Management Inc | 1.117.045 | 5,09 | 18.662 | 42,94 | ||||
| 2026-02-17 | 13F | Equitable Holdings, Inc. | 14.581 | 243 | ||||||
| 2026-02-18 | 13F | Beacon Pointe Advisors, LLC | 15.569 | 259 | ||||||
| 2026-02-18 | 13F | Beacon Pointe Advisors, LLC | Call | 13.700 | 31,73 | 228 | 79,53 | |||
| 2026-02-06 | 13F | HighTower Advisors, LLC | 33.392 | -14,70 | 556 | 15,59 | ||||
| 2026-02-13 | 13F | Entropy Technologies, LP | 0 | -100,00 | 0 | -100,00 | ||||
| 2026-02-17 | 13F | Canada Pension Plan Investment Board | 718.200 | 39,13 | 11.983 | 89,08 | ||||
| 2026-02-13 | 13F | Rokos Capital Management LLP | 867.052 | 14.449 | ||||||
| 2026-04-21 | 13F | OneAscent Financial Services LLC | 11.910 | 0,03 | 256 | 28,79 | ||||
| 2025-11-03 | 13F | AE Wealth Management LLC | 0 | -100,00 | 0 | -100,00 | ||||
| 2026-02-13 | 13F | BRITISH COLUMBIA INVESTMENT MANAGEMENT Corp | 244.587 | -8,61 | 4.081 | 24,20 | ||||
| 2026-04-20 | 13F | City State Bank | 100 | 0,00 | 2 | 100,00 | ||||
| 2026-02-10 | 13F/A | Northwestern Mutual Wealth Management Co | 115 | -97,72 | 2 | -98,36 | ||||
| 2026-02-12 | 13F | Bank Of Montreal /can/ | Put | 250.600 | 0,24 | 4.181 | 36,23 | |||
| 2026-02-12 | 13F | Bank Of Montreal /can/ | Call | 532.700 | -35,30 | 8.888 | -12,07 | |||
| 2026-02-12 | 13F | Bank Of Montreal /can/ | 2.939.499 | 6,11 | 49.044 | 44,21 | ||||
| 2026-02-10 | 13F | Quantbot Technologies LP | 0 | -100,00 | 0 | |||||
| 2026-02-13 | 13F | Caitong International Asset Management Co., Ltd | 0 | -100,00 | 0 | -100,00 | ||||
| 2026-02-12 | 13F | Scotia Capital Inc. | 20.687 | 344 | ||||||
| 2026-04-08 | 13F | E Fund Management (Hong Kong) Co., Ltd. | 17.806 | -36,89 | 382 | -51,40 | ||||
| 2026-02-11 | 13F | O'shaughnessy Asset Management, Llc | 0 | -100,00 | 0 | -100,00 | ||||
| 2026-04-15 | 13F | Corundum Trust Company, INC | 12.000 | 0,00 | 258 | 29,15 | ||||
| 2025-11-07 | 13F | Shell Asset Management Co | 6.635 | -71,40 | 0 | |||||
| 2026-04-23 | 13F | Oppenheimer & Co Inc | 12.034 | -6,21 | 258 | 21,13 | ||||
| 2026-02-11 | 13F | Total Wealth Planning & Management, Inc. | Call | 0 | -100,00 | 0 | -100,00 | |||
| 2026-02-03 | 13F | We Are One Seven, LLC | 18.925 | 0,54 | 315 | 36,36 | ||||
| 2026-01-29 | 13F | Concurrent Investment Advisors, LLC | 0 | -100,00 | 0 | -100,00 | ||||
| 2026-02-06 | 13F | Global Retirement Partners, LLC | 4.249 | -29,51 | 71 | -5,41 | ||||
| 2026-02-17 | 13F | Boothbay Fund Management, Llc | 13.147 | 219 | ||||||
| 2026-02-17 | 13F | Wiley Bros.-aintree Capital, Llc | 114.181 | 0,91 | 1.902 | 36,83 | ||||
| 2026-02-17 | 13F | National Asset Management, Inc. | Call | 3.000 | 50 | |||||
| 2026-02-17 | 13F | National Asset Management, Inc. | Put | 1.000 | 17 | |||||
| 2026-02-17 | 13F | Oxford Asset Management Llp | 16.697 | -63,10 | 278 | -50,00 | ||||
| 2026-02-17 | 13F | National Asset Management, Inc. | 86.849 | 52,78 | 1.447 | 107,16 | ||||
| 2026-02-13 | 13F | Citigroup Inc | 17.474 | -96,63 | 292 | -95,44 | ||||
| 2026-02-17 | 13F/A | Northwest & Ethical Investments L.P. | 106.415 | -8,14 | 1.776 | 24,82 | ||||
| 2026-02-17 | 13F | Limestone Investment Advisors LP | 0 | -100,00 | 0 | -100,00 | ||||
| 2026-02-13 | 13F | Colony Group, LLC | 10.858 | 181 | ||||||
| 2026-02-17 | 13F | EFG International AG | 1.500 | 25 | ||||||
| 2026-02-11 | 13F | Jpmorgan Chase & Co | 52.621 | -9,80 | 877 | 22,35 | ||||
| 2026-04-20 | 13F | CWA Asset Management Group, LLC | 9.361 | -45,53 | 201 | -29,72 | ||||
| 2026-02-11 | 13F | Jpmorgan Chase & Co | Call | 12.100 | 202 | |||||
| 2026-02-17 | 13F | Parallax Volatility Advisers, L.P. | Put | 13.800 | 230 | |||||
| 2026-02-17 | 13F | Parallax Volatility Advisers, L.P. | 197.209 | 3.286 | ||||||
| 2026-02-17 | 13F | Parallax Volatility Advisers, L.P. | Call | 206.700 | -52,32 | 3.444 | -35,37 | |||
| 2026-02-13 | 13F | Barclays Plc | Call | 76.100 | 1.268 | |||||
| 2026-02-12 | 13F | BlackRock, Inc. | 212.781 | -5,39 | 3.545 | 28,22 | ||||
| 2026-02-18 | 13F | GWM Advisors LLC | 0 | -100,00 | 0 | |||||
| 2026-02-04 | 13F | Swiss Life Asset Management Ltd | 21.538 | 0,00 | 359 | 35,98 | ||||
| 2026-02-13 | 13F | American Century Companies Inc | 233.632 | -62,33 | 3.894 | -48,90 | ||||
| 2026-02-13 | 13F | Integrated Wealth Concepts LLC | 0 | -100,00 | 0 | -100,00 | ||||
| 2026-02-13 | 13F | Wells Fargo & Company/mn | 244.372 | 70,95 | 4.071 | 132,50 | ||||
| 2026-02-17 | 13F | Tower Research Capital LLC (TRC) | 4.566 | -28,46 | 76 | -2,56 | ||||
| 2026-01-29 | 13F | D.a. Davidson & Co. | 0 | -100,00 | 0 | |||||
| 2025-12-15 | 13F | FNY Investment Advisers, LLC | 0 | -100,00 | 0 | |||||
| 2026-01-23 | 13F | U.S. Capital Wealth Advisors, LLC | 0 | -100,00 | 0 | |||||
| 2026-04-20 | 13F | Kestra Private Wealth Services, Llc | 10.275 | -54,20 | 221 | -41,02 | ||||
| 2026-04-13 | 13F | E Fund Management Co., Ltd. | 17.806 | 382 | ||||||
| 2025-11-14 | 13F | Ionic Capital Management LLC | 0 | -100,00 | 0 | |||||
| 2026-02-12 | 13F | Financial Engines Advisors L.L.C. | 13.025 | 217 | ||||||
| 2026-01-27 | 13F | Regions Financial Corp | 0 | -100,00 | 0 | -100,00 | ||||
| 2026-01-30 | 13F | Sigma Planning Corp | 14.735 | -3,43 | 245 | 31,02 | ||||
| 2026-02-17 | 13F | Susquehanna Advisors Group, Inc. | 168.800 | 2.812 | ||||||
| 2025-11-12 | 13F | Creekmur Asset Management LLC | 2 | 0,00 | 0 | |||||
| 2026-02-17 | 13F | Two Sigma Securities, Llc | 15.077 | 32,07 | 251 | 79,29 | ||||
| 2026-02-10 | 13F | Connor, Clark & Lunn Investment Management Ltd. | 698.840 | -27,07 | 11.660 | -0,89 | ||||
| 2026-02-13 | 13F | Barclays Plc | 209.951 | -84,82 | 3.498 | -79,43 | ||||
| 2026-04-15 | 13F | Bayforest Capital Ltd | 8.276 | -71,96 | 178 | -63,95 | ||||
| 2026-04-01 | 13F | Confluence Investment Management Llc | 0 | -100,00 | 0 | |||||
| 2026-02-09 | 13F | Hartland & Co., LLC | 1.000 | -83,33 | 17 | -78,08 | ||||
| 2026-02-17 | 13F | Weiss Asset Management LP | 21.780 | 363 | ||||||
| 2026-02-09 | 13F | Strategic Financial Concepts, LLC | 10.111 | 168 | ||||||
| 2025-11-07 | 13F | Synovus Financial Corp | 36.554 | 0,00 | 449 | 48,68 | ||||
| 2026-01-21 | 13F | Sound Income Strategies, LLC | 844 | -71,87 | 18 | -56,10 | ||||
| 2026-04-22 | 13F | Capital Management Associates, Inc | 0 | -100,00 | 0 | |||||
| 2026-02-09 | 13F | Geode Capital Management, Llc | 299.956 | 18,06 | 5.111 | 62,87 | ||||
| 2026-04-17 | 13F | PKO Investment Management Joint-Stock Co | 222.706 | -6,62 | 4.764 | 19,49 | ||||
| 2026-02-11 | 13F | Strategic Advocates LLC | 1.857 | 0,00 | 31 | 40,91 | ||||
| 2026-04-24 | 13F | Acorn Financial Advisory Services Inc /adv | 899.840 | -1,73 | 19.329 | 26,70 | ||||
| 2026-02-10 | 13F | Foundations Investment Advisors, LLC | Call | 0 | -100,00 | 0 | -100,00 | |||
| 2026-02-18 | 13F/A | Empowered Funds, LLC | 33.236 | 111,59 | 554 | 186,53 | ||||
| 2026-04-16 | 13F | Five Pine Wealth Management | 17.678 | -32,21 | 380 | -12,67 | ||||
| 2026-02-12 | 13F | Hohimer Wealth Management, Llc | Call | 21.001 | 15 | |||||
| 2026-02-09 | 13F | Delta Asset Management Llc/tn | 2.400 | 0,00 | 40 | 34,48 | ||||
| 2026-02-12 | 13F | Jane Street Group, Llc | 3.127.940 | -38,74 | 52.111 | -16,67 | ||||
| 2026-02-12 | 13F | Hohimer Wealth Management, Llc | 318.244 | 24,90 | 5.302 | 69,31 | ||||
| 2026-02-12 | 13F | Jane Street Group, Llc | Call | 838.900 | 4,89 | 13.976 | 42,70 | |||
| 2026-02-13 | 13F | Parkside Financial Bank & Trust | 100 | 2 | ||||||
| 2026-02-12 | 13F | Jane Street Group, Llc | Put | 1.082.400 | 115,36 | 18.033 | 192,97 | |||
| 2025-11-13 | 13F | Jump Financial, LLC | 0 | -100,00 | 0 | |||||
| 2026-02-12 | 13F | Marex Group plc | 14.598 | -52,42 | 243 | -35,54 | ||||
| 2026-02-11 | 13F | Erste Asset Management GmbH | 83.459 | 175,32 | 1.394 | 271,47 | ||||
| 2026-04-16 | 13F | Lincoln Capital Corp | 70.150 | 0,00 | 1.507 | 28,94 | ||||
| 2026-01-26 | 13F | Cwm, Llc | 3.818 | 9,27 | 0 | |||||
| 2026-02-06 | 13F/A | Rathbone Brothers plc | 111.460 | 29,17 | 1.860 | 75,38 | ||||
| 2026-02-17 | 13F | Qube Research & Technologies Ltd | 138.566 | 2.309 | ||||||
| 2026-04-15 | 13F | Cypress Wealth Services, LLC | 10.534 | -28,98 | 226 | -8,50 | ||||
| 2026-04-01 | 13F | Burkett Financial Services, Llc | 1.333 | 0,00 | 29 | 27,27 | ||||
| 2026-02-10 | 13F | IAG Wealth Partners, LLC | 765 | 0,00 | 13 | 33,33 | ||||
| 2026-02-12 | 13F | StoneX Group Inc. | 0 | -100,00 | 0 | |||||
| 2026-02-13 | 13F | Walleye Trading LLC | Put | 1.009.700 | -9,79 | 16.822 | 22,28 | |||
| 2026-01-16 | 13F | Trust Co Of Vermont | 2.610 | 43 | ||||||
| 2026-02-13 | 13F | Walleye Trading LLC | Call | 1.208.400 | -27,77 | 20.132 | -2,10 | |||
| 2026-02-12 | 13F | Hrt Financial Lp | 61.100 | 1 | ||||||
| 2026-02-17 | 13F | Stansberry Asset Management, Llc | 30.205 | 503 | ||||||
| 2026-02-17 | 13F | Public Employees Retirement System Of Ohio | 125.102 | -4,05 | 2.090 | 30,81 | ||||
| 2026-02-06 | 13F | Municipal Employees' Retirement System of Michigan | 0 | -100,00 | 0 | -100,00 | ||||
| 2026-02-10 | 13F | Envestnet Asset Management Inc | 0 | -100,00 | 0 | |||||
| 2026-02-13 | 13F | Walleye Trading LLC | 259.402 | -8,80 | 4.322 | 23,63 | ||||
| 2026-02-23 | 13F | Beaird Harris Wealth Management, LLC | 1.327 | 0,00 | 22 | 37,50 | ||||
| 2026-02-10 | 13F | Td Asset Management Inc | 1.972.672 | -1,78 | 32.956 | 33,59 | ||||
| 2026-02-12 | 13F | Colonial Trust Advisors | 100 | 2 | ||||||
| 2026-02-06 | 13F | Larson Financial Group LLC | 36 | 1 | ||||||
| 2026-04-22 | 13F | Louisbourg Investments Inc. | 279.600 | 5.982 | ||||||
| 2025-11-13 | 13F | FORA Capital, LLC | 0 | -100,00 | 0 | -100,00 | ||||
| 2025-11-14 | 13F | Nomura Holdings Inc | 0 | -100,00 | 0 | -100,00 | ||||
| 2026-02-19 | 13F | Mcguire Capital Advisors Inc | 300 | 5 | ||||||
| 2026-02-17 | 13F | Alliancebernstein L.p. | 57.699 | 0,00 | 961 | 35,54 | ||||
| 2025-10-27 | 13F | Kiker Wealth Management, LLC | 0 | -100,00 | 0 | -100,00 | ||||
| 2025-11-14 | 13F | DRW Securities, LLC | 0 | -100,00 | 0 | |||||
| 2026-02-05 | 13F | Navalign, LLC | 179 | 3 | ||||||
| 2026-02-12 | 13F | Federation des caisses Desjardins du Quebec | 553.001 | 21,43 | 9.195 | 64,74 | ||||
| 2026-04-21 | 13F | Abbington Investment Group | 181.047 | -12,58 | 3.889 | 12,70 | ||||
| 2025-11-13 | 13F | Macquarie Group Ltd | 0 | -100,00 | 0 | -100,00 | ||||
| 2026-02-13 | 13F | Pathstone Holdings, LLC | 12.282 | -66,16 | 205 | -54,16 | ||||
| 2026-02-17 | 13F | Cantor Fitzgerald, L. P. | 0 | -100,00 | 0 | -100,00 | ||||
| 2026-02-11 | 13F | Twin Tree Management, LP | 148.726 | 76,72 | 2.478 | 139,56 | ||||
| 2026-02-17 | 13F | Advisory Services Network, LLC | 0 | -100,00 | 0 | -100,00 | ||||
| 2026-04-08 | 13F | Wealth Enhancement Trust Services, Inc. | 5.060 | -46,87 | 109 | -31,65 | ||||
| 2026-02-12 | 13F | Skopos Labs, Inc. | 65.427 | 1.093 | ||||||
| 2026-02-12 | 13F | Dimensional Fund Advisors Lp | 3.028.487 | 10,96 | 50.463 | 50,42 | ||||
| 2026-02-17 | 13F | Voloridge Investment Management, Llc | 695.808 | 11.592 | ||||||
| 2026-01-23 | 13F | Rsm Us Wealth Management Llc | 72.628 | 1,70 | 1.230 | 40,14 | ||||
| 2026-01-27 | 13F | TD Waterhouse Canada Inc. | 23.313 | -12,71 | 388 | 18,35 | ||||
| 2026-04-16 | 13F | SG Americas Securities, LLC | 477.063 | 263,43 | 10 | 400,00 |