Grundlæggende statistik
| Institutionelle ejere | 456 total, 413 long only, 7 short only, 36 long/short - change of -3,98% MRQ |
| Gennemsnitlig porteføljeallokering | 0.0474 % - change of -67,22% MRQ |
| Institutionelle aktier (lange) | 318.730.657 (ex 13D/G) - change of 5,21MM shares 1,66% MRQ |
| Institutionel værdi (lang) | $ 1.529.993 USD ($1000) |
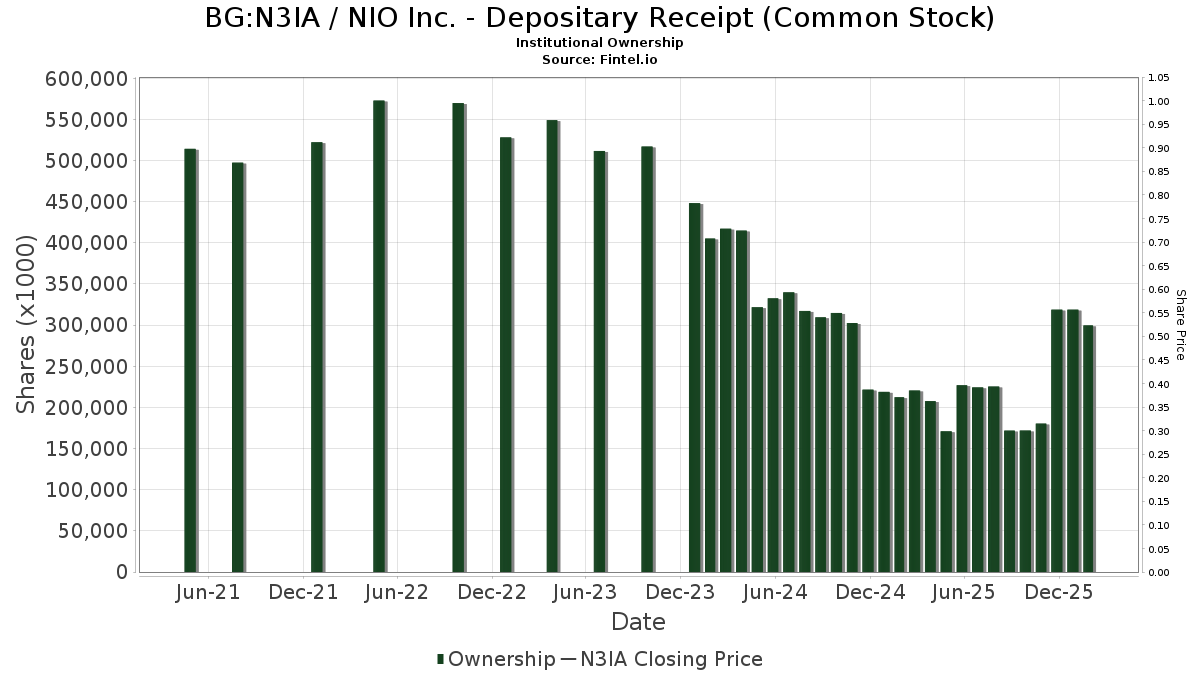
Institutionelt ejerskab og aktionærer
NIO Inc. - Depositary Receipt (Common Stock) (BG:N3IA) har 456 institutionelle ejere og aktionærer, der har indsendt 13D/G- eller 13F-formularer til Securities Exchange Commission (SEC). Disse institutioner har i alt 318,730,657 aktier. Største aktionærer omfatter D. E. Shaw & Co., Inc., Susquehanna International Group, Llp, UBS Group AG, LMR Partners LLP, Bnp Paribas Arbitrage, Sa, Wolverine Asset Management Llc, Jane Street Group, Llc, Morgan Stanley, Goldman Sachs Group Inc, and Voloridge Investment Management, Llc .
NIO Inc. - Depositary Receipt (Common Stock) (BUL:N3IA) institutionel ejerskabsstruktur viser aktuelle positioner i virksomheden efter institutioner og fonde, samt seneste ændringer i positionsstørrelse. Større aktionærer kan omfatte individuelle investorer, investeringsforeninger, hedgefonde eller institutioner. Skema 13D angiver, at investoren besidder (eller besidder) mere end 5 % af virksomheden og har til hensigt (eller har til hensigt at) aktivt at forfølge en ændring i forretningsstrategi. Skema 13G indikerer en passiv investering på over 5%.
Fondens stemningsscore
Fund Sentiment Score (fka Ownership Accumulation Score) finder de aktier, der bliver mest købt af fonde. Det er resultatet af en sofistikeret, multi-faktor kvantitativ model, der identificerer virksomheder med de højeste niveauer af institutionel akkumulering. Scoringsmodellen bruger en kombination af den samlede stigning i oplyste ejere, ændringerne i porteføljeallokeringer i disse ejere og andre målinger. Tallet går fra 0 til 100, hvor højere tal indikerer et højere niveau af akkumulering for sine jævnaldrende, og 50 er gennemsnittet.
Opdateringsfrekvens: Dagligt
Se Ownership Explorer, som giver en liste over højest rangerende virksomheder.
AI+ Ask Fintel’s AI assistant about NIO Inc. - Depositary Receipt (Common Stock).
Select a question to share a public post with an AI-crafted answer.
Thinking of good questions…
13F og NPORT arkivering
Detaljer om 13F-arkivering er gratis. Detaljer om NP-ansøgninger kræver et premium-medlemskab. Grønne rækker angiver nye positioner. Røde rækker angiver lukkede positioner. Klik på linket ikon for at se den fulde transaktionshistorik.
Opgrader
for at låse premium-data op og eksportere til Excel ![]() .
.
| Fil dato | Kilde | Investor | Type | Gennemsnitlig pris (Øst) |
Aktier | Δ Aktier (%) |
Rapporteret Værdi ($1000) |
Δ Værdi (%) |
Port Alloc (%) |
|
|---|---|---|---|---|---|---|---|---|---|---|
| 2026-02-17 | 13F | ExodusPoint Capital Management, LP | 0 | -100,00 | 0 | -100,00 | ||||
| 2026-02-13 | 13F | Mariner, LLC | 129.263 | 39,69 | 663 | -6,10 | ||||
| 2026-04-07 | 13F | Eastern Bank | 156 | 0,00 | 1 | |||||
| 2026-02-10 | 13F | WCG Wealth Advisors LLC | 55.549 | 6,21 | 283 | -28,89 | ||||
| 2026-02-18 | 13F | Onyx Bridge Wealth Group LLC | 10.733 | -0,03 | 55 | -33,33 | ||||
| 2026-01-27 | 13F | Zurcher Kantonalbank (Zurich Cantonalbank) | 28.024 | 4,21 | 143 | -30,39 | ||||
| 2026-04-07 | 13F | Hoffman, Alan N Investment Management | 75.708 | 531,32 | 457 | 647,54 | ||||
| 2026-02-06 | 13F | Covestor Ltd | 2.529 | 0,00 | 0 | |||||
| 2026-02-10 | 13F | Eurizon Capital SGR S.p.A. | 8.125 | 41 | ||||||
| 2026-02-12 | 13F | Marex Group plc | 208.223 | 45,45 | 1.062 | -2,66 | ||||
| 2026-02-17 | 13F | Millennium Management Llc | Call | 373.700 | 282,11 | 1.906 | 155,70 | |||
| 2026-01-29 | 13F | Calamos Advisors LLC | 56.190 | 0,00 | 287 | -33,18 | ||||
| 2026-02-17 | 13F | Advisor Group Holdings, Inc. | 116.377 | -6,05 | 594 | -31,05 | ||||
| 2026-02-17 | 13F | Millennium Management Llc | Put | 10.554.700 | 43,60 | 53.829 | -3,89 | |||
| 2026-02-12 | 13F | Triumph Capital Management | 400 | 0,00 | 2 | -33,33 | ||||
| 2026-02-17 | 13F | Millennium Management Llc | 758.339 | 162,04 | 3.868 | 75,37 | ||||
| 2025-11-12 | 13F | Transce3nd, LLC | 0 | -100,00 | 0 | |||||
| 2026-02-12 | 13F | Laurel Oak Wealth Management, Llc | 10.291 | 52 | ||||||
| 2026-01-14 | 13F | Tradewinds Capital Management, LLC | 357 | -21,88 | 2 | -66,67 | ||||
| 2026-01-16 | 13F | Trust Co Of Vermont | 1.000 | 0,00 | 5 | -28,57 | ||||
| 2026-02-13 | 13F | Marshall Wace, Llp | Put | 0 | -100,00 | 0 | -100,00 | |||
| 2026-02-02 | 13F | Wolverine Asset Management Llc | Put | 19.862.900 | -7,88 | 101.301 | -38,35 | |||
| 2026-02-05 | 13F | Allworth Financial LP | 6.558 | -0,58 | 33 | -34,00 | ||||
| 2026-03-02 | 13F | Reflection Asset Management | 1.100 | 5 | ||||||
| 2026-02-03 | 13F | Harel Insurance Investments & Financial Services Ltd. | 6.673 | 0,00 | 0 | |||||
| 2026-02-11 | 13F | MCF Advisors LLC | 20.884 | -54,77 | 107 | -69,80 | ||||
| 2025-11-03 | 13F | J. Safra Sarasin Holding AG | 0 | -100,00 | 0 | -100,00 | ||||
| 2026-01-22 | 13F | Bartlett & Co. Wealth Management Llc | 50 | 0,00 | 0 | |||||
| 2026-02-12 | 13F | Fortress Private Ledger, Llc | 37.177 | 0,27 | 190 | -32,98 | ||||
| 2026-02-27 | 13F | Strategic Investment Solutions, Inc. /IL | 0 | -100,00 | 0 | |||||
| 2026-02-13 | 13F | Caitong International Asset Management Co., Ltd | 6.463 | -84,94 | 33 | -90,21 | ||||
| 2026-02-04 | 13F | LRI Investments, LLC | 100 | 0,00 | 1 | |||||
| 2026-01-22 | 13F | V-Square Quantitative Management LLC | 11.680 | 60 | ||||||
| 2026-02-02 | 13F | Fifth Third Bancorp | 77 | -72,20 | 0 | -100,00 | ||||
| 2026-02-10 | 13F | JTC Employer Solutions Trusteee Ltd | 27.400 | 0,00 | 0 | |||||
| 2026-02-13 | 13F | Acumen Wealth Advisors, LLC | 300 | 2 | ||||||
| 2025-11-14 | 13F | Wetherby Asset Management Inc | 72.710 | 25,61 | 554 | 179,80 | ||||
| 2026-04-02 | 13F | Ares Financial Consulting, LLC | 1.500 | 9 | ||||||
| 2026-02-12 | 13F | Wedbush Securities Inc | 10.742 | -3,59 | 0 | |||||
| 2026-01-22 | 13F | Glass Jacobson Investment Advisors llc | 1.500 | 0,00 | 8 | -36,36 | ||||
| 2026-02-02 | 13F | Sachetta, LLC | 1.000 | 0,00 | 5 | -28,57 | ||||
| 2026-02-17 | 13F | Paloma Partners Management Co | 0 | -100,00 | 0 | -100,00 | ||||
| 2026-01-29 | 13F | St Germain D J Co Inc | 100 | 0,00 | 1 | |||||
| 2026-02-17 | 13F | Hilltop Holdings Inc. | 130.509 | 666 | ||||||
| 2026-02-11 | 13F | Bradley & Co. Private Wealth Management, LLC | 9 | 0 | ||||||
| 2026-02-10 | 13F | Basepoint Wealth LLC | 125 | 1 | ||||||
| 2026-02-17 | 13F | Lighthouse Investment Partners, LLC | 248.461 | -36,93 | 1.267 | -57,79 | ||||
| 2026-01-28 | 13F | DekaBank Deutsche Girozentrale | 1.301.518 | 0,00 | 9 | -11,11 | ||||
| 2025-10-27 | 13F | First Horizon Corp | 0 | -100,00 | 0 | |||||
| 2026-02-06 | 13F | Delap Wealth Advisory, Llc | 34.225 | 0,00 | 175 | -33,33 | ||||
| 2026-02-10 | 13F | Root Financial Partners, LLC | 1.026 | 1,58 | 5 | -28,57 | ||||
| 2026-01-23 | 13F | Clarity Wealth Advisors, LLC | 11.500 | 0,00 | 59 | -33,33 | ||||
| 2026-02-13 | 13F/A | Alberta Investment Management Corp | 0 | -100,00 | 0 | -100,00 | ||||
| 2026-02-03 | 13F | Redwood Wealth Management Group, LLC | 61.345 | -6,75 | 313 | -37,72 | ||||
| 2026-02-13 | 13F | Ieq Capital, Llc | 18.265 | -12,31 | 93 | -41,14 | ||||
| 2025-11-14 | 13F | Wood Tarver Financial Group, LLC | 0 | -100,00 | 0 | |||||
| 2026-02-04 | 13F | Hallmark Capital Management Inc | 819 | 4 | ||||||
| 2026-01-21 | 13F | Newbridge Financial Services Group, Inc. | 5.500 | 0,00 | 28 | -31,71 | ||||
| 2026-02-13 | 13F | Golden State Wealth Management, LLC | 641 | 0,00 | 3 | -25,00 | ||||
| 2025-11-12 | 13F | Neuberger Berman Group LLC | 0 | -100,00 | 0 | |||||
| 2026-02-12 | 13F | Brown Brothers Harriman & Co | 237 | 0,00 | 1 | 0,00 | ||||
| 2026-02-10 | 13F | KERR FINANCIAL PLANNING Corp | 1.214 | 0,41 | 6 | -28,57 | ||||
| 2026-02-13 | 13F | Morgan Stanley | 15.269.286 | -5,55 | 77.873 | -36,78 | ||||
| 2026-02-10 | 13F | Baker Avenue Asset Management, LP | 552.972 | -1,15 | 2.820 | -33,83 | ||||
| 2026-02-17 | 13F | Equitable Holdings, Inc. | 26.543 | -49,03 | 135 | -65,91 | ||||
| 2026-04-10 | 13F | Quaker Wealth Management, LLC | 1.000 | 6 | ||||||
| 2026-02-02 | 13F | Qrg Capital Management, Inc. | 24.726 | 12,59 | 126 | -24,55 | ||||
| 2026-01-29 | 13F | Nbc Securities, Inc. | 100 | 0,00 | 1 | |||||
| 2025-10-17 | 13F | Annex Advisory Services, LLC | 0 | -100,00 | 0 | -100,00 | ||||
| 2026-01-26 | 13F | PFG Investments, LLC | 77.285 | 7,84 | 394 | -27,84 | ||||
| 2026-02-13 | 13F | Centerpoint Advisors, LLC | 250 | 0,00 | 0 | |||||
| 2026-02-03 | 13F | We Are One Seven, LLC | 40.467 | 149,67 | 206 | 67,48 | ||||
| 2026-01-14 | 13F | Spire Wealth Management | 3.400 | 0,00 | 17 | -32,00 | ||||
| 2026-01-20 | 13F | SOA Wealth Advisors, LLC. | 30.415 | 30 | ||||||
| 2026-02-12 | 13F | Jane Street Group, Llc | Put | 10.566.400 | -19,27 | 53.889 | -45,97 | |||
| 2026-02-12 | 13F | Jane Street Group, Llc | Call | 5.639.500 | -23,49 | 28.761 | -48,79 | |||
| 2026-02-18 | 13F | Garton & Associates Financial Advisors LLC | 500 | 3 | ||||||
| 2026-02-12 | 13F | Jane Street Group, Llc | 19.532.583 | 1,56 | 99.616 | -32,03 | ||||
| 2026-01-16 | 13F | Compagnie Lombard Odier SCmA | 15.393 | -2,36 | 79 | -35,00 | ||||
| 2026-02-11 | 13F | First Command Advisory Services, Inc. | 0 | -100,00 | 0 | |||||
| 2026-02-13 | 13F | Centiva Capital, LP | 183.089 | -67,73 | 934 | -78,42 | ||||
| 2026-02-05 | 13F | May Hill Capital, LLC | 16.072 | 82 | ||||||
| 2026-02-13 | 13F | Centiva Capital, LP | Put | 500.000 | 2.550 | |||||
| 2026-02-17 | 13F | Optiver Holding B.V. | 157 | 1 | ||||||
| 2026-02-02 | 13F | PKO Investment Management Joint-Stock Co | 60.000 | 306 | ||||||
| 2026-02-05 | 13F | Abacus Wealth Partners, LLC | 52.909 | 270 | ||||||
| 2026-01-12 | 13F | Traynor Capital Management, Inc. | Call | 93.500 | 0,00 | 477 | -33,15 | |||
| 2026-01-29 | 13F | Rakuten Securities, Inc. | 530 | 0,00 | 3 | -50,00 | ||||
| 2026-02-17 | 13F | Wealth Watch Advisors, INC | 0 | -100,00 | 0 | |||||
| 2025-10-30 | 13F | Ridgewood Investments LLC | 0 | -100,00 | 0 | -100,00 | ||||
| 2026-01-12 | 13F | Traynor Capital Management, Inc. | 17.105 | 42,28 | 87 | -4,40 | ||||
| 2026-02-13 | 13F | Sterling Capital Management LLC | 0 | -100,00 | 0 | |||||
| 2026-02-17 | 13F | Advisory Services Network, LLC | 22.453 | 127,40 | 115 | 52,00 | ||||
| 2026-02-06 | 13F/A | Rathbone Brothers plc | 183.978 | -0,26 | 938 | -33,24 | ||||
| 2025-11-14 | 13F | Wolverine Trading, Llc | Call | 1.809.400 | 105,85 | 13.046 | 328,97 | |||
| 2025-11-14 | 13F | Virtu Financial LLC | 0 | -100,00 | 0 | |||||
| 2025-11-14 | 13F | Wolverine Trading, Llc | Put | 1.043.400 | 47,31 | 7.523 | 207,02 | |||
| 2026-01-28 | 13F | Atwood & Palmer Inc | 175 | 0,00 | 1 | -100,00 | ||||
| 2026-02-06 | 13F | EverSource Wealth Advisors, LLC | 3.632 | 52,35 | 19 | 0,00 | ||||
| 2026-02-13 | 13F | Clear Street Group Inc. | 176.137 | 898 | ||||||
| 2026-01-22 | 13F | Financial Consulate, Inc | 596 | 9,76 | 3 | -25,00 | ||||
| 2026-01-14 | 13F | Jfs Wealth Advisors, Llc | 75 | -86,96 | 0 | -100,00 | ||||
| 2026-01-26 | 13F | PDS Planning, Inc | 17.672 | -14,10 | 90 | -42,31 | ||||
| 2026-02-17 | 13F | Voloridge Investment Management, Llc | 13.498.709 | 14,35 | 68.843 | -23,47 | ||||
| 2026-02-13 | 13F | Kestra Advisory Services, LLC | 35.005 | 9,33 | 179 | -26,75 | ||||
| 2026-02-17 | 13F | J. Goldman & Co LP | Call | 150.000 | 765 | |||||
| 2026-02-13 | 13F | Resources Investment Advisors, LLC. | 13.050 | -28,16 | 67 | -52,17 | ||||
| 2026-02-17 | 13F | J. Goldman & Co LP | Put | 22.900 | -97,14 | 117 | -98,10 | |||
| 2026-01-29 | 13F | Camelot Portfolios, LLC | 8 | 0 | ||||||
| 2026-02-17 | 13F | Hbk Investments L P | Put | 602.500 | 0,00 | 3.073 | -33,09 | |||
| 2026-01-22 | 13F | Maseco Llp | 436 | 0,00 | 2 | -33,33 | ||||
| 2026-02-17 | 13F | Hbk Investments L P | 350.648 | 4,75 | 1.788 | -29,88 | ||||
| 2025-11-14 | 13F | Wolverine Trading, Llc | 184.029 | -54,56 | 1.327 | -5,35 | ||||
| 2026-02-02 | 13F | Oppenheimer & Co Inc | 84.936 | -0,55 | 433 | -33,38 | ||||
| 2026-02-10 | 13F | Foundations Investment Advisors, LLC | 12.852 | 66 | ||||||
| 2026-02-19 | 13F | Atomi Financial Group, Inc. | 41.449 | 12,85 | 211 | -24,37 | ||||
| 2025-10-14 | 13F | Generali Investments CEE, investicni spolecnost, a.s. | 0 | -100,00 | 0 | -100,00 | ||||
| 2026-02-13 | 13F | Panagora Asset Management Inc | 24.129 | 0,00 | 123 | -32,79 | ||||
| 2026-02-10 | 13F | Lido Advisors, LLC | 30.855 | 6,53 | 230 | 4,55 | ||||
| 2026-01-22 | 13F | Bfsg, Llc | 3.090 | 0,00 | 16 | -34,78 | ||||
| 2026-02-17 | 13F | Brevan Howard Capital Management LP | Call | 0 | -100,00 | 0 | -100,00 | |||
| 2026-01-16 | 13F | Standard Life Aberdeen plc | 12.837 | -11,34 | 65 | -37,50 | ||||
| 2026-01-30 | 13F | Turning Point Benefit Group, Inc. | 469 | 0,00 | 2 | -33,33 | ||||
| 2026-02-11 | 13F | Simplex Trading, Llc | Call | 9.741.900 | -3,58 | 49.684 | 65.272,37 | |||
| 2026-01-30 | 13F | American Capital Advisory, LLC | 29 | 0,00 | 0 | |||||
| 2026-02-03 | 13F | Mitsubishi UFJ Kokusai Asset Management Co., Ltd. | 375.103 | -31,58 | 1.928 | -53,84 | ||||
| 2026-02-10 | 13F | Acadian Asset Management Llc | 68.848 | -26,17 | 0 | |||||
| 2026-02-17 | 13F | Tower Research Capital LLC (TRC) | 133.832 | 572,69 | 683 | 351,66 | ||||
| 2026-01-21 | 13F | SJS Investment Consulting Inc. | 20 | 0,00 | 0 | |||||
| 2026-02-14 | 13F | Rockefeller Capital Management L.P. | 47.303 | -42,73 | 241 | -61,69 | ||||
| 2026-04-08 | 13F | Wealth Enhancement Advisory Services, Llc | 0 | -100,00 | 0 | |||||
| 2025-10-15 | 13F | Financial Management Professionals, Inc. | 0 | -100,00 | 0 | |||||
| 2026-01-27 | 13F | BankPlus Trust Department | 10 | 0,00 | 0 | |||||
| 2026-02-13 | 13F | MAI Capital Management | 4.422 | 205,60 | 23 | 100,00 | ||||
| 2026-02-13 | 13F | Marathon Trading Investment Management LLC | Call | 30.100 | -71,39 | 154 | -80,90 | |||
| 2026-02-13 | 13F | Marathon Trading Investment Management LLC | Put | 49.900 | 0,00 | 254 | -33,16 | |||
| 2026-02-13 | 13F | Marathon Trading Investment Management LLC | 199.321 | 1.017 | ||||||
| 2026-01-30 | 13F | North Star Investment Management Corp. | 4.302 | 2,43 | 22 | -34,37 | ||||
| 2026-02-03 | 13F | Legacy Wealth Managment, LLC/ID | 0 | -100,00 | 0 | -100,00 | ||||
| 2026-02-12 | 13F | Quadrant Capital Group Llc | 146.254 | 0,78 | 746 | -32,58 | ||||
| 2026-01-15 | 13F | Cobblestone Asset Management LLC | 90.748 | 1,34 | 463 | -32,26 | ||||
| 2026-01-14 | 13F | Wolff Wiese Magana Llc | 1.262 | 0,00 | 6 | -33,33 | ||||
| 2026-01-26 | 13F | Prosperity Financial Group, Inc. | Call | 7.500 | 0,00 | 38 | -33,33 | |||
| 2025-11-14 | 13F | Main Management ETF Advisors, LLC | 0 | -100,00 | 0 | |||||
| 2026-01-26 | 13F | Prosperity Financial Group, Inc. | 24.400 | 0,00 | 124 | -32,97 | ||||
| 2026-02-17 | 13F | Cape Investment Advisory, Inc. | 540 | 66,67 | 3 | 0,00 | ||||
| 2026-02-06 | 13F | Leonteq Securities AG | Call | 0 | -100,00 | 0 | -100,00 | |||
| 2026-02-13 | 13F | Rafferty Asset Management, LLC | 0 | -100,00 | 0 | -100,00 | ||||
| 2026-02-13 | 13F | Y-Intercept (Hong Kong) Ltd | 476.759 | -4,71 | 2.431 | -36,23 | ||||
| 2026-04-03 | 13F | Investors Research Corp | 160 | 0,00 | 1 | |||||
| 2026-02-17 | 13F | Boothbay Fund Management, Llc | 88.160 | 7,50 | 450 | -28,04 | ||||
| 2026-01-22 | 13F | Harwood Advisory Group, LLC | 135 | 0,00 | 1 | -100,00 | ||||
| 2026-02-17 | 13F | Weiss Asset Management LP | 595 | 0,00 | 3 | -25,00 | ||||
| 2026-02-17 | 13F | Weiss Asset Management LP | Put | 1.000.000 | 0,00 | 5.100 | -33,07 | |||
| 2026-02-26 | 13F/A | Sculptor Capital LP | 0 | -100,00 | 0 | -100,00 | ||||
| 2026-02-18 | 13F | GWM Advisors LLC | 525 | 23,53 | 3 | -33,33 | ||||
| 2025-10-27 | 13F | Kiker Wealth Management, LLC | 0 | -100,00 | 0 | |||||
| 2026-02-11 | 13F | Simplex Trading, Llc | Put | 4.383.000 | -36,60 | 22.353 | 42.886,54 | |||
| 2026-02-11 | 13F | Simplex Trading, Llc | 659.692 | -38,95 | 3.364 | 41.950,00 | ||||
| 2026-02-12 | 13F | Johnson Financial Group, Inc. | 0 | -100,00 | 0 | |||||
| 2025-11-14 | 13F | Ossiam | 0 | -100,00 | 0 | -100,00 | ||||
| 2026-02-17 | 13F | Balyasny Asset Management Llc | 360.037 | 86,69 | 1.836 | 24,98 | ||||
| 2026-01-23 | 13F | Brown, Lisle/cummings, Inc. | 1.200 | 0,00 | 6 | -33,33 | ||||
| 2026-02-17 | 13F | Balyasny Asset Management Llc | Call | 508.200 | 3,21 | 2.592 | -30,94 | |||
| 2026-02-03 | 13F | Crossmark Global Holdings, Inc. | 40.066 | 0,12 | 204 | -32,89 | ||||
| 2026-02-11 | 13F | West Family Investments, Inc. | 41.921 | -3,28 | 214 | -35,45 | ||||
| 2026-02-17 | 13F | Balyasny Asset Management Llc | Put | 17.800 | 0,00 | 91 | -33,33 | |||
| 2026-01-30 | 13F | Oakworth Capital, Inc. | 80 | 0,00 | 0 | |||||
| 2026-02-11 | 13F | Paces Ferry Wealth Advisors, Llc | 20.155 | 0,00 | 103 | -33,33 | ||||
| 2026-02-06 | 13F | Lloyd Advisory Services, LLC. | 256 | 1 | ||||||
| 2026-02-11 | 13F | Franklin Resources Inc | 12.266 | 0,00 | 63 | -33,33 | ||||
| 2026-02-17 | 13F | Schonfeld Strategic Advisors LLC | 0 | -100,00 | 0 | -100,00 | ||||
| 2026-02-10 | 13F | Skaana Management L.P. | Call | 5.000 | 0,00 | 26 | -34,21 | |||
| 2026-02-05 | 13F | Thrivent Financial For Lutherans | 14.820 | 0,00 | 0 | |||||
| 2025-11-20 | 13F | First Affirmative Financial Network | 12.057 | -21,28 | 92 | 75,00 | ||||
| 2026-02-13 | 13F | Barclays Plc | Call | 1.700.000 | 0,00 | 8.670 | -33,07 | |||
| 2026-02-13 | 13F | State Street Corp | 4.400.676 | -11,69 | 22.443 | -40,90 | ||||
| 2026-02-13 | 13F | Barclays Plc | Put | 1.012.500 | -22,12 | 5.164 | -47,88 | |||
| 2026-02-17 | 13F | Magnetar Financial LLC | 10.508 | 54 | ||||||
| 2026-02-13 | 13F | Barclays Plc | 1.609.237 | 90,82 | 8.207 | 27,72 | ||||
| 2026-02-13 | 13F | Evelyn Partners Investment Management (Europe) Ltd | 5.000 | 0,00 | 26 | -34,21 | ||||
| 2026-01-27 | 13F | TD Waterhouse Canada Inc. | 24.884 | 11,60 | 127 | -25,88 | ||||
| 2026-02-13 | 13F | SRS Capital Advisors, Inc. | 7.758 | 81,64 | 40 | 21,88 | ||||
| 2026-01-27 | 13F | Bayforest Capital Ltd | 63.507 | 324 | ||||||
| 2026-02-03 | 13F | Strengthening Families & Communities, LLC | 625 | 47,06 | 3 | 50,00 | ||||
| 2026-01-16 | 13F | FNY Investment Advisers, LLC | 175.000 | 1 | ||||||
| 2026-01-21 | 13F | Trueblood Wealth Management, LLC | 19.412 | 35,21 | 99 | -9,17 | ||||
| 2026-01-29 | 13F | Pictet Asset Management Holding SA | 0 | -100,00 | 0 | |||||
| 2026-02-13 | 13F | Squarepoint Ops LLC | Call | 2.477.100 | 899,23 | 12.633 | 569,12 | |||
| 2026-02-13 | 13F | Squarepoint Ops LLC | Put | 1.141.700 | 813,36 | 5.823 | 511,55 | |||
| 2026-02-03 | 13F | Vantage Financial Partners, LLC | 10.834 | 0,00 | 55 | -32,93 | ||||
| 2026-02-17 | 13F | Signature Equity Partners, LLC | 1.440 | 7 | ||||||
| 2026-01-27 | 13F | Evergreen Capital Management Llc | 11.152 | -1,08 | 57 | -34,12 | ||||
| 2026-04-09 | 13F | Pacifica Partners Inc. | 25 | 0,00 | 0 | |||||
| 2026-02-17 | 13F | Marathon Asset Management Lp | 200.000 | 0,00 | 940 | -38,32 | ||||
| 2025-10-16 | 13F | Kingstone Capital Partners Texas, LLC | 0 | -100,00 | 0 | -100,00 | ||||
| 2026-01-30 | 13F | Us Bancorp \de\ | 131.025 | 4,50 | 668 | -30,05 | ||||
| 2026-02-17 | 13F | XTX Topco Ltd | 220.765 | 15,54 | 1.126 | -22,68 | ||||
| 2026-02-06 | 13F | Global Retirement Partners, LLC | 2.048 | 0,00 | 10 | -33,33 | ||||
| 2026-02-17 | 13F | Fmr Llc | 111.268 | -69,74 | 567 | -79,76 | ||||
| 2026-02-17 | 13F | Two Sigma Advisers, Lp | 5.499.400 | 84,56 | 28.047 | 23,52 | ||||
| 2026-04-02 | 13F | Aspect Partners, LLC | 1.131 | 0,00 | 7 | 20,00 | ||||
| 2026-02-06 | 13F | Gsa Capital Partners Llp | 0 | -100,00 | 0 | |||||
| 2026-02-05 | 13F | Tucker Asset Management Llc | 30 | 0 | ||||||
| 2026-02-04 | 13F | Meridian Wealth Management, LLC | 88.787 | -0,72 | 453 | -33,63 | ||||
| 2026-02-17 | 13F | Ghisallo Capital Management LLC | 8.000.000 | -33,33 | 40.800 | -55,38 | ||||
| 2026-01-21 | 13F | Sound Income Strategies, LLC | 10 | 100,00 | 0 | |||||
| 2026-02-05 | 13F | Cambridge Investment Research Advisors, Inc. | 196.624 | 100,67 | 1 | |||||
| 2026-02-13 | 13F | Pinpoint Asset Management (Singapore) Pte. Ltd. | 139.176 | 710 | ||||||
| 2026-02-17 | 13F | Elequin Capital Lp | 1.586 | 8 | ||||||
| 2026-02-17 | 13F | Jones Financial Companies Lllp | 39.475 | 44,82 | 201 | 5,24 | ||||
| 2026-01-23 | 13F | Assetmark, Inc | 1.044 | 72,28 | 5 | 25,00 | ||||
| 2025-11-12 | 13F/A | Norges Bank | 1.770.372 | 11.826 | ||||||
| 2026-02-17 | 13F | DZ BANK AG Deutsche Zentral Genossenschafts Bank, Frankfurt am Main | 116.389 | 77,61 | 613 | 24,90 | ||||
| 2026-02-17 | 13F | Royal Bank Of Canada | 87.811 | -84,01 | 448 | -89,30 | ||||
| 2025-11-10 | 13F | Raiffeisen Bank International AG | 0 | -100,00 | 0 | -100,00 | ||||
| 2026-02-03 | 13F | Sequoia Financial Advisors, LLC | 21.075 | -12,17 | 107 | -41,21 | ||||
| 2026-02-10 | 13F | Winthrop Capital Management, LLC | 174 | 0,00 | 0 | |||||
| 2026-01-12 | 13F | Seacrest Wealth Management, Llc | 10.368 | -2,81 | 50 | -40,96 | ||||
| 2026-02-06 | 13F | Leonteq Securities AG | Put | 4.500 | 23 | |||||
| 2026-02-06 | 13F | Leonteq Securities AG | 903.472 | 315,95 | 4.608 | 178,37 | ||||
| 2026-02-05 | 13F | Berman McAleer LLC | 25.000 | 0,00 | 128 | -33,16 | ||||
| 2026-02-17 | 13F | Bayesian Capital Management, LP | 0 | -100,00 | 0 | |||||
| 2026-02-06 | 13F | Cascade Financial Partners, LLC | 12.048 | 61 | ||||||
| 2026-02-12 | 13F | Callan Family Office, LLC | 19.742 | 101 | ||||||
| 2026-01-30 | 13F | Urban Wealth Management, LLC | 0 | -100,00 | 0 | -100,00 | ||||
| 2026-02-24 | 13F | Bell Investment Advisors, Inc | 1.068 | 7.020,00 | 5 | |||||
| 2026-01-20 | 13F | Princeton Global Asset Management LLC | 250 | 0,00 | 1 | 0,00 | ||||
| 2026-01-26 | 13F | KBC Group NV | 417.981 | 1,23 | 2 | -33,33 | ||||
| 2026-02-13 | 13F | Pathstone Holdings, LLC | 21.547 | -73,47 | 110 | -82,36 | ||||
| 2025-11-14 | 13F | Lombard Odier Asset Management (Europe) Ltd | 27.763 | |||||||
| 2026-01-29 | 13F | WT Asset Management Ltd | 12.611.190 | -32,38 | 64.317 | -54,74 | ||||
| 2026-02-02 | 13F | Truist Financial Corp | 20.257 | -44,57 | 103 | -62,95 | ||||
| 2026-01-07 | 13F | Harbor Investment Advisory, Llc | 301 | 0,00 | 2 | -50,00 | ||||
| 2025-10-20 | 13F | Masso Torrence Wealth Management Inc. | 13.343 | 0,00 | 102 | 124,44 | ||||
| 2026-03-20 | 13F | Purpose Unlimited Inc. | 1.000 | 5 | ||||||
| 2025-11-14 | 13F | Axa S.a. | 0 | -100,00 | 0 | -100,00 | ||||
| 2026-01-09 | 13F | SG Americas Securities, LLC | Put | 1.120.000 | -6,50 | 0 | ||||
| 2026-02-13 | 13F | Baird Financial Group, Inc. | 0 | -100,00 | 0 | |||||
| 2026-02-17 | 13F | Parallax Volatility Advisers, L.P. | Call | 5.807.900 | 58,43 | 29.620 | 6,04 | |||
| 2026-02-12 | 13F | Principal Securities, Inc. | 0 | -100,00 | 0 | -100,00 | ||||
| 2026-02-17 | 13F | Parallax Volatility Advisers, L.P. | Put | 3.605.900 | 93,74 | 18.390 | 29,67 | |||
| 2026-01-07 | 13F | Aventura Private Wealth, LLC | 623 | -17,04 | 3 | -40,00 | ||||
| 2026-01-22 | 13F | City Holding Co | 500 | 0,00 | 3 | -33,33 | ||||
| 2026-02-13 | 13F | National Bank Of Canada /fi/ | 24.973 | 25,88 | 127 | -15,33 | ||||
| 2026-01-20 | 13F | AdvisorNet Financial, Inc | 1.641 | 0,00 | 8 | -33,33 | ||||
| 2026-02-02 | 13F | Cornerstone Planning Group LLC | 1.242 | 980,00 | 6 | 25,00 | ||||
| 2026-02-17 | 13F | Gotham Asset Management, LLC | 13.902 | 0,00 | 71 | -33,33 | ||||
| 2026-02-10 | 13F | Godfrey Financial Associates, Inc. | 55 | 0 | ||||||
| 2026-02-13 | 13F | Polymer Capital Management (HK) LTD | 90.000 | -44,10 | 459 | -62,56 | ||||
| 2026-02-10 | 13F | Sittner & Nelson, Llc | 200 | 0,00 | 1 | 0,00 | ||||
| 2026-02-11 | 13F | Winnow Wealth Llc | 150 | 1 | ||||||
| 2026-02-12 | 13F | Hollencrest Capital Management | 200 | 0,00 | 1 | 0,00 | ||||
| 2026-02-13 | 13F | Stifel Financial Corp | 11.807 | -2,02 | 60 | -34,07 | ||||
| 2026-02-17 | 13F | Verdad Advisers, LP | 21.450 | 109 | ||||||
| 2026-02-11 | 13F | Tradition Wealth Management, LLC | 15.111 | -10,11 | 77 | -39,84 | ||||
| 2026-02-17 | 13F | DV Trading LLC | 7.000 | 36 | ||||||
| 2026-01-08 | 13F | Tuttle Tactical Management LLC | 29.713 | 152 | ||||||
| 2026-01-16 | 13F | Louisbourg Investments Inc. | 16 | 0,00 | 0 | |||||
| 2026-02-06 | 13F | GPS Wealth Strategies Group, LLC | 500 | 0,00 | 3 | -33,33 | ||||
| 2026-02-12 | 13F | Federation des caisses Desjardins du Quebec | 75.989 | -7,53 | 388 | -38,18 | ||||
| 2026-02-17 | 13F | Northern Trust Corp | 330.245 | -0,13 | 1.684 | -33,15 | ||||
| 2025-11-14 | 13F | Point72 Asia (Singapore) Pte. Ltd. | 5 | 0 | ||||||
| 2026-01-29 | 13F | Sava Infond d.o.o. | 12.000 | -52,00 | 61 | -67,89 | ||||
| 2026-01-26 | 13F | American Wealth Advisors, LLC | 50 | 0,00 | 0 | |||||
| 2026-02-12 | 13F | Raiffeisen Bank International AG | Call | 0 | -100,00 | 0 | -100,00 | |||
| 2026-02-10 | 13F | Core Wealth Advisors, Llc | 650 | 3 | ||||||
| 2025-11-14 | 13F | Advisor Group Holdings, Inc. | Call | 0 | -100,00 | 0 | ||||
| 2025-11-14 | 13F | Mount Yale Investment Advisors, LLC | 0 | -100,00 | 0 | |||||
| 2026-01-22 | 13F | HHM Wealth Advisors, LLC | 1.615 | 0,00 | 8 | -33,33 | ||||
| 2026-02-05 | 13F | Bessemer Group Inc | 22 | 0,00 | 0 | |||||
| 2026-02-20 | 13F/A | CMT Capital Markets Trading GmbH | 412.959 | 2 | ||||||
| 2026-02-11 | 13F | Jpmorgan Chase & Co | 12.694.945 | 268,26 | 64.744 | 146,47 | ||||
| 2026-02-12 | 13F | Aviva Plc | 851.050 | -3,67 | 4.340 | -35,53 | ||||
| 2026-02-11 | 13F | Jpmorgan Chase & Co | Put | 1.500 | 0,00 | 8 | -36,36 | |||
| 2026-02-17 | 13F | Rwc Asset Advisors (us) Llc | 0 | -100,00 | 0 | -100,00 | ||||
| 2026-02-12 | 13F | Advisors Asset Management, Inc. | 141.390 | 10,37 | 721 | -26,13 | ||||
| 2026-02-13 | 13F | Sofos Investments, Inc. | 1.000 | -18,37 | 5 | -44,44 | ||||
| 2026-02-13 | 13F | Squarepoint Ops LLC | 0 | -100,00 | 0 | -100,00 | ||||
| 2026-04-08 | 13F | StoneCrest Wealth Management, Inc. | 11.200 | 68 | ||||||
| 2026-02-18 | 13F | EP Wealth Advisors, Inc. | 13.222 | 67 | ||||||
| 2026-02-13 | 13F | Wells Fargo & Company/mn | Call | 112.000 | 0,00 | 571 | -33,06 | |||
| 2025-10-24 | 13F | MorganRosel Wealth Management, LLC | 0 | -100,00 | 0 | -100,00 | ||||
| 2026-02-13 | 13F | Wells Fargo & Company/mn | Put | 224.500 | 100,45 | 1.145 | 34,11 | |||
| 2026-02-13 | 13F | Wells Fargo & Company/mn | 202.735 | 32,28 | 1.034 | -11,48 | ||||
| 2026-02-06 | 13F | Handelsbanken Fonder AB | 0 | -100,00 | 0 | -100,00 | ||||
| 2026-02-12 | 13F | Commonwealth Equity Services, Llc | 147.729 | -4,56 | 753 | 75.200,00 | ||||
| 2026-02-17 | 13F | Nomura Holdings Inc | Call | 168.200 | 858 | |||||
| 2026-02-17 | 13F | Nomura Holdings Inc | Put | 350.000 | -41,91 | 1.785 | -61,12 | |||
| 2025-11-14 | 13F | Vienna Asset Management LLC | 0 | -100,00 | 0 | |||||
| 2026-01-09 | 13F | SG Americas Securities, LLC | Call | 45.800 | 0 | |||||
| 2026-02-09 | 13F | Fisher Asset Management, LLC | 229.172 | -26,46 | 1.169 | -50,80 | ||||
| 2026-02-13 | 13F | Great West Life Assurance Co /can/ | 0 | -100,00 | 0 | |||||
| 2026-02-17 | 13F | LMR Partners LLP | Call | 0 | -100,00 | 0 | -100,00 | |||
| 2026-03-12 | 13F/A | Peak6 Llc | Put | 0 | -100,00 | 0 | -100,00 | |||
| 2026-02-06 | 13F | Tortoise Investment Management, LLC | 0 | -100,00 | 0 | |||||
| 2026-02-10 | 13F | Rothschild Investment Llc | 1.000 | 0,00 | 5 | -28,57 | ||||
| 2026-02-12 | 13F | Scotia Capital Inc. | 0 | -100,00 | 0 | |||||
| 2026-02-17 | 13F | Point72 Asset Management, L.P. | 2.820.960 | 14.387 | ||||||
| 2026-01-23 | 13F | Stonehaven Wealth & Tax Solutions, Llc | 15.625 | 80 | ||||||
| 2026-02-12 | 13F | Ensign Peak Advisors, Inc | 0 | -100,00 | 0 | -100,00 | ||||
| 2025-11-03 | 13F | Private Wealth Asset Management, LLC | 0 | -100,00 | 0 | |||||
| 2025-11-12 | 13F | Cresset Asset Management, LLC | 0 | -100,00 | 0 | |||||
| 2026-01-23 | 13F | Rsm Us Wealth Management Llc | 13.131 | -43,38 | 72 | -59,09 | ||||
| 2026-02-13 | 13F | Verition Fund Management LLC | Put | 281.200 | 0,00 | 1.434 | -33,05 | |||
| 2026-02-13 | 13F | Pinnacle Wealth Planning Services, Inc. | 1.936 | 10 | ||||||
| 2026-03-17 | 13F | Stance Capital Llc | 0 | -100,00 | 0 | -100,00 | ||||
| 2026-02-13 | 13F | Verition Fund Management LLC | 518.716 | -53,59 | 2.645 | -68,94 | ||||
| 2026-02-17 | 13F | Whitebox Advisors Llc | Put | 485.000 | 0,00 | 2.474 | -33,07 | |||
| 2026-01-27 | 13F | Regions Financial Corp | 25.340 | -49,66 | 129 | -66,32 | ||||
| 2026-02-06 | 13F | Profund Advisors Llc | 208.087 | -13,20 | 1.061 | -41,89 | ||||
| 2025-10-28 | 13F | Wolverine Asset Management Llc | 0 | -100,00 | 0 | -100,00 | ||||
| 2026-02-17 | 13F | Tudor Investment Corp Et Al | Call | 750.000 | 3.825 | |||||
| 2026-02-10 | 13F | Nomura Asset Management Co Ltd | 8.000 | 0,00 | 41 | -33,33 | ||||
| 2026-02-12 | 13F | Groupe la Francaise | 0 | -100,00 | 0 | -100,00 | ||||
| 2025-11-10 | 13F | Tableaux Llc | 0 | -100,00 | 0 | -100,00 | ||||
| 2026-02-03 | 13F | SBI Securities Co., Ltd. | 316.491 | 3,55 | 1.614 | -30,67 | ||||
| 2026-02-13 | 13F | Marshall Wace, Llp | 0 | -100,00 | 0 | -100,00 | ||||
| 2026-01-21 | 13F | Capital Advisors, Ltd. LLC | 1.000 | -50,00 | 0 | |||||
| 2026-02-03 | 13F | Ballentine Partners, LLC | 43.832 | 1,73 | 224 | -32,01 | ||||
| 2026-02-11 | 13F | Group One Trading, L.p. | Put | 1.438.200 | -29,07 | 7.335 | -52,53 | |||
| 2026-02-12 | 13F | Renaissance Technologies Llc | 8.489.400 | 14,51 | 43.296 | -23,36 | ||||
| 2026-02-17 | 13F | D. E. Shaw & Co., Inc. | Call | 1.892.800 | -39,73 | 9.653 | -59,66 | |||
| 2026-02-17 | 13F | D. E. Shaw & Co., Inc. | 48.172.443 | 247,96 | 245.679 | 132,89 | ||||
| 2026-02-11 | 13F | Group One Trading, L.p. | Call | 4.006.000 | 11,63 | 20.431 | -25,29 | |||
| 2026-02-11 | 13F | Hilton Head Capital Partners, LLC | 19 | 0 | ||||||
| 2026-02-17 | 13F | D. E. Shaw & Co., Inc. | Put | 3.400.000 | 121,25 | 17.340 | 48,09 | |||
| 2026-02-11 | 13F | Group One Trading, L.p. | 365.252 | 1.863 | ||||||
| 2026-02-17 | 13F | EFG International AG | 23.540 | 120 | ||||||
| 2026-02-03 | 13F | Ethic Inc. | 62.061 | 11,05 | 317 | -25,65 | ||||
| 2026-02-17 | 13F | Symmetry Peak Management Llc | Call | 12.500 | -74,44 | 64 | -83,06 | |||
| 2026-02-11 | 13F | Strategic Advocates LLC | 0 | -100,00 | 0 | |||||
| 2025-11-14 | 13F | Peak6 Llc | 0 | -100,00 | 0 | -100,00 | ||||
| 2026-02-12 | 13F | Steward Partners Investment Advisory, Llc | 9.014 | -14,03 | 46 | -43,04 | ||||
| 2026-02-06 | 13F | Copia Wealth Management | 30 | 0,00 | 0 | |||||
| 2026-02-19 | 13F | CI Private Wealth, LLC | 109.070 | 100,65 | 556 | 34,30 | ||||
| 2026-02-09 | 13F | Prospera Financial Services Inc | 25.626 | -12,69 | 131 | -41,70 | ||||
| 2026-04-07 | 13F | Signaturefd, Llc | 39.970 | 35,93 | 241 | 61,74 | ||||
| 2025-10-29 | 13F | LJI Wealth Management, LLC | 0 | -100,00 | 0 | |||||
| 2026-02-13 | 13F | Glen Eagle Advisors, LLC | 10.000 | 0,00 | 51 | -32,89 | ||||
| 2026-01-30 | 13F | Bogart Wealth, LLC | 342 | 9,62 | 2 | -50,00 | ||||
| 2026-02-11 | 13F | Vise Technologies, Inc. | 13.806 | 70 | ||||||
| 2026-02-17 | 13F | Trexquant Investment LP | 4.725.389 | 162,49 | 24.099 | 75,69 | ||||
| 2026-01-29 | 13F | UBS Group AG | Put | 5.278.700 | -41,25 | 26.921 | -60,68 | |||
| 2026-01-27 | 13F | Atlantic Edge Private Wealth Management, LLC | 0 | -100,00 | 0 | -100,00 | ||||
| 2026-01-29 | 13F | UBS Group AG | Call | 5.607.051 | -56,84 | 28.596 | -71,11 | |||
| 2026-01-29 | 13F | Quent Capital, LLC | 2.500 | 13 | ||||||
| 2026-01-23 | 13F | Hedeker Wealth, LLC | 12.506 | 0,00 | 64 | -33,68 | ||||
| 2026-01-29 | 13F | UBS Group AG | 24.549.713 | -14,69 | 125.204 | -42,90 | ||||
| 2026-02-12 | 13F | Rossby Financial, LCC | 34 | 0,00 | 0 | |||||
| 2026-02-11 | 13F | Cedar Mountain Advisors, LLC | 212 | 0,00 | 1 | 0,00 | ||||
| 2026-02-12 | 13F | Insigneo Advisory Services, Llc | 25.954 | -39,74 | 132 | -59,76 | ||||
| 2026-02-13 | 13F | American Century Companies Inc | 1.382.065 | 19,98 | 7.049 | -19,70 | ||||
| 2026-02-17 | 13F | Two Sigma Securities, Llc | 106.902 | 545 | ||||||
| 2026-02-17 | 13F | Quantitative Investment Management, LLC | 104.004 | 1 | ||||||
| 2025-11-07 | 13F | Credit Industriel Et Commercial | 0 | -100,00 | 0 | -100,00 | ||||
| 2026-04-10 | 13F | Country Trust Bank | 0 | -100,00 | 0 | |||||
| 2026-02-04 | 13F | Abc Arbitrage Sa | 0 | -100,00 | 0 | -100,00 | ||||
| 2026-02-09 | 13F | Harbour Investments, Inc. | 2.397 | 19,19 | 12 | -20,00 | ||||
| 2026-02-17 | 13F | Russell Investments Group, Ltd. | 620.636 | -72,35 | 3.298 | -80,72 | ||||
| 2026-01-29 | 13F | High Probability Advisors, LLC | 47.300 | 241 | ||||||
| 2026-02-11 | 13F | Deutsche Bank Ag\ | 647 | -98,63 | 3 | -99,17 | ||||
| 2025-11-14 | 13F | Paloma Partners Management Co | Put | 0 | -100,00 | 0 | -100,00 | |||
| 2025-11-07 | 13F | Credit Industriel Et Commercial | Put | 0 | -100,00 | 0 | -100,00 | |||
| 2026-04-06 | 13F | Highline Wealth Partners Llc | 756 | 18,50 | 5 | 33,33 | ||||
| 2026-01-28 | 13F | Financial Perspectives, Inc | 22 | 0,00 | 0 | |||||
| 2026-02-06 | 13F | Larson Financial Group LLC | 480 | -42,03 | 2 | -66,67 | ||||
| 2026-02-17 | 13F | LMR Partners LLP | Put | 21.946.300 | 0,00 | 111.926 | -33,07 | |||
| 2026-02-12 | 13F | BlackRock, Inc. | 5.582.717 | 152,98 | 28.472 | 69,32 | ||||
| 2026-02-17 | 13F | LMR Partners LLP | 631.902 | -39,76 | 3.223 | -59,69 | ||||
| 2026-02-11 | 13F | Highbridge Capital Management Llc | Put | 3.526.600 | 133,15 | 17.986 | 56,04 | |||
| 2026-02-02 | 13F | Farmers & Merchants Trust Co of Chambersburg PA | 200 | 0,00 | 0 | |||||
| 2026-02-20 | 13F/A | Capital Markets Trading UK LLP | 344.976 | 34,28 | 2 | 0,00 | ||||
| 2026-02-10 | 13F | Close Asset Management Ltd | 181 | 0,00 | 0 | |||||
| 2026-02-10 | 13F | NINE MASTS CAPITAL Ltd | 474.500 | 2.420 | ||||||
| 2026-02-05 | 13F | Navalign, LLC | 10 | 0 | ||||||
| 2026-02-13 | 13F | Axim Planning & Wealth | Call | 64.000 | 236,84 | 326 | 126,39 | |||
| 2026-01-13 | 13F | Stephens Consulting, LLC | 5.000 | 0,00 | 26 | -34,21 | ||||
| 2026-02-11 | 13F | LPL Financial LLC | 403.150 | 1,64 | 2.056 | -31,97 | ||||
| 2026-02-13 | 13F | Axim Planning & Wealth | 131.492 | -20,11 | 671 | -46,57 | ||||
| 2026-02-11 | 13F | Havemeyer Place LP | 389.142 | 1.985 | ||||||
| 2026-02-11 | 13F | O'shaughnessy Asset Management, Llc | 64.986 | 26,23 | 331 | -15,56 | ||||
| 2026-02-17 | 13F | Guggenheim Capital Llc | 32.878 | 31,75 | 168 | -12,11 | ||||
| 2026-01-22 | 13F | Mechanics Financial Corp | 250 | 0,00 | 1 | 0,00 | ||||
| 2026-02-11 | 13F | Harvest Fund Management Co., Ltd | 153.300 | 16,76 | 1 | |||||
| 2026-02-10 | 13F | Goldman Sachs Group Inc | Put | 2.000.000 | -33,33 | 10.200 | -55,38 | |||
| 2026-02-10 | 13F | Goldman Sachs Group Inc | 14.367.913 | 57,78 | 73.276 | 5,60 | ||||
| 2026-01-21 | 13F | Ameliora Wealth Management Ltd. | 225 | 0,00 | 1 | 0,00 | ||||
| 2026-02-10 | 13F | Goldman Sachs Group Inc | Call | 50.000 | 255 | |||||
| 2026-02-13 | 13F | Hurley Capital, LLC | Call | 0 | 0 | |||||
| 2025-11-14 | 13F | Point72 Hong Kong Ltd | 197.563 | 1.505 | ||||||
| 2026-02-13 | 13F | Smartleaf Asset Management LLC | 1.551 | 9 | ||||||
| 2026-02-09 | 13F | Koesten, Hirschmann & Crabtree, INC. | 0 | -100,00 | 0 | |||||
| 2026-02-17 | 13F | Scarborough Advisors, LLC | 43 | 0,00 | 0 | |||||
| 2025-11-14 | 13F | IHT Wealth Management, LLC | 0 | -100,00 | 0 | |||||
| 2026-04-07 | 13F | Farther Finance Advisors, LLC | 29.244 | 25,21 | 181 | 52,10 | ||||
| 2026-02-13 | 13F | Hurley Capital, LLC | 733 | 0,00 | 4 | -40,00 | ||||
| 2026-02-17 | 13F | SIH Partners, LLLP | 10.600 | 0,00 | 54 | -32,50 | ||||
| 2026-01-16 | 13F | Empirical Financial Services, LLC d.b.a. Empirical Wealth Management | 13.410 | 1,21 | 68 | -32,00 | ||||
| 2026-02-18 | 13F | Mackenzie Financial Corp | 962.721 | 134,37 | 5.285 | 68,82 | ||||
| 2026-01-28 | 13F | City State Bank | 300 | -25,00 | 2 | -66,67 | ||||
| 2025-11-04 | 13F | United Community Bank | 0 | -100,00 | 0 | |||||
| 2026-02-17 | 13F | Persistent Asset Partners Ltd | 0 | -100,00 | 0 | -100,00 | ||||
| 2026-01-26 | 13F | Cwm, Llc | 15.737 | -7,82 | 0 | |||||
| 2026-01-28 | 13F | N.E.W. Advisory Services LLC | 2.927 | 0,00 | 15 | -36,36 | ||||
| 2026-02-12 | 13F | Bank Of Montreal /can/ | 254.877 | 2,52 | 1.300 | -31,41 | ||||
| 2026-02-10 | 13F | Envestnet Asset Management Inc | 137.450 | 701 | ||||||
| 2026-02-17 | 13F | Ancora Advisors, LLC | 1.711 | -29,47 | 9 | -55,56 | ||||
| 2026-01-15 | 13F | Lodestone Wealth Management LLC | 150 | 1 | ||||||
| 2026-01-22 | 13F | Bear Mountain Capital, Inc. | 10 | 0,00 | 0 | |||||
| 2026-02-17 | 13F | Private Advisor Group, LLC | Call | 0 | -100,00 | 0 | ||||
| 2026-02-06 | 13F | Pnc Financial Services Group, Inc. | 54.432 | 26,08 | 278 | -15,55 | ||||
| 2026-03-20 | 13F/A | Hsbc Holdings Plc | 680.382 | 48,81 | 3.445 | -0,78 | ||||
| 2026-02-13 | 13F | First Trust Advisors Lp | 68.455 | -21,52 | 349 | -47,44 | ||||
| 2026-02-13 | 13F | Mml Investors Services, Llc | 38.357 | 250,68 | 196 | 134,94 | ||||
| 2026-02-17 | 13F | Mercer Global Advisors Inc /adv | 15.735 | 80 | ||||||
| 2026-02-13 | 13F | Ubs Asset Management Americas Inc | 73.351 | 38,29 | 374 | -7,43 | ||||
| 2025-11-14 | 13F | Capstone Investment Advisors, Llc | Put | 1.000.000 | 0,00 | 7.620 | 122,16 | |||
| 2026-02-17 | 13F | Engineers Gate Manager LP | 14.104 | -89,08 | 72 | -92,78 | ||||
| 2026-02-17 | 13F | Alliancebernstein L.p. | 64.996 | 92,23 | 331 | 28,79 | ||||
| 2025-12-16 | 13F | Garde Capital, Inc. | 0 | -100,00 | 0 | -100,00 | ||||
| 2026-02-17 | 13F | PharVision Advisers, LLC | 110.544 | 443,69 | 564 | 265,58 | ||||
| 2025-11-12 | 13F | Comprehensive Financial Planning, Inc./PA | 0 | -100,00 | 0 | |||||
| 2026-02-17 | 13F | Cardiff Park Advisors, Llc | 0 | -100,00 | 0 | -100,00 | ||||
| 2026-02-02 | 13F | New England Capital Financial Advisors LLC | 262 | 0,00 | 1 | 0,00 | ||||
| 2025-11-14 | 13F | Cubist Systematic Strategies, LLC | 1.443.778 | 11.002 | ||||||
| 2026-02-05 | 13F | DnB Asset Management AS | 156.760 | -30,22 | 799 | -53,30 | ||||
| 2026-02-09 | 13F | Shufro Rose & Co Llc | 0 | -100,00 | 0 | |||||
| 2026-02-13 | 13F | JustInvest LLC | 65.862 | 11,24 | 336 | -25,72 | ||||
| 2025-11-14 | 13F | Alpine Global Management, LLC | 0 | -100,00 | 0 | |||||
| 2026-02-17 | 13F | Glenmede Trust Co Na | 12.859 | 66 | ||||||
| 2026-02-13 | 13F | Citigroup Inc | Call | 250.000 | 0,00 | 1.275 | -33,07 | |||
| 2026-02-13 | 13F | Citigroup Inc | Put | 369.500 | 68,34 | 1.884 | 12,68 | |||
| 2026-02-13 | 13F | Citigroup Inc | 539.616 | -91,46 | 2.752 | -94,29 | ||||
| 2026-02-17 | 13F | MIRAE ASSET GLOBAL ETFS HOLDINGS Ltd. | 741.486 | -7,52 | 3.782 | -38,11 | ||||
| 2026-02-17 | 13F | Private Advisor Group, LLC | 52.124 | -0,48 | 266 | -33,58 | ||||
| 2026-02-17 | 13F | Raymond James Financial Inc | 163.361 | -30,79 | 833 | -53,67 | ||||
| 2026-01-29 | 13F | Sanctuary Advisors, LLC | 75.094 | 38,76 | 383 | -7,28 | ||||
| 2026-01-21 | 13F | Azzad Asset Management Inc /adv | 24.992 | 25,60 | 127 | -15,89 | ||||
| 2026-02-02 | 13F | CENTRAL TRUST Co | 600 | 3 | ||||||
| 2026-02-04 | 13F | Clark Wealth Partners | 650 | 0,00 | 3 | 0,00 | ||||
| 2025-11-14 | 13F | Man Group plc | 0 | -100,00 | 0 | |||||
| 2025-11-03 | 13F | Valeo Financial Advisors, LLC | 0 | -100,00 | 0 | -100,00 | ||||
| 2025-11-12 | 13F | Berbice Capital Management LLC | 0 | -100,00 | 0 | -100,00 | ||||
| 2026-01-26 | 13F | Main Street Group, LTD | 0 | -100,00 | 0 | -100,00 | ||||
| 2025-11-06 | 13F | First National Trust Co | 0 | -100,00 | 0 | -100,00 | ||||
| 2026-02-05 | 13F | Plante Moran Financial Advisors, LLC | 2.000 | -4,76 | 10 | -37,50 | ||||
| 2026-02-12 | 13F | Dimensional Fund Advisors Lp | 92.117 | 189,76 | 472 | 96,25 | ||||
| 2026-01-28 | 13F | Geneos Wealth Management Inc. | 522 | 0,00 | 3 | -33,33 | ||||
| 2026-02-13 | 13F | Umb Bank N A/mo | 500 | 0,00 | 3 | -33,33 | ||||
| 2026-02-10 | 13F | Bnp Paribas Arbitrage, Sa | Call | 905 | 462 | |||||
| 2026-02-10 | 13F | Bnp Paribas Arbitrage, Sa | 21.619.358 | 16,20 | 110.259 | -22,23 | ||||
| 2026-02-10 | 13F | Bnp Paribas Arbitrage, Sa | Put | 5.105 | 0,00 | 2.604 | -33,08 | |||
| 2026-02-13 | 13F | Van Eck Associates Corp | 502.013 | -3,82 | 3 | -33,33 | ||||
| 2026-02-05 | 13F | Central Asset Investments & Management Holdings (HK) Ltd | 0 | -100,00 | 0 | -100,00 | ||||
| 2026-01-05 | 13F | Chesapeake Asset Management Llc | 0 | -100,00 | 0 | -100,00 | ||||
| 2026-02-10 | 13F | Evolution Wealth Management Inc. | 50 | 0,00 | 0 | |||||
| 2026-02-17 | 13F | Citadel Advisors Llc | Put | 9.282.500 | -12,57 | 47.341 | -41,48 | |||
| 2026-02-17 | 13F | Citadel Advisors Llc | 9.436.364 | 48,91 | 48.125 | -0,34 | ||||
| 2026-02-13 | 13F | Dynamic Technology Lab Private Ltd | 10.000 | -64,29 | 51 | -76,06 | ||||
| 2026-02-13 | 13F | Quattro Advisors LLC | 10 | 0 | ||||||
| 2026-02-11 | 13F | Vermillion Wealth Management, Inc. | 2.000 | 0,00 | 10 | -33,33 | ||||
| 2026-01-29 | 13F | IMC-Chicago, LLC | 3.178.590 | 101,50 | 16.211 | 34,86 | ||||
| 2026-01-29 | 13F | IMC-Chicago, LLC | Put | 6.346.400 | -7,92 | 32.367 | -38,38 | |||
| 2026-01-09 | 13F | SG Americas Securities, LLC | 3.006.407 | 89,91 | 15 | 25,00 | ||||
| 2026-01-21 | 13F | Albion Financial Group /ut | 2 | 0,00 | 0 | |||||
| 2026-01-22 | 13F | Trilogy Capital Inc. | 100.756 | -12,96 | 514 | -41,84 | ||||
| 2026-01-29 | 13F | IMC-Chicago, LLC | Call | 5.276.100 | -8,91 | 26.908 | -39,04 | |||
| 2026-01-29 | 13F | China Universal Asset Management Co., Ltd. | 75.000 | 200,00 | 382 | 101,05 | ||||
| 2026-02-17 | 13F | Bank Of America Corp /de/ | 7.149.013 | -19,11 | 36.460 | -45,86 | ||||
| 2026-01-14 | 13F | ORG Wealth Partners, LLC | 0 | -100,00 | 0 | -100,00 | ||||
| 2026-02-13 | 13F | Atlas Capital Advisors Llc | 2.845 | 0,00 | 15 | 55,56 | ||||
| 2026-02-03 | 13F | Costello Asset Management, INC | 100 | 0,00 | 1 | |||||
| 2026-02-09 | 13F | Legal & General Group Plc | 6.119.665 | -2,07 | 31.180 | -34,48 | ||||
| 2026-02-17 | 13F | Edmond De Rothschild Holding S.a. | 330.300 | 6,45 | 1.685 | -28,76 | ||||
| 2026-02-06 | 13F | Creative Financial Designs Inc /adv | 950 | 0,00 | 5 | -42,86 | ||||
| 2026-02-17 | 13F | Two Sigma Investments, Lp | 679.000 | 41,37 | 3.463 | -5,38 | ||||
| 2026-02-12 | 13F | XY Capital Ltd | 311.060 | 1.586 | ||||||
| 2026-02-13 | 13F | BNP Paribas Asset Management Holding S.A. | 390.436 | 2 | ||||||
| 2026-01-15 | 13F | Victory Financial Group, Llc | 23.960 | -50,45 | 122 | -66,85 | ||||
| 2026-01-30 | 13F | Archer Investment Corp | 677 | 0,00 | 3 | -40,00 | ||||
| 2026-01-09 | 13F | 180 Wealth Advisors, Llc | 82.027 | -4,23 | 418 | -35,89 | ||||
| 2026-02-17 | 13F | Citadel Advisors Llc | Call | 10.998.400 | -19,21 | 56.092 | -45,93 | |||
| 2026-02-11 | 13F | Viewpoint Capital Management LLC | 30.000 | 0,00 | 153 | -32,89 | ||||
| 2026-02-11 | 13F | SOUTH STATE Corp | 0 | -100,00 | 0 | -100,00 | ||||
| 2026-01-28 | 13F | One River Asset Management, LLC | Put | 234.300 | 2.223 | |||||
| 2026-01-28 | 13F | One River Asset Management, LLC | 75.000 | 395 | ||||||
| 2026-01-16 | 13F | Vanguard Capital Wealth Advisors This fund is a listed as child fund of Vanguard Group Inc and if that institution has disclosed ownership in this security, then these positions will not be double counted when calculating total shares and total value | 12.500 | 64 | ||||||
| 2026-01-28 | 13F | One River Asset Management, LLC | Call | 388.300 | 3.008 | |||||
| 2026-02-20 | 13F/A | CMT Capital Markets Trading GmbH | Put | 6.281.300 | -10,34 | 32 | -39,62 | |||
| 2026-02-10 | 13F | CIBC World Markets Inc. | 16.861 | 2,49 | 86 | -32,00 | ||||
| 2026-02-20 | 13F/A | CMT Capital Markets Trading GmbH | Call | 5.657.400 | -7,38 | 29 | -39,13 | |||
| 2026-01-20 | 13F | Quintet Private Bank (Europe) S.A. | 23.000 | -32,35 | 117 | -54,83 | ||||
| 2026-01-23 | 13F | Northland Securities, Inc. | 12.000 | 61 | ||||||
| 2026-02-06 | 13F | IFP Advisors, Inc | 105 | 10,53 | 1 | |||||
| 2026-01-30 | 13F | Laurel Wealth Advisors LLC | 9 | 0 | ||||||
| 2026-02-03 | 13F | RFG Advisory, LLC | 15.406 | 8,38 | 79 | -27,78 | ||||
| 2026-02-10 | 13F/A | Northwestern Mutual Wealth Management Co | 26.535 | 22,18 | 135 | -18,18 | ||||
| 2026-01-05 | 13F | Catherine Avery Investment Management LLC | 0 | -100,00 | 0 | -100,00 | ||||
| 2026-02-17 | 13F | Laird Norton Trust Company, Llc | 103.098 | 526 | ||||||
| 2026-02-19 | 13F | Invesco Ltd. | 3.997.775 | 47,79 | 20.389 | -1,09 | ||||
| 2025-11-13 | 13F | Total Investment Management Inc | 0 | -100,00 | 0 | -100,00 | ||||
| 2026-02-17 | 13F | Susquehanna Advisors Group, Inc. | Put | 1.000.000 | 0,00 | 5.100 | -33,07 | |||
| 2026-02-09 | 13F/A | Swedbank AB | 424.491 | 25,26 | 2.165 | -16,19 | ||||
| 2025-11-13 | 13F | Clear Street Markets Llc | 0 | -100,00 | 0 | -100,00 | ||||
| 2026-04-08 | 13F | Wealth Enhancement Trust Services, Inc. | 135 | 1 | ||||||
| 2026-02-11 | 13F | Allianz Asset Management GmbH | 34.737 | 177 | ||||||
| 2026-02-03 | 13F | Coston, McIsaac & Partners | 115 | 0,00 | 0 | |||||
| 2026-02-12 | 13F | Hrt Financial Lp | 0 | -100,00 | 0 | -100,00 | ||||
| 2026-02-05 | 13F | Mission Wealth Management, Lp | 18.191 | -86,26 | 93 | -90,87 | ||||
| 2026-01-16 | 13F | Ronald Blue Trust, Inc. | 1.047 | 0,00 | 5 | -28,57 | ||||
| 2026-02-13 | 13F | Integrated Wealth Concepts LLC | 23.714 | -11,90 | 121 | -41,46 | ||||
| 2025-11-13 | 13F | Glenmede Investment Management, LP | 11.876 | 90 | ||||||
| 2026-02-13 | 13F | Natixis | 1.214.565 | -37,55 | 6.194 | -58,20 | ||||
| 2026-02-13 | 13F | Motiv8 Investments LLC | 309 | 0 | ||||||
| 2026-03-04 | 13F | SHP Wealth Management | 745 | 4 | ||||||
| 2025-12-18 | 13F | Danske Bank A/s | 0 | -100,00 | 0 | |||||
| 2026-02-09 | 13F | IPG Investment Advisors LLC | 39.809 | 25,54 | 203 | -15,77 | ||||
| 2026-02-12 | 13F | Wealthspire Advisors, LLC | 12.980 | 26,35 | 66 | -15,38 | ||||
| 2026-02-12 | 13F | Campbell & CO Investment Adviser LLC | 40.670 | 207 | ||||||
| 2025-11-14 | 13F | Evelyn Partners Investment Management Services Ltd | 0 | -100,00 | 0 | |||||
| 2026-02-13 | 13F | Ubs Oconnor Llc | 0 | -100,00 | 0 | -100,00 | ||||
| 2026-02-13 | 13F | Walleye Trading LLC | Call | 1.271.900 | 3,71 | 6.487 | -30,59 | |||
| 2026-02-12 | 13F | Xponance, Inc. | 10.762 | 3,95 | 55 | -30,77 | ||||
| 2026-02-13 | 13F | Walleye Trading LLC | 880.016 | 183,05 | 4.488 | 89,45 | ||||
| 2026-02-13 | 13F | Walleye Trading LLC | Put | 1.665.600 | -0,17 | 8.495 | -33,19 | |||
| 2025-11-12 | 13F | HAP Trading, LLC | Put | 35.100 | 15 | |||||
| 2025-11-12 | 13F | HAP Trading, LLC | Call | 135.600 | 367 | |||||
| 2026-02-13 | 13F | Sculptor Capital LP | Put | 960.800 | 0,00 | 4.900 | -33,07 | |||
| 2026-02-05 | 13F | Center for Financial Planning, Inc. | 1.975 | 0,00 | 10 | -33,33 | ||||
| 2026-02-17 | 13F | Ameriprise Financial Inc | 51.647 | -13,65 | 263 | -42,20 | ||||
| 2026-02-04 | 13F | Atlantic Union Bankshares Corp | 5.950 | 98,33 | 30 | 36,36 | ||||
| 2026-01-29 | 13F | Concurrent Investment Advisors, LLC | 10.885 | 8,10 | 56 | -27,63 | ||||
| 2026-02-13 | 13F | Vontobel Holding Ltd. | 312.141 | 151,43 | 1.592 | 68,36 | ||||
| 2026-01-28 | 13F | WMG Financial Advisors, LLC | 12.250 | -66,84 | 62 | -77,94 | ||||
| 2026-02-11 | 13F | Parallel Advisors, LLC | 13.798 | -12,73 | 70 | -41,67 | ||||
| 2026-01-30 | 13F | Aries Wealth Management | 10.000 | 0,00 | 51 | -32,89 | ||||
| 2026-02-17 | 13F | Susquehanna International Group, Llp | Put | 10.309.800 | -28,08 | 52.580 | -51,87 | |||
| 2026-02-17 | 13F | Jump Financial, LLC | 3.258.944 | -25,01 | 16.621 | -49,81 | ||||
| 2026-02-17 | 13F | Susquehanna International Group, Llp | Call | 25.968.500 | 23,32 | 132.439 | -17,46 | |||
| 2026-02-17 | 13F | Susquehanna International Group, Llp | 4.684.842 | -50,95 | 23.893 | -67,17 | ||||
| 2026-02-17 | 13F | Qube Research & Technologies Ltd | 2.169.651 | 11.065 | ||||||
| 2026-02-17 | 13F | Limestone Investment Advisors LP | 0 | -100,00 | 0 | -100,00 | ||||
| 2025-11-14 | 13F | AXA Investment Managers S.A. | 130.973 | 998 | ||||||
| 2026-02-17 | 13F | Quadrature Capital Ltd | 37.611 | -99,51 | 192 | -99,67 | ||||
| 2026-02-12 | 13F | DRW Securities, LLC | 24.667 | 126 | ||||||
| 2026-02-18 | 13F | Vermillion & White Wealth Management Group, LLC | 82 | 22,39 | 0 | |||||
| 2026-01-29 | 13F | Concord Wealth Partners | 3 | 0,00 | 0 | |||||
| 2026-01-29 | 13F | UMA Financial Services, Inc. | 295 | -8,95 | 2 | -50,00 | ||||
| 2026-02-17 | 13F | Credit Agricole S A | 50.244 | 47,50 | 256 | -1,16 | ||||
| 2026-02-17 | 13F | Dv Equities, Llc | 1.160.465 | 5.918 | ||||||
| 2026-02-11 | 13F | RWC Asset Management LLP | 0 | -100,00 | 0 | -100,00 | ||||
| 2026-02-23 | 13F | Mv Capital Management, Inc. | 8.303 | 42 | ||||||
| 2026-01-05 | 13F | Union Bancaire Privee, UBP SA | 1.000 | 6 | ||||||
| 2026-01-13 | 13F | Global X Japan Co., Ltd. | 2.791 | 0,00 | 14 | -33,33 | ||||
| 2026-02-05 | 13F | Baader Bank INC | 0 | -100,00 | 0 | |||||
| 2026-01-26 | 13F | Mirae Asset Global Investments Co., Ltd. | 174.177 | 4,27 | 888 | -30,19 | ||||
| 2026-01-20 | 13F | Cigna Investments Inc /new | 27.498 | 0,00 | 0 | |||||
| 2026-02-13 | 13F | Kilter Group LLC | 150 | -25,00 | 1 | -100,00 | ||||
| 2026-02-24 | 13F | DGS Capital Management, LLC | 0 | -100,00 | 0 | -100,00 | ||||
| 2025-11-04 | 13F | Guerra Advisors Inc | 459 | 3 | ||||||
| 2026-02-13 | 13F | PCM Encore, LLC | 42.195 | 215 | ||||||
| 2026-02-20 | 13F | Sunbelt Securities, Inc. | 50 | 0,00 | 0 | |||||
| 2026-02-13 | 13F | Colony Group, LLC | 60.762 | 310 | ||||||
| 2026-02-17 | 13F | Jain Global LLC | 0 | -100,00 | 0 | -100,00 | ||||
| 2026-02-17 | 13F | SageView Advisory Group, LLC | 3.879 | 20 | ||||||
| 2026-02-17 | 13F | Gladstone Institutional Advisory LLC | 11.193 | -15,40 | 57 | -43,00 | ||||
| 2026-02-13 | 13F | Aspex Management (HK) Ltd | 13.141.609 | -62,45 | 67 | -74,81 | ||||
| 2026-02-17 | 13F | Cetera Investment Advisers | 100.770 | -5,30 | 514 | -36,67 | ||||
| 2026-04-08 | 13F | First Heartland Consultants, Inc. | 14.108 | 0,00 | 85 | 19,72 | ||||
| 2026-02-10 | 13F | Savant Capital, LLC | 28.547 | 38,23 | 146 | -7,64 | ||||
| 2026-04-10 | 13F | Abound Wealth Management | 123 | 392,00 | 1 | |||||
| 2026-01-29 | 13F | Financial Life Planners | 0 | -100,00 | 0 | -100,00 | ||||
| 2025-11-17 | 13F | Hancock Prospecting Pty Ltd | 0 | -100,00 | 0 | -100,00 | ||||
| 2026-02-20 | 13F/A | Capital Markets Trading UK LLP | Put | 13.389.200 | 8,18 | 68 | -27,66 | |||
| 2026-02-20 | 13F/A | Capital Markets Trading UK LLP | Call | 2.411.500 | 11,27 | 12 | -25,00 | |||
| 2026-02-13 | 13F | Rhumbline Advisers | 10.495 | -7,15 | 54 | -38,37 | ||||
| 2025-11-06 | 13F | Ameritas Advisory Services, LLC | 0 | -100,00 | 0 | -100,00 | ||||
| 2026-02-10 | 13F | Murphy & Mullick Capital Management Corp | 50 | 0,00 | 0 | |||||
| 2025-10-17 | 13F | Bard Financial Services, Inc. | 10.250 | 0,00 | 78 | 122,86 | ||||
| 2026-03-12 | 13F/A | Peak6 Llc | Call | 24.300 | -97,52 | 124 | -98,35 | |||
| 2026-02-09 | 13F | Hartland & Co., LLC | 77 | 234,78 | 0 | |||||
| 2025-10-21 | 13F | Optimum Investment Advisors | 0 | -100,00 | 0 | -100,00 | ||||
| 2026-02-10 | 13F | Exit Wealth Advisors, LLC. | 110.782 | 565 | ||||||
| 2026-02-17 | 13F | Cantor Fitzgerald, L. P. | 0 | -100,00 | 0 | -100,00 | ||||
| 2026-02-12 | 13F | Brinker Capital Investments, LLC | 21.332 | -4,57 | 109 | -36,47 | ||||
| 2026-01-20 | 13F | Stratos Wealth Partners, LTD. | 12.003 | -21,08 | 61 | -46,96 | ||||
| 2025-11-03 | 13F | Pandora Wealth, Inc. | 0 | -100,00 | 0 | |||||
| 2026-01-21 | 13F | Westfuller Advisors, LLC | 11.680 | 60 | ||||||
| 2025-11-12 | 13F | Accuvest Global Advisors | 0 | -100,00 | 0 | -100,00 | ||||
| 2026-02-12 | 13F | Great Valley Advisor Group, Inc. | 10.236 | 52 | ||||||
| 2026-01-12 | 13F | AllSquare Wealth Management LLC | 100 | 0,00 | 1 | |||||
| 2026-02-10 | 13F | Bnp Paribas | 2.150 | 0,00 | 11 | -37,50 | ||||
| 2026-02-13 | 13F | Walleye Capital LLC | Call | 261.600 | 3.691,30 | 1.334 | 2.465,38 | |||
| 2026-02-13 | 13F | Walleye Capital LLC | Put | 3.567.900 | 5,96 | 18.196 | -29,08 | |||
| 2026-02-13 | 13F | Navis Wealth Advisors, LLC | 20.500 | 105 | ||||||
| 2026-02-13 | 13F | Walleye Capital LLC | 248.870 | 1.985,56 | 1.269 | 1.310,00 | ||||
| 2026-02-18 | 13F | Vident Advisory, LLC | 121.047 | 31,38 | 617 | -12,11 | ||||
| 2026-02-11 | 13F | Cerity Partners LLC | 57.080 | 154,97 | 291 | 71,18 | ||||
| 2026-01-21 | 13F | Stone House Investment Management, LLC | 29 | 0 | ||||||
| 2026-01-14 | 13F | Alliance Wealth Advisors, LLC | Call | 200.000 | 0,00 | 302 | -58,34 | |||
| 2025-10-17 | 13F | Apollon Wealth Management, LLC | 0 | -100,00 | 0 | -100,00 | ||||
| 2026-01-14 | 13F | Alliance Wealth Advisors, LLC | 200.000 | 0,00 | 1.020 | -33,07 | ||||
| 2026-02-03 | 13F | CGC Financial Services, LLC | 10 | 0,00 | 0 | |||||
| 2026-02-13 | 13F | Toroso Investments, LLC | 347.263 | -6,52 | 1.771 | -37,42 | ||||
| 2026-02-09 | 13F | Huntington National Bank | 500 | -71,43 | 3 | -84,62 | ||||
| 2026-02-13 | 13F | Strategies Wealth Advisors, LLC | 10.125 | 0,30 | 52 | -32,89 | ||||
| 2025-11-05 | 13F | BI Asset Management Fondsmaeglerselskab A/S | 0 | -100,00 | 0 | |||||
| 2026-04-10 | 13F | Perigon Wealth Management, LLC | 10.569 | -11,64 | 64 | 3,28 | ||||
| 2026-01-30 | 13F | Activest Wealth Management | 0 | -100,00 | 0 | |||||
| 2026-02-13 | 13F | Macquarie Group Ltd | 219.824 | 0,00 | 1.121 | -33,07 | ||||
| 2026-02-17 | 13F | Css Llc/il | Put | 1.127.200 | 19,88 | 5.749 | -19,78 | |||
| 2026-02-06 | 13F | HighTower Advisors, LLC | 123.002 | 134,60 | 627 | 57,14 | ||||
| 2026-02-17 | 13F | Sig Brokerage, Lp | Call | 0 | -100,00 | 0 | -100,00 | |||
| 2026-02-03 | 13F | International Assets Investment Management, Llc | 0 | -100,00 | 0 | -100,00 | ||||
| 2026-02-17 | 13F | Creative Planning | 161.836 | -3,42 | 825 | -35,34 | ||||
| 2026-04-07 | 13F | CoreCap Advisors, LLC | 516 | 24,04 | 3 | 50,00 | ||||
| 2026-01-21 | 13F | Future Financial Wealth Managment LLC | 0 | -100,00 | 0 | -100,00 | ||||
| 2026-02-17 | 13F | Symmetry Investments LP | 164.888 | -48,21 | 841 | -65,38 | ||||
| 2026-02-13 | 13F | Bank Of Nova Scotia | 0 | -100,00 | 0 | -100,00 | ||||
| 2026-01-20 | 13F | Steel Peak Wealth Management LLC | 25.844 | -0,46 | 132 | -33,50 | ||||
| 2026-01-20 | 13F | Steel Peak Wealth Management LLC | Call | 102 | -32,89 | |||||
| 2026-02-12 | 13F | Skopos Labs, Inc. | 88.761 | 94,12 | 474 | 35,92 | ||||
| 2026-02-17 | 13F | Quantinno Capital Management LP | 0 | -100,00 | 0 | -100,00 | ||||
| 2026-04-08 | 13F | Sandbox Financial Partners, LLC | 11.097 | 9,90 | 67 | 29,41 | ||||
| 2026-01-21 | 13F | Jackson Square Capital, Llc | 0 | -100,00 | 0 | -100,00 | ||||
| 2026-04-07 | 13F | Farther Finance Advisors, LLC | Call | 0 | -100,00 | 0 | -100,00 | |||
| 2026-02-10 | 13F | Quantbot Technologies LP | 155.031 | 307,86 | 791 | 173,36 | ||||
| 2026-02-13 | 13F | Parkside Financial Bank & Trust | 364 | 0,00 | 2 | -50,00 | ||||
| 2025-11-07 | 13F | Sierra Ocean, Llc | 0 | -100,00 | 0 | |||||
| 2026-02-13 | 13F | Hel Ved Capital Management Ltd | 0 | -100,00 | 0 | -100,00 | ||||
| 2026-02-13 | 13F | Hel Ved Capital Management Ltd | Call | 0 | -100,00 | 0 | -100,00 | |||
| 2026-02-13 | 13F | Headlands Technologies LLC | 0 | -100,00 | 0 | |||||
| 2026-04-08 | 13F | Thompson Investment Management, Inc. | 50 | 0,00 | 0 | |||||
| 2026-02-13 | 13F | Heritage Wealth Advisors | 243 | 0,00 | 1 | 0,00 | ||||
| 2026-02-13 | 13F | Ausdal Financial Partners, Inc. | 30.783 | -24,36 | 157 | -49,68 | ||||
| 2026-02-09 | 13F | Hantz Financial Services, Inc. | 48.265 | 26,48 | 0 | |||||
| 2026-02-12 | 13F | CIBC Private Wealth Group, LLC | 280 | 11,11 | 1 | 0,00 | ||||
| 2026-02-10 | 13F | Greenwich Wealth Management LLC | 17.750 | -1,19 | 0 | |||||
| 2026-02-09 | 13F | Jefferies Financial Group Inc. | Put | 250.000 | 0,00 | 1.275 | -33,07 | |||
| 2026-02-17 | 13F | TCG Advisory Services, LLC | 0 | -100,00 | 0 | |||||
| 2026-02-09 | 13F | Jefferies Financial Group Inc. | 3.116 | -25,13 | 16 | -51,61 | ||||
| 2026-01-28 | 13F | CAPROCK Group, Inc. | 10.964 | -20,10 | 56 | -36,78 |