Grundlæggende statistik
| Institutionelle aktier (lange) | 87.070.106 - 88,69% (ex 13D/G) - change of -8,38MM shares -8,78% MRQ |
| Institutionel værdi (lang) | $ 1.711.409 USD ($1000) |
Institutionelt ejerskab og aktionærer
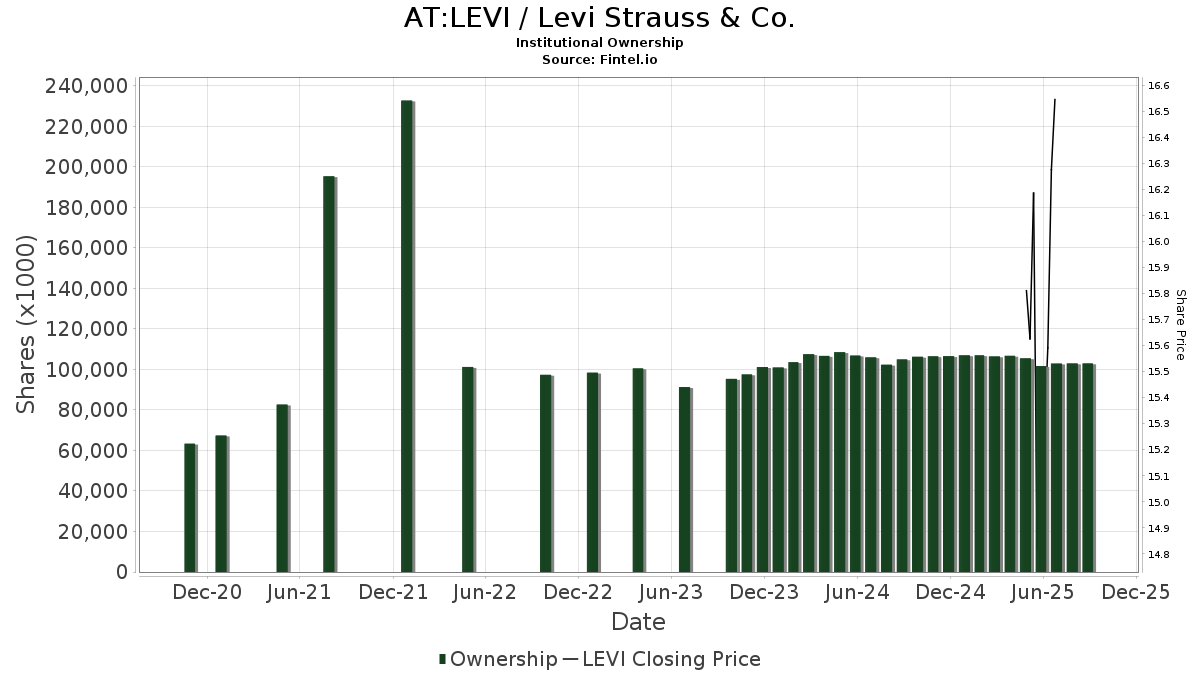
Levi Strauss & Co. (AT:LEVI) har 283 institutionelle ejere og aktionærer, der har indsendt 13D/G- eller 13F-formularer til Securities Exchange Commission (SEC). Disse institutioner har i alt 87,070,106 aktier. Største aktionærer omfatter Vanguard Group Inc, Jpmorgan Chase & Co, Goldman Sachs Group Inc, BlackRock, Inc., Wellington Management Group Llp, Balyasny Asset Management Llc, Two Sigma Investments, Lp, GW&K Investment Management, LLC, Two Sigma Advisers, Lp, and Ubs Asset Management Americas Inc .
Levi Strauss & Co. (WBAG:LEVI) institutionel ejerskabsstruktur viser aktuelle positioner i virksomheden efter institutioner og fonde, samt seneste ændringer i positionsstørrelse. Større aktionærer kan omfatte individuelle investorer, investeringsforeninger, hedgefonde eller institutioner. Skema 13D angiver, at investoren besidder (eller besidder) mere end 5 % af virksomheden og har til hensigt (eller har til hensigt at) aktivt at forfølge en ændring i forretningsstrategi. Skema 13G indikerer en passiv investering på over 5%.
The share price as of April 24, 2026 is 19,12 / share. Previously, on May 9, 2025, the share price was 15,22 / share. This represents an increase of 25,55% over that period.
Fondens stemningsscore
Fund Sentiment Score (fka Ownership Accumulation Score) finder de aktier, der bliver mest købt af fonde. Det er resultatet af en sofistikeret, multi-faktor kvantitativ model, der identificerer virksomheder med de højeste niveauer af institutionel akkumulering. Scoringsmodellen bruger en kombination af den samlede stigning i oplyste ejere, ændringerne i porteføljeallokeringer i disse ejere og andre målinger. Tallet går fra 0 til 100, hvor højere tal indikerer et højere niveau af akkumulering for sine jævnaldrende, og 50 er gennemsnittet.
Opdateringsfrekvens: Dagligt
Se Ownership Explorer, som giver en liste over højest rangerende virksomheder.
AI+ Ask Fintel’s AI assistant about Levi Strauss & Co..
Select a question to share a public post with an AI-crafted answer.
Thinking of good questions…
13F og NPORT arkivering
Detaljer om 13F-arkivering er gratis. Detaljer om NP-ansøgninger kræver et premium-medlemskab. Grønne rækker angiver nye positioner. Røde rækker angiver lukkede positioner. Klik på linket ikon for at se den fulde transaktionshistorik.
Opgrader
for at låse premium-data op og eksportere til Excel ![]() .
.
| Fil dato | Kilde | Investor | Type | Gennemsnitlig pris (Øst) |
Aktier | Δ Aktier (%) |
Rapporteret Værdi ($1000) |
Δ Værdi (%) |
Port Alloc (%) |
|
|---|---|---|---|---|---|---|---|---|---|---|
| 2026-02-17 | 13F | Royal Bank Of Canada | Put | 100.000 | -33,42 | 2.074 | -40,74 | |||
| 2026-02-17 | 13F | Royal Bank Of Canada | 265.190 | 3,04 | 5.500 | -8,29 | ||||
| 2026-02-17 | 13F | Gotham Asset Management, LLC | 55.748 | 17,78 | 1.156 | 4,90 | ||||
| 2026-02-11 | 13F | Sunrise Financial Services, LLC | 60 | 1 | ||||||
| 2026-02-17 | 13F | Two Sigma Advisers, Lp | 1.877.500 | 371,62 | 38.939 | 319,83 | ||||
| 2026-02-12 | 13F | Loomis Sayles & Co L P | 541.834 | 18,09 | 11.238 | 5,12 | ||||
| 2026-02-09 | 13F | Fisher Asset Management, LLC | 1.184.847 | -3,66 | 24.574 | -14,24 | ||||
| 2026-01-29 | 13F | Rakuten Securities, Inc. | 220 | 5 | ||||||
| 2026-02-12 | 13F | Jane Street Group, Llc | Call | 241.200 | 106,86 | 5.002 | 84,17 | |||
| 2026-02-12 | 13F | Jane Street Group, Llc | 666.719 | -39,52 | 13.828 | -46,17 | ||||
| 2026-02-12 | 13F | Jane Street Group, Llc | Put | 75.400 | 24,63 | 1.564 | 10,93 | |||
| 2025-11-14 | 13F | Caption Management, LLC | Put | 0 | -100,00 | 0 | ||||
| 2026-02-13 | 13F | Schroder Investment Management Group | 0 | -100,00 | 0 | |||||
| 2026-02-17 | 13F | Raymond James Financial Inc | 178.481 | -10,02 | 3.702 | -19,91 | ||||
| 2026-02-11 | 13F | Buckingham Strategic Partners | 0 | -100,00 | 0 | |||||
| 2026-02-20 | 13F | Sunbelt Securities, Inc. | 137 | 0,00 | 3 | -33,33 | ||||
| 2026-02-17 | 13F | Jones Financial Companies Lllp | 18.610 | 183,99 | 386 | 156,67 | ||||
| 2026-03-27 | 13F | Prosperity Wealth Management, Inc. | 0 | -100,00 | 0 | |||||
| 2026-02-13 | 13F | Citigroup Inc | Put | 120.000 | 0,00 | 2.489 | -11,02 | |||
| 2026-04-15 | 13F | FNY Investment Advisers, LLC | Call | 10 | 0 | |||||
| 2026-02-13 | 13F | Citigroup Inc | 18.788 | -30,46 | 390 | -38,16 | ||||
| 2026-02-13 | 13F | Citigroup Inc | Call | 80.000 | 0,00 | 1.659 | -11,00 | |||
| 2026-02-17 | 13F | Janus Henderson Group Plc | 42.325 | 0,00 | 878 | -11,05 | ||||
| 2026-01-30 | 13F | Us Bancorp \de\ | 1.565 | 39,61 | 32 | 23,08 | ||||
| 2026-02-06 | 13F | Gsa Capital Partners Llp | 100.722 | 9,79 | 2 | 0,00 | ||||
| 2026-02-04 | 13F | Swiss Life Asset Management Ltd | 12.316 | 255 | ||||||
| 2026-04-20 | 13F | Ronald Blue Trust, Inc. | 105 | -44,44 | 2 | -66,67 | ||||
| 2026-02-09 | 13F | Legal & General Group Plc | 79.290 | -15,79 | 1.644 | -25,03 | ||||
| 2026-02-17 | 13F | Balyasny Asset Management Llc | 2.693.052 | -22,11 | 55.854 | -30,67 | ||||
| 2026-02-12 | 13F | Aristides Capital LLC | 0 | -100,00 | 0 | |||||
| 2026-02-11 | 13F | MCF Advisors LLC | 1.071 | 0,00 | 22 | -8,33 | ||||
| 2026-04-17 | 13F | Tectonic Advisors Llc | 25.808 | 477 | ||||||
| 2026-02-17 | 13F | Boothbay Fund Management, Llc | 0 | -100,00 | 0 | |||||
| 2026-02-13 | 13F | Bridgefront Capital, LLC | 0 | -100,00 | 0 | |||||
| 2026-02-03 | 13F | CORDA Investment Management, LLC. | 673.592 | 1,01 | 13.970 | -10,09 | ||||
| 2026-02-10 | 13F | Nomura Asset Management Co Ltd | 275.493 | 59,91 | 5.714 | 42,33 | ||||
| 2026-01-23 | 13F | Westside Investment Management, Inc. | 50 | 0,00 | 1 | 0,00 | ||||
| 2026-01-27 | 13F | Asset Management One Co., Ltd. | 5.944 | -94,55 | 125 | -95,08 | ||||
| 2026-02-10 | 13F | Bnp Paribas Arbitrage, Sa | 62.592 | 33,58 | 1.298 | 18,97 | ||||
| 2025-11-14 | 13F | Caption Management, LLC | 0 | -100,00 | 0 | |||||
| 2026-02-05 | 13F | Bessemer Group Inc | 142.267 | 3 | ||||||
| 2026-02-10 | 13F | Goldman Sachs Group Inc | 4.243.680 | 43,99 | 88.014 | 28,17 | ||||
| 2026-01-20 | 13F | Harbor Capital Advisors, Inc. | 27.386 | -1,86 | 1 | |||||
| 2026-02-11 | 13F | Franklin Resources Inc | 626.982 | 3,81 | 13.004 | -7,60 | ||||
| 2026-01-23 | 13F | Assetmark, Inc | 200 | -50,25 | 4 | -55,56 | ||||
| 2026-04-14 | 13F | Twelve Points Wealth Management LLC | 37.603 | -7,80 | 695 | -21,65 | ||||
| 2026-01-26 | 13F | Valmark Advisers, Inc. | 18.794 | 0,00 | 390 | -10,98 | ||||
| 2026-01-28 | 13F | Klp Kapitalforvaltning As | 37.700 | -38,20 | 782 | -45,04 | ||||
| 2025-11-13 | 13F | Qsemble Capital Management, LP | 0 | -100,00 | 0 | |||||
| 2026-02-12 | 13F | Intrinsic Edge Capital Management LLC | Put | 0 | -100,00 | 0 | -100,00 | |||
| 2026-02-10 | 13F | Natixis Advisors, L.p. | 87.628 | 22,38 | 2 | 0,00 | ||||
| 2026-02-17 | 13F | Delaware Management Holdings, Inc. | 1.038.531 | 21.539 | ||||||
| 2026-02-17 | 13F | Advisor Group Holdings, Inc. | 6.429 | -46,80 | 133 | -51,28 | ||||
| 2026-02-17 | 13F | State Of Wisconsin Investment Board | 127.532 | 31,95 | 2.645 | 17,45 | ||||
| 2026-04-23 | 13F | Broad Peak Investment Advisers Pte Ltd | 0 | -100,00 | 0 | |||||
| 2026-02-17 | 13F | California State Teachers Retirement System | 85.472 | -3,10 | 1.773 | -13,77 | ||||
| 2026-02-17 | 13F | Sciencast Management LP | 0 | -100,00 | 0 | |||||
| 2025-11-14 | 13F | Cinctive Capital Management LP | 0 | -100,00 | 0 | |||||
| 2025-11-17 | 13F | Kestra Investment Management, LLC | 0 | -100,00 | 0 | |||||
| 2026-02-12 | 13F | Elo Mutual Pension Insurance Co | 116.765 | 78,93 | 2.422 | 59,28 | ||||
| 2026-02-17 | 13F | Lighthouse Investment Partners, LLC | 38.035 | 789 | ||||||
| 2026-02-10 | 13F | Hillsdale Investment Management Inc. | 0 | -100,00 | 0 | |||||
| 2026-02-13 | 13F | Squarepoint Ops LLC | 0 | -100,00 | 0 | -100,00 | ||||
| 2026-02-17 | 13F | Oberweis Asset Management Inc/ | 993.900 | 10,01 | 20.613 | -2,08 | ||||
| 2026-04-23 | 13F | Marquette Asset Management, LLC | 0 | -100,00 | 0 | |||||
| 2026-02-12 | 13F | Commonwealth Equity Services, Llc | 13.777 | -6,83 | 286 | |||||
| 2026-01-13 | 13F | Corbyn Investment Management Inc/md | 131.404 | -2,34 | 2.725 | -13,08 | ||||
| 2026-02-13 | 13F | Squarepoint Ops LLC | Call | 20.800 | 20,93 | 431 | 7,75 | |||
| 2026-04-16 | 13F | SG Americas Securities, LLC | 33.351 | 91,12 | 1 | |||||
| 2026-04-13 | 13F | True Wealth Design, LLC | 188 | -10,90 | 3 | -25,00 | ||||
| 2026-01-08 | 13F | Grove Bank & Trust | 0 | -100,00 | 0 | |||||
| 2026-02-13 | 13F | State Street Corp | 897.824 | 0,66 | 18.621 | -10,40 | ||||
| 2026-02-17 | 13F | Schonfeld Strategic Advisors LLC | 174.549 | 287,98 | 3.620 | 245,42 | ||||
| 2026-02-17 | 13F | Wellington Management Group Llp | 2.813.006 | -3,52 | 58.342 | -14,12 | ||||
| 2025-11-19 | 13F/A | Danske Bank A/s | 0 | -100,00 | 0 | -100,00 | ||||
| 2026-02-17 | 13F | Cahill Financial Advisors Inc | 15.445 | 0,00 | 320 | -10,86 | ||||
| 2026-01-30 | 13F | Mitsubishi UFJ Trust & Banking Corp | 78.071 | -10,17 | 1.619 | -20,05 | ||||
| 2026-02-13 | 13F | Caitong International Asset Management Co., Ltd | 588 | 58.700,00 | 12 | |||||
| 2026-04-24 | 13F | Root Financial Partners, LLC | 251 | 6,36 | 5 | 0,00 | ||||
| 2026-02-17 | 13F | Osterweis Capital Management Inc | 25.000 | -37,50 | 518 | -44,42 | ||||
| 2026-02-11 | 13F | GW&K Investment Management, LLC | 2.219.599 | 31,52 | 46 | 17,95 | ||||
| 2026-02-11 | 13F | Twin Tree Management, LP | Call | 386.000 | -39,29 | 8.006 | -45,96 | |||
| 2026-02-11 | 13F | Twin Tree Management, LP | Put | 13.200 | -98,21 | 274 | -98,41 | |||
| 2026-02-13 | 13F | Victory Capital Management Inc | 255.937 | 5,01 | 5.308 | -6,52 | ||||
| 2026-02-12 | 13F | Alps Advisors Inc | 21.041 | 1,11 | 436 | -9,92 | ||||
| 2026-02-17 | 13F | Tower Research Capital LLC (TRC) | 100 | -91,46 | 2 | -92,59 | ||||
| 2026-02-17 | 13F | Hook Mill Capital Partners, LP | 0 | -100,00 | 0 | |||||
| 2026-02-11 | 13F | Everett Harris & Co /ca/ | 13.275 | 0,00 | 275 | -11,00 | ||||
| 2026-04-21 | 13F | Nemes Rush Group LLC | 0 | -100,00 | 0 | |||||
| 2026-02-17 | 13F | Northern Trust Corp | 305.822 | -19,09 | 6.343 | -27,98 | ||||
| 2026-02-12 | 13F | Swiss National Bank | 193.100 | -2,18 | 4.005 | -12,94 | ||||
| 2026-02-17 | 13F | Fmr Llc | 70.896 | -94,52 | 1.470 | -95,12 | ||||
| 2026-02-12 | 13F | Wealthspire Advisors, LLC | 0 | -100,00 | 0 | |||||
| 2026-02-11 | 13F | Group One Trading, L.p. | Call | 22.600 | 96,52 | 469 | 75,28 | |||
| 2026-02-11 | 13F | Group One Trading, L.p. | Put | 18.800 | -45,03 | 390 | -51,13 | |||
| 2026-02-13 | 13F | Barclays Plc | 54.116 | 36,69 | 1.122 | 21,69 | ||||
| 2026-02-11 | 13F | Group One Trading, L.p. | 72.957 | -4,99 | 1.513 | -15,43 | ||||
| 2026-02-12 | 13F | MetLife Investment Management, LLC | 521.699 | -0,03 | 10.820 | -11,01 | ||||
| 2026-02-05 | 13F | High Note Wealth, LLC | 600 | 0,00 | 12 | -7,69 | ||||
| 2026-02-17 | 13F | Advisory Services Network, LLC | 0 | -100,00 | 0 | |||||
| 2026-02-13 | 13F | American Century Companies Inc | 384.967 | 12,36 | 7.984 | 0,01 | ||||
| 2026-02-17 | 13F | Mercer Global Advisors Inc /adv | 710.676 | -0,35 | 14.739 | -11,30 | ||||
| 2026-02-10 | 13F | Savant Capital, LLC | 0 | -100,00 | 0 | |||||
| 2026-04-17 | 13F | Vermillion Wealth Management, Inc. | 5 | 0 | ||||||
| 2026-02-11 | 13F | Parallel Advisors, LLC | 24 | 0,00 | 0 | |||||
| 2026-01-28 | 13F | Universal- Beteiligungs- und Servicegesellschaft mbH | 290.349 | 21,57 | 6.068 | 9,06 | ||||
| 2026-01-30 | 13F | Cullinan Associates Inc | 10.000 | 0,00 | 207 | -11,16 | ||||
| 2026-02-13 | 13F | Marshall Wace, Llp | 689.029 | -58,85 | 14.290 | -63,37 | ||||
| 2026-02-17 | 13F | Price T Rowe Associates Inc /md/ | 22.608 | 0,00 | 0 | |||||
| 2026-01-29 | 13F | Comerica Bank | 9.514 | 39,77 | 197 | 24,68 | ||||
| 2026-02-13 | 13F | Mml Investors Services, Llc | 10.056 | 209 | ||||||
| 2026-02-17 | 13F | Ancora Advisors, LLC | 30 | 1 | ||||||
| 2025-11-06 | 13F | Baader Bank INC | 0 | -100,00 | 0 | |||||
| 2025-10-29 | 13F | CFC Planning Co LLC | 0 | -100,00 | 0 | -100,00 | ||||
| 2026-04-21 | 13F | Xcel Wealth Management, LLC | 141.654 | 7,14 | 2.619 | -4,49 | ||||
| 2026-02-13 | 13F | Resources Investment Advisors, LLC. | 10.032 | 208 | ||||||
| 2026-04-07 | 13F | Signaturefd, Llc | 347 | 53,54 | 6 | 50,00 | ||||
| 2026-02-17 | 13F | Lazard Asset Management Llc | 9.799 | 203 | ||||||
| 2025-11-14 | 13F | Walleye Capital LLC | Put | 0 | -100,00 | 0 | -100,00 | |||
| 2026-02-11 | 13F | O'shaughnessy Asset Management, Llc | 13.602 | 11,24 | 282 | -0,70 | ||||
| 2026-01-21 | 13F | Sound Income Strategies, LLC | 186 | -0,53 | 4 | 0,00 | ||||
| 2026-02-04 | 13F | Tsfg, Llc | 0 | -100,00 | 0 | |||||
| 2026-04-15 | 13F | Paragon Capital Management Ltd | 12.723 | -4,40 | 235 | -14,86 | ||||
| 2025-11-14 | 13F | Nbc Securities, Inc. | 0 | -100,00 | 0 | |||||
| 2026-02-05 | 13F | New York Life Investment Management Llc | 0 | -100,00 | 0 | -100,00 | ||||
| 2026-02-13 | 13F | Walleye Capital LLC | 776.892 | 766,55 | 16.113 | 671,65 | ||||
| 2026-02-13 | 13F | Walleye Capital LLC | Call | 32.900 | 682 | |||||
| 2026-02-17 | 13F | Engineers Gate Manager LP | 423.746 | 133,39 | 8.788 | 107,75 | ||||
| 2026-01-29 | 13F | Dunhill Financial, LLC | 2 | 0 | ||||||
| 2026-02-10 | 13F | Envestnet Asset Management Inc | 292.532 | 22,46 | 6.067 | 9,02 | ||||
| 2026-02-03 | 13F | Garner Asset Management Corp | 791 | 16 | ||||||
| 2026-02-17 | 13F | Susquehanna Portfolio Strategies, LLC | 345.742 | 7.171 | ||||||
| 2026-01-16 | 13F | Banque Pictet & Cie Sa | 0 | -100,00 | 0 | |||||
| 2026-02-17 | 13F | Woodline Partners LP | 1.255.671 | 26.043 | ||||||
| 2026-02-17 | 13F | Aristeia Capital Llc | 0 | -100,00 | 0 | |||||
| 2026-02-13 | 13F | SRS Capital Advisors, Inc. | 11 | -99,88 | 0 | -100,00 | ||||
| 2025-11-07 | 13F | Rothschild Investment Llc | 0 | -100,00 | 0 | |||||
| 2026-02-11 | 13F | Deutsche Bank Ag\ | 9.175 | -15,05 | 190 | -24,30 | ||||
| 2026-02-11 | 13F | Picton Mahoney Asset Management | 30.776 | 638 | ||||||
| 2025-11-17 | 13F | Jacobs Levy Equity Management, Inc | 0 | -100,00 | 0 | |||||
| 2026-01-29 | 13F | St. Johns Investment Management Company, LLC | 500 | 0,00 | 10 | -9,09 | ||||
| 2026-02-13 | 13F | Rhumbline Advisers | 2.066 | 0,00 | 43 | -12,50 | ||||
| 2026-02-13 | 13F | First Trust Advisors Lp | 33.690 | -47,57 | 699 | -53,37 | ||||
| 2026-01-29 | 13F | Washington Capital Management Inc | 29.000 | -13,95 | 601 | -23,44 | ||||
| 2026-02-13 | 13F | Quarry LP | 102 | 2 | ||||||
| 2026-02-12 | 13F | Gardner Russo & Quinn Llc | 47.725 | 0,00 | 990 | -10,98 | ||||
| 2026-02-06 | 13F | Pnc Financial Services Group, Inc. | 15.343 | 2,54 | 318 | -8,62 | ||||
| 2025-11-07 | 13F/A | Abn Amro Investment Solutions | 71.602 | 62,00 | 972 | 52,59 | ||||
| 2026-02-13 | 13F | Blueshift Asset Management, LLC | 0 | -100,00 | 0 | |||||
| 2026-04-20 | 13F | Jfs Wealth Advisors, Llc | 54 | 0,00 | 1 | -100,00 | ||||
| 2026-02-10 | 13F | Measured Wealth Private Client Group, LLC | 1.235 | 26 | ||||||
| 2026-02-06 | 13F | Handelsbanken Fonder AB | 36.400 | -21,38 | 1 | -100,00 | ||||
| 2026-02-12 | 13F | Bank Of Montreal /can/ | 10.594 | 220 | ||||||
| 2026-02-06 | 13F | Lsv Asset Management | 5.000 | 0,00 | 0 | |||||
| 2026-02-13 | 13F | Great West Life Assurance Co /can/ | 8.821 | -69,32 | 0 | |||||
| 2026-04-08 | 13F | Wealth Enhancement Advisory Services, Llc | 28.562 | 6,85 | 540 | -6,26 | ||||
| 2026-02-10 | 13F | State of Wyoming | 3.307 | -81,82 | 69 | -83,92 | ||||
| 2026-02-03 | 13F | SBI Securities Co., Ltd. | 381 | 9,80 | 8 | -12,50 | ||||
| 2026-02-17 | 13F | NewSquare Capital LLC | 141.925 | -29,05 | 2.944 | -36,86 | ||||
| 2026-02-04 | 13F | Versor Investments LP | 86.992 | 77,56 | 1.804 | 58,11 | ||||
| 2026-02-17 | 13F | Occudo Quantitative Strategies Lp | 0 | -100,00 | 0 | |||||
| 2026-02-13 | 13F | Pinpoint Asset Management (Singapore) Pte. Ltd. | 18.139 | 376 | ||||||
| 2026-02-11 | 13F | Hall Kathryn A. | 0 | -100,00 | 0 | |||||
| 2026-02-12 | 13F | Ci Investments Inc. | 0 | -100,00 | 0 | |||||
| 2025-11-14 | 13F | Adage Capital Partners Gp, L.l.c. | 0 | -100,00 | 0 | |||||
| 2026-02-12 | 13F | Dimensional Fund Advisors Lp | 1.700.840 | 4,55 | 35.279 | -6,93 | ||||
| 2026-01-08 | 13F | M. Kulyk & Associates, LLC | 524.975 | 0,00 | 10.888 | -10,99 | ||||
| 2025-11-03 | 13F | Mirae Asset Global Investments Co., Ltd. | 0 | -100,00 | 0 | |||||
| 2026-02-11 | 13F | Illinois Municipal Retirement Fund | 187.338 | 60,21 | 3.885 | 42,62 | ||||
| 2026-02-17 | 13F | Verdad Advisers, LP | 10.448 | 217 | ||||||
| 2026-01-26 | 13F | KBC Group NV | 98.944 | -9,57 | 2 | 0,00 | ||||
| 2026-01-29 | 13F | IMC-Chicago, LLC | Put | 123.400 | 34,42 | 2.559 | 19,69 | |||
| 2026-01-29 | 13F | IMC-Chicago, LLC | Call | 127.800 | 4,33 | 2.651 | -7,15 | |||
| 2025-11-12 | 13F | Headlands Technologies LLC | 0 | -100,00 | 0 | |||||
| 2026-02-11 | 13F | Winton Capital Group Ltd | 13.800 | 286 | ||||||
| 2026-02-13 | 13F | Ubs Asset Management Americas Inc | 1.850.141 | -3,07 | 38.372 | -13,72 | ||||
| 2026-02-17 | 13F | Russell Investments Group, Ltd. | 22.717 | 53,04 | 471 | 36,52 | ||||
| 2026-02-17 | 13F | Brevan Howard Capital Management LP | 53.546 | -53,97 | 1.111 | -59,04 | ||||
| 2026-02-20 | 13F | SB Capital Management Inc | 97.549 | 2.023 | ||||||
| 2026-01-22 | 13F | Ofi Invest Asset Management | 1.428.929 | -2,49 | 25.234 | -13,16 | ||||
| 2025-11-14 | 13F | Cubist Systematic Strategies, LLC | 429.361 | 10.004 | ||||||
| 2026-02-10 | 13F | Jupiter Asset Management Ltd | 69.875 | 1.449 | ||||||
| 2026-02-04 | 13F | Virginia Retirement Systems Et Al | 53.550 | 1.111 | ||||||
| 2026-01-28 | 13F | Teacher Retirement System Of Texas | 96.394 | 19,18 | 1.999 | 6,10 | ||||
| 2025-11-14 | 13F | Interval Partners, LP | 0 | -100,00 | 0 | |||||
| 2026-02-11 | 13F | Simplex Trading, Llc | Put | 66.900 | -59,82 | 1.388 | 46.133,33 | |||
| 2026-02-11 | 13F | Simplex Trading, Llc | Call | 126.800 | 7,55 | 2.630 | 131.350,00 | |||
| 2026-04-21 | 13F | Financial Consulate, Inc | 321 | 0,00 | 6 | -16,67 | ||||
| 2026-02-06 | 13F | EverSource Wealth Advisors, LLC | 569 | 4,21 | 12 | -8,33 | ||||
| 2026-02-12 | 13F | Hrt Financial Lp | 310.397 | 6 | ||||||
| 2026-02-13 | 13F | Stifel Financial Corp | 224.636 | 35,48 | 4.659 | 20,61 | ||||
| 2026-02-10 | 13F | Quantbot Technologies LP | 104.527 | 2.168 | ||||||
| 2026-02-13 | 13F | Sirios Capital Management L P | 47.332 | 36,39 | 982 | 21,41 | ||||
| 2026-02-05 | 13F | Thrivent Financial For Lutherans | 243.971 | 5 | ||||||
| 2025-11-14 | 13F | Twinbeech Capital Lp | 0 | -100,00 | 0 | |||||
| 2026-02-12 | 13F | Aviva Plc | 30.163 | 0,00 | 626 | -10,97 | ||||
| 2026-02-12 | 13F | BlackRock, Inc. | 3.288.734 | 22,39 | 68.208 | 8,94 | ||||
| 2026-02-11 | 13F | LPL Financial LLC | 44.778 | -13,33 | 929 | -22,86 | ||||
| 2026-01-08 | 13F | Signet Financial Management, Llc | 15.776 | 0,04 | 327 | -10,90 | ||||
| 2026-02-12 | 13F | Quadrant Capital Group Llc | 1.017 | 0,00 | 21 | -8,70 | ||||
| 2025-11-13 | 13F | Wells Fargo & Company/mn | Put | 0 | -100,00 | 0 | -100,00 | |||
| 2026-02-17 | 13F | DV Trading LLC | 300 | 6 | ||||||
| 2026-02-13 | 13F | Intrepid Capital Management Inc | 97.860 | 0,00 | 2.030 | -11,01 | ||||
| 2026-02-12 | 13F | Nuveen, LLC | 261.406 | 2,51 | 5.422 | -8,75 | ||||
| 2026-04-24 | 13F | Keybank National Association/oh | 108.903 | -4,95 | 2.014 | -15,28 | ||||
| 2026-02-11 | 13F | Brandes Investment Partners, Lp | 110.507 | 22,87 | 2.292 | 9,36 | ||||
| 2026-02-06 | 13F | Leonteq Securities AG | 81 | 0,00 | 2 | 0,00 | ||||
| 2026-02-13 | 13F | Charles Schwab Investment Management Inc | 999.696 | -5,56 | 20.734 | -15,94 | ||||
| 2026-02-17 | 13F | Captrust Financial Advisors | 10.041 | 208 | ||||||
| 2026-01-28 | 13F | Arizona State Retirement System | 27.327 | -9,32 | 567 | -19,37 | ||||
| 2026-02-13 | 13F | Bridgewater Associates, LP | 0 | -100,00 | 0 | |||||
| 2026-02-12 | 13F | Principal Securities, Inc. | 0 | -100,00 | 0 | -100,00 | ||||
| 2026-02-12 | 13F | Counterpoint Mutual Funds LLC | 0 | -100,00 | 0 | |||||
| 2025-11-14 | 13F | Capstone Investment Advisors, Llc | 0 | -100,00 | 0 | -100,00 | ||||
| 2026-02-17 | 13F | Armistice Capital, Llc | 185.000 | 11,15 | 3.837 | -1,08 | ||||
| 2026-04-07 | 13F | Farther Finance Advisors, LLC | 11.135 | 26,63 | 212 | 15,93 | ||||
| 2026-02-17 | 13F | Tabor Asset Management, LP | 0 | -100,00 | 0 | |||||
| 2026-02-17 | 13F | XTX Topco Ltd | 78.728 | 83,46 | 1.633 | 63,36 | ||||
| 2026-02-02 | 13F | Truist Financial Corp | 38.088 | -64,19 | 790 | -68,16 | ||||
| 2026-02-12 | 13F | Adviser Investments LLC | 11.905 | 247 | ||||||
| 2026-02-13 | 13F | MAI Capital Management | 82 | 2 | ||||||
| 2026-04-23 | 13F | SJS Investment Consulting Inc. | 8 | 0,00 | 0 | |||||
| 2026-02-03 | 13F | Bokf, Na | 0 | -100,00 | 0 | |||||
| 2026-02-19 | 13F | Invesco Ltd. | 178.045 | 2,42 | 3.693 | -8,84 | ||||
| 2026-04-24 | 13F | Capricorn Fund Managers Ltd | 165.000 | 3.051 | ||||||
| 2026-02-12 | 13F | Cloud Capital Management, LLC | 0 | -100,00 | 0 | |||||
| 2026-02-13 | 13F | National Bank Of Canada /fi/ | 8.027 | -11,95 | 166 | -21,70 | ||||
| 2026-01-29 | 13F | Sanctuary Advisors, LLC | 0 | -100,00 | 0 | -100,00 | ||||
| 2026-02-13 | 13F | Change Path, LLC | 30.975 | -5,79 | 642 | -16,19 | ||||
| 2026-04-21 | 13F | Pallas Capital Advisors LLC | 22.314 | -4,54 | 413 | -14,88 | ||||
| 2026-02-17 | 13F | Millennium Management Llc | 1.548.184 | -49,63 | 32.109 | -55,16 | ||||
| 2026-02-13 | 13F | Dai-Ichi Life Insurance Company, Ltd | 0 | -100,00 | 0 | |||||
| 2026-01-26 | 13F | Cwm, Llc | 38.996 | -0,03 | 1 | |||||
| 2025-11-18 | 13F | Boyar Asset Management Inc. | 0 | -100,00 | 0 | |||||
| 2026-04-24 | 13F | Syntax Research, Inc. | 1.006 | 0,60 | 19 | -10,00 | ||||
| 2026-02-11 | 13F | Cedar Mountain Advisors, LLC | 350 | 0,00 | 7 | -12,50 | ||||
| 2026-02-17 | 13F | Magnetar Financial LLC | 0 | -100,00 | 0 | |||||
| 2026-02-13 | 13F | Sei Investments Co | 84.809 | 14,45 | 1.759 | 1,85 | ||||
| 2026-02-13 | 13F | Bragg Financial Advisors, Inc | 947.376 | 0,29 | 19.649 | -10,73 | ||||
| 2026-02-13 | 13F | BNP Paribas Asset Management Holding S.A. | 1.642 | 0 | ||||||
| 2025-11-17 | 13F | Abel Hall, LLC | 0 | -100,00 | 0 | |||||
| 2026-02-13 | 13F | Caxton Associates Llp | 18.096 | 74,94 | 375 | 55,60 | ||||
| 2026-02-17 | 13F | Atom Investors LP | 0 | -100,00 | 0 | |||||
| 2026-02-17 | 13F | Capital Fund Management S.a. | 149.157 | 3.094 | ||||||
| 2026-02-13 | 13F | Arrowstreet Capital, Limited Partnership | 120.355 | 2.496 | ||||||
| 2026-02-11 | 13F | First Command Advisory Services, Inc. | 3.835 | 0,00 | 80 | -11,24 | ||||
| 2026-02-13 | 13F | Mariner, LLC | 15.939 | 19,97 | 330 | 6,80 | ||||
| 2026-02-27 | 13F/A | Barclays Plc | Put | 0 | -100,00 | 0 | -100,00 | |||
| 2026-02-11 | 13F | Inceptionr Llc | 20.743 | 430 | ||||||
| 2026-02-17 | 13F | Ameriprise Financial Inc | 1.570.705 | -12,16 | 32.576 | -21,81 | ||||
| 2026-04-14 | 13F | Beacon Investment Advisory Services, Inc. | 100 | 2 | ||||||
| 2025-11-14 | 13F | Skopos Labs, Inc. | 0 | -100,00 | 0 | |||||
| 2026-01-29 | 13F | Vanguard Group Inc | 9.320.747 | 3,81 | 193.312 | -7,60 | ||||
| 2026-02-12 | 13F | Brinker Capital Investments, LLC | 55.192 | 30,20 | 1.145 | 15,91 | ||||
| 2026-02-11 | 13F | Cerity Partners LLC | 101.598 | 12,53 | 2.107 | 0,19 | ||||
| 2026-02-03 | 13F | F/M Investments LLC | 95.501 | -4,48 | 1.981 | -14,98 | ||||
| 2026-02-12 | 13F | Senvest Management, LLC | 160.000 | 3.318 | ||||||
| 2026-02-12 | 13F | Intrinsic Edge Capital Management LLC | 450.000 | -29,71 | 9.333 | -37,43 | ||||
| 2026-01-15 | 13F | Hara Capital LLC | 855 | -14,07 | 18 | -26,09 | ||||
| 2026-02-13 | 13F | Neuberger Berman Group LLC | 18.884 | 9,85 | 392 | -2,25 | ||||
| 2026-02-09 | 13F | Geode Capital Management, Llc | 1.246.154 | -0,21 | 25.854 | -11,17 | ||||
| 2025-11-14 | 13F | Capula Management Ltd | 0 | -100,00 | 0 | |||||
| 2026-02-13 | 13F | Landscape Capital Management, L.l.c. | 74.019 | -58,74 | 1.535 | -63,27 | ||||
| 2026-04-07 | 13F | CoreCap Advisors, LLC | 28 | 0,00 | 1 | |||||
| 2026-02-13 | 13F | Manufacturers Life Insurance Company, The | 1.521.985 | -29,44 | 31.566 | -37,19 | ||||
| 2025-11-13 | 13F | Bnp Paribas Arbitrage, Sa | Put | 0 | -100,00 | 0 | -100,00 | |||
| 2026-02-11 | 13F | Manchester Capital Management LLC | 37 | 1 | ||||||
| 2026-02-13 | 13F | Toroso Investments, LLC | 38.360 | -34,66 | 796 | -41,84 | ||||
| 2026-04-10 | 13F | Field & Main Bank | 300 | 0,00 | 6 | -16,67 | ||||
| 2026-02-09 | 13F | Beck Bode, LLC | 15.494 | 321 | ||||||
| 2026-02-10 | 13F/A | Northwestern Mutual Wealth Management Co | 1.183 | -16,98 | 25 | -27,27 | ||||
| 2026-01-30 | 13F | Bogart Wealth, LLC | 1.000 | 0,00 | 21 | -13,04 | ||||
| 2026-02-14 | 13F | Rockefeller Capital Management L.P. | 7.922 | -1,81 | 164 | -12,30 | ||||
| 2026-03-06 | 13F | Hsbc Holdings Plc | 90.473 | 1.887 | ||||||
| 2026-04-08 | 13F | DiNuzzo Private Wealth, Inc. | 11 | 0,00 | 0 | |||||
| 2026-02-17 | 13F | Trexquant Investment LP | 324.963 | -49,57 | 6.740 | -55,12 | ||||
| 2026-02-17 | 13F | Cetera Investment Advisers | 24.993 | 0,26 | 518 | -10,69 | ||||
| 2026-02-17 | 13F | Man Group plc | 462.731 | 166,25 | 9.597 | 137,02 | ||||
| 2026-02-17 | 13F | Man Group plc | Put | 15.700 | -12,78 | 326 | -22,43 | |||
| 2025-11-13 | 13F | Hudson Bay Capital Management LP | Put | 0 | -100,00 | 0 | ||||
| 2026-02-17 | 13F | Man Group plc | Call | 15.700 | -12,78 | 326 | -22,43 | |||
| 2025-11-17 | 13F | Alyeska Investment Group, L.P. | 0 | -100,00 | 0 | -100,00 | ||||
| 2026-02-17 | 13F | Qube Research & Technologies Ltd | 1.720.311 | -9,92 | 35.679 | -19,82 | ||||
| 2026-02-10 | 13F | Globeflex Capital L P | 163.492 | 0,00 | 3.391 | -11,00 | ||||
| 2026-01-14 | 13F | Hunter Perkins Capital Management, LLC | 19.925 | -21,79 | 0 | |||||
| 2026-03-12 | 13F/A | Peak6 Llc | Call | 487.700 | -7,21 | 10.115 | -17,41 | |||
| 2026-03-12 | 13F/A | Peak6 Llc | Put | 481.900 | -2,07 | 9.995 | -12,83 | |||
| 2025-11-14 | 13F | MIRAE ASSET GLOBAL ETFS HOLDINGS Ltd. | 0 | -100,00 | 0 | |||||
| 2026-04-07 | 13F | Park Avenue Securities Llc | 12.475 | 6,36 | 0 | |||||
| 2026-04-15 | 13F | Fortitude Family Office, LLC | 64 | 120,69 | 1 | |||||
| 2026-03-31 | 13F/A | Barclays Plc | Call | 0 | -100,00 | 0 | -100,00 | |||
| 2026-02-13 | 13F | Walleye Trading LLC | Put | 22.200 | 48,00 | 460 | 31,81 | |||
| 2026-02-13 | 13F | Walleye Trading LLC | Call | 46.600 | 35,47 | 966 | 20,60 | |||
| 2026-02-09 | 13F | Hartland & Co., LLC | 283 | -81,12 | 6 | -85,29 | ||||
| 2026-04-01 | 13F | BancFirst Trust & Investment Management | 165.130 | 0,00 | 2.999 | -13,85 | ||||
| 2026-02-13 | 13F | Walleye Trading LLC | 359 | -99,56 | 7 | -99,63 | ||||
| 2026-02-17 | 13F | Portolan Capital Management, LLC | 0 | -100,00 | 0 | |||||
| 2025-11-14 | 13F | Peak6 Llc | 0 | -100,00 | 0 | -100,00 | ||||
| 2025-11-14 | 13F | Point72 Hong Kong Ltd | 52.768 | 18.678,65 | 1.229 | 24.480,00 | ||||
| 2025-11-03 | 13F | TD Waterhouse Canada Inc. | 0 | -100,00 | 0 | |||||
| 2026-04-14 | 13F | Bay Harbor Wealth Management, LLC | 10 | -23,08 | 0 | |||||
| 2025-10-29 | 13F | Caldwell Securities, Inc | 0 | -100,00 | 0 | |||||
| 2026-02-13 | 13F | Maverick Capital Ltd | 0 | -100,00 | 0 | |||||
| 2026-02-17 | 13F | Citadel Advisors Llc | 1.764.423 | -16,73 | 36.594 | -25,88 | ||||
| 2026-02-11 | 13F | Fox Run Management, L.l.c. | 66.170 | 1.372 | ||||||
| 2025-11-14 | 13F | Oxford Asset Management Llp | 0 | -100,00 | 0 | -100,00 | ||||
| 2026-04-23 | 13F | North Star Investment Management Corp. | 416 | 0,24 | 8 | -12,50 | ||||
| 2026-02-12 | 13F | CIBC Private Wealth Group, LLC | 421 | 0,00 | 9 | -11,11 | ||||
| 2026-02-13 | 13F | Alerus Financial Na | 225 | 0,00 | 5 | -20,00 | ||||
| 2026-02-17 | 13F | Citadel Advisors Llc | Put | 264.300 | -4,69 | 5.482 | -15,17 | |||
| 2026-02-17 | 13F | Citadel Advisors Llc | Call | 127.700 | 54,79 | 2.648 | 37,77 | |||
| 2026-02-17 | 13F | Amundi | 10.865 | 225 | ||||||
| 2026-02-17 | 13F | Alliancebernstein L.p. | 0 | -100,00 | 0 | |||||
| 2026-02-02 | 13F | Montag A & Associates Inc | 2.013 | 0,00 | 42 | -10,87 | ||||
| 2026-01-27 | 13F | Zurcher Kantonalbank (Zurich Cantonalbank) | 28.943 | 6,30 | 600 | -5,36 | ||||
| 2026-02-13 | 13F | Ieq Capital, Llc | 62.309 | -13,00 | 1.292 | -22,54 | ||||
| 2026-02-17 | 13F | Schonfeld Strategic Advisors LLC | Put | 0 | -100,00 | 0 | ||||
| 2026-02-17 | 13F | Schonfeld Strategic Advisors LLC | Call | 0 | -100,00 | 0 | ||||
| 2026-01-15 | 13F | Allspring Global Investments Holdings, LLC | 1.177.189 | -7,27 | 24.509 | -20,87 | ||||
| 2026-01-23 | 13F | Optima Capital Llc | 25 | 1 | ||||||
| 2026-04-23 | 13F | Oppenheimer & Co Inc | 77.530 | -0,43 | 1.434 | -11,21 | ||||
| 2026-04-22 | 13F | Figure 8 Investment Strategies Llc | 51.226 | 0,56 | 947 | -10,32 | ||||
| 2026-02-17 | 13F | Aqr Capital Management Llc | 682.189 | 3,33 | 14.149 | -8,03 | ||||
| 2026-02-12 | 13F | Hikari Tsushin, Inc. | 0 | -100,00 | 0 | |||||
| 2026-02-17 | 13F | Voloridge Investment Management, Llc | 63.850 | 1.324 | ||||||
| 2026-02-11 | 13F | Jensen Investment Management Inc | 118.640 | -13,57 | 2.461 | -23,08 | ||||
| 2026-02-13 | 13F | Aigen Investment Management, Lp | 0 | -100,00 | 0 | |||||
| 2026-02-17 | 13F | Financial Avengers, Inc. | 1.250 | 0,00 | 29 | 0,00 | ||||
| 2026-02-17 | 13F | Susquehanna International Group, Llp | 38.495 | -39,31 | 798 | -45,97 | ||||
| 2026-02-17 | 13F | Susquehanna International Group, Llp | Put | 190.500 | -54,35 | 3.951 | -59,37 | |||
| 2026-02-17 | 13F | Bank Of America Corp /de/ | 1.813.794 | 7,32 | 37.618 | -4,47 | ||||
| 2026-02-17 | 13F | Susquehanna International Group, Llp | Call | 433.100 | -8,47 | 8.982 | -18,53 | |||
| 2026-02-13 | 13F | Formula Growth Ltd | 0 | -100,00 | 0 | |||||
| 2025-11-14 | 13F | Point72 Europe (London) LLP | 9.860 | 230 | ||||||
| 2026-02-13 | 13F | Golden State Wealth Management, LLC | 1.129 | 0,71 | 23 | -11,54 | ||||
| 2026-02-13 | 13F | Ceredex Value Advisors LLC | 0 | -100,00 | 0 | |||||
| 2026-02-11 | 13F | Empowered Funds, LLC | 0 | -100,00 | 0 | |||||
| 2026-02-02 | 13F | Fifth Third Bancorp | 5 | 0,00 | 0 | |||||
| 2026-02-18 | 13F | EP Wealth Advisors, Inc. | 15.001 | 1,43 | 311 | 13,92 | ||||
| 2026-04-08 | 13F | Thompson Investment Management, Inc. | 30.500 | 0,00 | 564 | -10,92 | ||||
| 2025-11-14 | 13F | Credit Agricole S A | 0 | -100,00 | 0 | -100,00 | ||||
| 2026-02-17 | 13F | Tudor Investment Corp Et Al | 528.681 | -19,73 | 10.965 | -28,55 | ||||
| 2026-02-17 | 13F | Tudor Investment Corp Et Al | Call | 12.500 | 259 | |||||
| 2026-02-09 | 13F | Keating Financial Advisory Services, Inc. | 46 | 1 | ||||||
| 2026-02-17 | 13F | Point72 Asset Management, L.P. | 1.063.727 | -6,81 | 22.062 | -17,05 | ||||
| 2026-02-12 | 13F | Federation des caisses Desjardins du Quebec | 15.069 | 1,85 | 312 | -9,30 | ||||
| 2026-02-17 | 13F | Two Sigma Investments, Lp | 2.221.475 | 247,74 | 46.073 | 209,55 | ||||
| 2026-02-11 | 13F | Los Angeles Capital Management Llc | 499 | 10 | ||||||
| 2026-02-13 | 13F | Morgan Stanley | 1.516.884 | -3,51 | 31.460 | -14,11 | ||||
| 2025-10-27 | 13F | Janney Montgomery Scott LLC | 0 | -100,00 | 0 | |||||
| 2026-02-17 | 13F | Dark Forest Capital Management Lp | 42.356 | 81,35 | 878 | 61,40 | ||||
| 2026-02-13 | 13F | Verition Fund Management LLC | 81.200 | -64,89 | 1.684 | -68,75 | ||||
| 2025-12-15 | 13F | FNY Investment Advisers, LLC | 0 | -100,00 | 0 | |||||
| 2026-02-02 | 13F | Savoir Faire Capital Management, L.P. | 68.680 | -63,61 | 1.424 | -67,61 | ||||
| 2026-02-17 | 13F | Cape Investment Advisory, Inc. | 1.000 | 21 | ||||||
| 2026-02-11 | 13F | Westerkirk Capital Inc. | 0 | -100,00 | 0 | |||||
| 2026-02-04 | 13F | Ameritas Advisory Services, LLC | 0 | -100,00 | 0 | |||||
| 2026-02-13 | 13F | Natixis | 0 | -100,00 | 0 | |||||
| 2026-04-15 | 13F | Redhawk Wealth Advisors, Inc. | 0 | -100,00 | 0 | |||||
| 2026-02-13 | 13F | Y-Intercept (Hong Kong) Ltd | 185.794 | 484,79 | 3.853 | 420,68 | ||||
| 2026-02-13 | 13F | Kestra Advisory Services, LLC | 1.898 | 39 | ||||||
| 2026-02-13 | 13F | Ubs Oconnor Llc | 0 | -100,00 | 0 | |||||
| 2026-04-06 | 13F | Versant Capital Management, Inc | 131 | 33,67 | 2 | 0,00 | ||||
| 2025-11-14 | 13F | Corton Capital Inc. | 0 | -100,00 | 0 | |||||
| 2026-01-29 | 13F | UBS Group AG | 1.566.880 | 24,62 | 32.497 | 10,93 | ||||
| 2026-02-09 | 13F | Quest Partners LLC | 89.880 | 32,69 | 1.864 | 18,12 | ||||
| 2026-02-17 | 13F | D. E. Shaw & Co., Inc. | 1.266.550 | -50,32 | 26.268 | -55,78 | ||||
| 2025-11-17 | 13F | Sender Co & Partners, Inc. | 0 | -100,00 | 0 | |||||
| 2026-02-17 | 13F | D. E. Shaw & Co., Inc. | Put | 20.000 | 0,00 | 415 | -11,16 | |||
| 2026-02-18 | 13F | GWM Advisors LLC | 120 | 0,00 | 2 | 0,00 | ||||
| 2026-02-17 | 13F | D. E. Shaw & Co., Inc. | Call | 52.900 | -76,27 | 1.097 | -78,88 | |||
| 2026-02-17 | 13F | Algert Global Llc | 615.655 | 3,81 | 13 | -7,69 | ||||
| 2026-02-17 | 13F | Capital Fund Management S.a. | Call | 68.300 | -31,22 | 1.417 | -38,78 | |||
| 2026-02-05 | 13F | Allworth Financial LP | 966 | 16,53 | 20 | 5,26 | ||||
| 2026-02-17 | 13F | Capital Fund Management S.a. | Put | 79.600 | -5,01 | 1.651 | -15,47 | |||
| 2026-02-17 | 13F | Jain Global LLC | 54.558 | 448,98 | 1.132 | 389,61 | ||||
| 2026-02-17 | 13F | Quadrature Capital Ltd | 11.373 | 236 | ||||||
| 2026-02-17 | 13F | Mork Capital Management, LLC | 58.200 | 0,00 | 1.207 | -10,99 | ||||
| 2026-02-10 | 13F | Acadian Asset Management Llc | 250.555 | 144,22 | 5 | 150,00 | ||||
| 2026-04-22 | 13F | Pictet Asset Management Holding SA | 15.084 | 18,94 | 279 | 5,70 | ||||
| 2026-01-12 | 13F | Rialto Wealth Management, LLC | 6 | 0,00 | 0 | |||||
| 2026-02-10 | 13F | Bank of New York Mellon Corp | 860.638 | -5,48 | 17.850 | -15,87 | ||||
| 2026-01-13 | 13F | Matrix Trust Co | 0 | -100,00 | 0 | |||||
| 2026-04-13 | 13F | IFP Advisors, Inc | 7.773 | 233,89 | 144 | 197,92 | ||||
| 2026-02-12 | 13F | DRW Securities, LLC | 0 | -100,00 | 0 | -100,00 | ||||
| 2026-04-23 | 13F | Oppenheimer Asset Management Inc. | 59.823 | 27,29 | 1.106 | 13,55 | ||||
| 2026-02-17 | 13F | Two Sigma Securities, Llc | 0 | -100,00 | 0 | |||||
| 2026-02-17 | 13F | Grantham, Mayo, Van Otterloo & Co. LLC | 18.703 | 388 | ||||||
| 2026-02-13 | 13F | Entropy Technologies, LP | 49.558 | 148,16 | 1.028 | 120,86 | ||||
| 2026-02-17 | 13F | Aquatic Capital Management LLC | 91.856 | 70,78 | 1.905 | 52,04 | ||||
| 2026-02-17 | 13F | Jump Financial, LLC | 459.541 | 4.127,22 | 9.531 | 3.666,80 | ||||
| 2026-02-13 | 13F | Cornerstone Financial Management LLC | 55 | 1 | ||||||
| 2026-02-13 | 13F | Dynamic Technology Lab Private Ltd | 77.256 | 131,86 | 1.602 | 106,44 | ||||
| 2026-02-13 | 13F | Macquarie Group Ltd | 4.042 | -99,63 | 84 | -99,67 | ||||
| 2025-11-14 | 13F | Nomura Holdings Inc | 0 | -100,00 | 0 | -100,00 | ||||
| 2026-02-17 | 13F | PDT Partners, LLC | 302.451 | -10,35 | 6.273 | -20,20 | ||||
| 2026-02-13 | 13F | Wells Fargo & Company/mn | 132.304 | 0,35 | 2.744 | -10,68 | ||||
| 2026-02-11 | 13F | Investors Towarzystwo Funduszy Inwestycyjnych Spolka Akcyjna | 16.400 | 340 | ||||||
| 2026-02-05 | 13F | HFM Investment Advisors, LLC | 6 | 0,00 | 0 | |||||
| 2026-04-17 | 13F | Bell Investment Advisors, Inc | 400 | 0,00 | 7 | -12,50 | ||||
| 2025-11-13 | 13F | Riggs Asset Managment Co. Inc. | 0 | -100,00 | 0 | |||||
| 2026-02-11 | 13F | Jpmorgan Chase & Co | 5.035.033 | 312,39 | 104.427 | 267,09 | ||||
| 2026-02-11 | 13F | Jpmorgan Chase & Co | Put | 267.500 | 0,00 | 5.548 | -10,99 |