Grundlæggende statistik
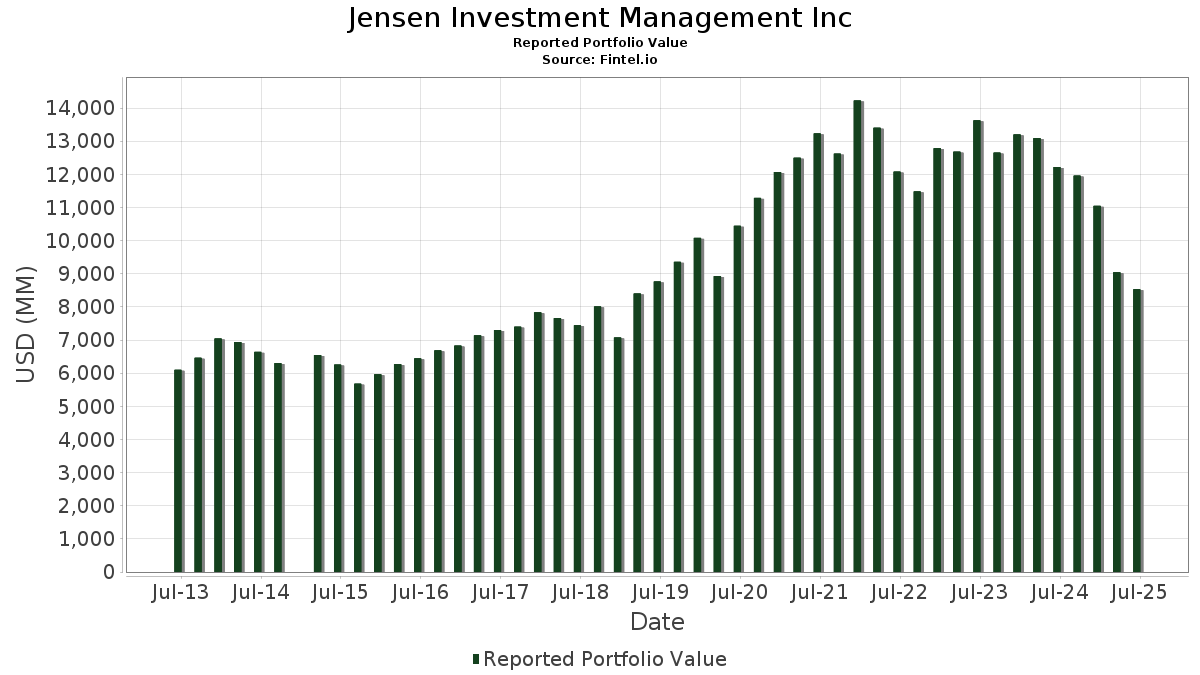
| Porteføljeværdi | $ 6.355.926.761 |
| Nuværende stillinger | 89 |
Seneste beholdninger, ydeevne, AUM (fra 13F, 13D)
Jensen Investment Management Inc har afsløret 89 samlede besiddelser i deres seneste SEC-arkivering. Den seneste porteføljeværdi er beregnet til at være $ 6.355.926.761 USD. Faktiske aktiver under forvaltning (AUM) er denne værdi plus kontanter (som ikke er oplyst). Jensen Investment Management Incs største beholdninger er Microsoft Corporation (US:MSFT) , Apple Inc. (US:AAPL) , Alphabet Inc. (US:GOOG) , NVIDIA Corporation (US:NVDA) , and Mastercard Incorporated (US:MA) . Jensen Investment Management Incs nye stillinger omfatter Amazon.com, Inc. (US:AMZN) , Motorola Solutions, Inc. (US:MSI) , Broadcom Inc. (US:AVGO) , Trust For Professional Managers - Jensen Quality Growth ETF (US:JGRW) , and Bajaj Finance Ltd. (US:BJJQY) .
Top øger dette kvartal
Vi bruger ændringen i porteføljeallokeringen, fordi dette er den mest meningsfulde metrik. Ændringer kan skyldes handler eller ændringer i aktiekurser.
| Sikkerhed | Aktier (MM) |
Værdi (MM$) |
Portefølje % | ΔPortefølje % |
|---|---|---|---|---|
| AMZN / Amazon.com, Inc. | 1,13 | 261,67 | 4,1170 | 4,1170 |
| GOOG / Alphabet Inc. | 1,53 | 479,58 | 7,5454 | 2,1420 |
| NVDA / NVIDIA Corporation | 2,25 | 420,32 | 6,6131 | 1,6118 |
| AAPL / Apple Inc. | 1,98 | 537,81 | 8,4616 | 1,1844 |
| MSI / Motorola Solutions, Inc. | 0,18 | 67,17 | 1,0568 | 1,0568 |
| AVGO / Broadcom Inc. | 0,18 | 61,76 | 0,9717 | 0,9717 |
| WM / Waste Management, Inc. | 1,00 | 219,81 | 3,4584 | 0,4810 |
| MSFT / Microsoft Corporation | 1,33 | 641,69 | 10,0959 | 0,3306 |
| SHW / The Sherwin-Williams Company | 0,62 | 200,34 | 3,1519 | 0,3008 |
| VRSK / Verisk Analytics, Inc. | 0,45 | 99,68 | 1,5682 | 0,2430 |
Top falder i dette kvartal
Vi bruger ændringen i porteføljeallokeringen, fordi dette er den mest meningsfulde metrik. Ændringer kan skyldes handler eller ændringer i aktiekurser.
| Sikkerhed | Aktier (MM) |
Værdi (MM$) |
Portefølje % | ΔPortefølje % |
|---|---|---|---|---|
| MMC / Marsh & McLennan Companies, Inc. | 1,08 | 201,16 | 3,1650 | -2,8532 |
| INTU / Intuit Inc. | 0,27 | 180,83 | 2,8450 | -1,7052 |
| CPRT / Copart, Inc. | 2,17 | 84,90 | 1,3357 | -1,6015 |
| SYK / Stryker Corporation | 0,73 | 257,12 | 4,0453 | -1,5510 |
| APH / Amphenol Corporation | 0,23 | 31,15 | 0,4901 | -0,8450 |
| ADP / Automatic Data Processing, Inc. | 0,63 | 163,02 | 2,5649 | -0,8017 |
| ACN / Accenture plc | 0,07 | 17,82 | 0,2804 | -0,6770 |
| BR / Broadridge Financial Solutions, Inc. | 0,77 | 171,72 | 2,7017 | -0,5487 |
| VEEV / Veeva Systems Inc. | 0,31 | 68,92 | 1,0844 | -0,4431 |
| EFX / Equifax Inc. | 0,82 | 178,89 | 2,8145 | -0,4402 |
13F og Fondsarkivering
Denne formular blev indsendt den 2026-02-11 for rapporteringsperioden 2025-12-31. Klik på linkikonet for at se den fulde transaktionshistorik.
Opgrader for at låse op for premium-data og eksportere til Excel ![]() .
.
| Sikkerhed | Type | Gennemsnitlig aktiekurs | Aktier (MM) |
Δ Aktier (%) |
Værdi ($MM) |
Δ Aktier (%) |
Portefølje (%) |
ΔPortefølje (%) |
|
|---|---|---|---|---|---|---|---|---|---|
| MSFT / Microsoft Corporation | 1,33 | -12,68 | 641,69 | -18,46 | 10,0959 | 0,3306 | |||
| AAPL / Apple Inc. | 1,98 | -14,11 | 537,81 | -8,30 | 8,4616 | 1,1844 | |||
| GOOG / Alphabet Inc. | 1,53 | -14,46 | 479,58 | 10,13 | 7,5454 | 2,1420 | |||
| NVDA / NVIDIA Corporation | 2,25 | 4,33 | 420,32 | 4,28 | 6,6131 | 1,6118 | |||
| MA / Mastercard Incorporated | 0,48 | -16,99 | 275,59 | -16,69 | 4,3359 | 0,2315 | |||
| LLY / Eli Lilly and Company | 0,25 | -46,13 | 268,48 | -24,12 | 4,2242 | -0,1663 | |||
| AMZN / Amazon.com, Inc. | 1,13 | 261,67 | 4,1170 | 4,1170 | |||||
| SYK / Stryker Corporation | 0,73 | -40,04 | 257,12 | -42,99 | 4,0453 | -1,5510 | |||
| META / Meta Platforms, Inc. | 0,37 | -8,47 | 241,62 | -17,73 | 3,8015 | 0,1571 | |||
| ABT / Abbott Laboratories | 1,87 | -22,26 | 234,68 | -27,28 | 3,6922 | -0,3121 | |||
| KLAC / KLA Corporation | 0,19 | -27,80 | 230,27 | -18,67 | 3,6230 | 0,1099 | |||
| WM / Waste Management, Inc. | 1,00 | -7,93 | 219,81 | -8,39 | 3,4584 | 0,4810 | |||
| MMC / Marsh & McLennan Companies, Inc. | 1,08 | -54,94 | 201,16 | -58,52 | 3,1650 | -2,8532 | |||
| SHW / The Sherwin-Williams Company | 0,62 | -6,83 | 200,34 | -12,81 | 3,1519 | 0,3008 | |||
| GJR / Strats Trust For Procter & Gambel Security - Preferred Security | 1,28 | -11,08 | 183,75 | -17,06 | 2,8911 | 0,1419 | |||
| INTU / Intuit Inc. | 0,27 | -49,16 | 180,83 | -50,69 | 2,8450 | -1,7052 | |||
| EFX / Equifax Inc. | 0,82 | -19,37 | 178,89 | -31,80 | 2,8145 | -0,4402 | |||
| BR / Broadridge Financial Solutions, Inc. | 0,77 | -30,04 | 171,72 | -34,45 | 2,7017 | -0,5487 | |||
| CDNS / Cadence Design Systems, Inc. | 0,53 | -14,60 | 165,56 | -24,00 | 2,6049 | -0,0983 | |||
| ADP / Automatic Data Processing, Inc. | 0,63 | -31,44 | 163,02 | -39,91 | 2,5649 | -0,8017 | |||
| MCD / McDonald's Corporation | 0,44 | -11,52 | 135,48 | -11,01 | 2,1315 | 0,2425 | |||
| VRSK / Verisk Analytics, Inc. | 0,45 | 4,93 | 99,68 | -6,67 | 1,5682 | 0,2430 | |||
| CPRT / Copart, Inc. | 2,17 | -58,80 | 84,90 | -64,14 | 1,3357 | -1,6015 | |||
| VEEV / Veeva Systems Inc. | 0,31 | -25,28 | 68,92 | -44,01 | 1,0844 | -0,4431 | |||
| MSI / Motorola Solutions, Inc. | 0,18 | 67,17 | 1,0568 | 1,0568 | |||||
| AVGO / Broadcom Inc. | 0,18 | 61,76 | 0,9717 | 0,9717 | |||||
| APH / Amphenol Corporation | 0,23 | -73,49 | 31,15 | -71,05 | 0,4901 | -0,8450 | |||
| ORCL / Oracle Corporation | 0,12 | -12,68 | 24,24 | -39,49 | 0,3814 | -0,1157 | |||
| ACN / Accenture plc | 0,07 | -78,77 | 17,82 | -76,90 | 0,2804 | -0,6770 | |||
| ECL / Ecolab Inc. | 0,06 | -10,49 | 15,74 | -14,20 | 0,2477 | 0,0200 | |||
| WAT / Waters Corporation | 0,04 | -11,84 | 14,71 | 11,70 | 0,2315 | 0,0680 | |||
| JGRW / Trust For Professional Managers - Jensen Quality Growth ETF | 0,52 | 14,02 | 0,2205 | 0,2205 | |||||
| ADBE / Adobe Inc. | 0,03 | -21,36 | 12,11 | -21,97 | 0,1905 | -0,0020 | |||
| PEP / PepsiCo, Inc. | 0,08 | -11,29 | 11,77 | -9,34 | 0,1852 | 0,0241 | |||
| EMR / Emerson Electric Co. | 0,07 | -18,50 | 9,94 | -17,54 | 0,1564 | 0,0068 | |||
| CL / Colgate-Palmolive Company | 0,12 | -4,69 | 9,40 | -5,78 | 0,1479 | 0,0241 | |||
| CTSH / Cognizant Technology Solutions Corporation | 0,11 | -12,93 | 8,94 | 7,75 | 0,1407 | 0,0377 | |||
| KO / The Coca-Cola Company | 0,11 | -10,31 | 7,81 | -5,45 | 0,1228 | 0,0204 | |||
| CLX / The Clorox Company | 0,07 | -6,81 | 6,90 | -23,79 | 0,1086 | -0,0038 | |||
| CCK / Crown Holdings, Inc. | 0,06 | 15,59 | 5,86 | 23,24 | 0,0922 | 0,0332 | |||
| LH / Labcorp Holdings Inc. | 0,02 | -9,23 | 5,73 | -20,66 | 0,0901 | 0,0005 | |||
| MSCI / MSCI Inc. | 0,01 | -10,86 | 5,65 | -9,86 | 0,0889 | 0,0111 | |||
| KEYS / Keysight Technologies, Inc. | 0,03 | -21,73 | 5,63 | -9,09 | 0,0886 | 0,0117 | |||
| G / Genpact Limited | 0,12 | 0,00 | 5,46 | 11,67 | 0,0858 | 0,0252 | |||
| EHC / Encompass Health Corporation | 0,05 | 0,00 | 5,38 | -16,43 | 0,0846 | 0,0048 | |||
| TSM / Taiwan Semiconductor Manufacturing Company Limited - Depositary Receipt (Common Stock) | 0,02 | -10,46 | 5,20 | -2,58 | 0,0819 | 0,0156 | |||
| KR / The Kroger Co. | 0,08 | 0,00 | 5,01 | -7,30 | 0,0789 | 0,0118 | |||
| NKE / NIKE, Inc. | 0,08 | -8,78 | 4,89 | -16,66 | 0,0770 | 0,0041 | |||
| TSCO / Tractor Supply Company | 0,10 | 0,00 | 4,89 | -12,07 | 0,0769 | 0,0079 | |||
| ROST / Ross Stores, Inc. | 0,03 | -29,92 | 4,85 | -17,17 | 0,0764 | 0,0037 | |||
| MMM / 3M Company | 0,03 | -0,05 | 4,46 | 3,13 | 0,0701 | 0,0165 | |||
| AON / Aon plc | 0,01 | 4,98 | 3,74 | 3,89 | 0,0589 | 0,0142 | |||
| FFIV / F5, Inc. | 0,01 | -2,89 | 3,60 | -23,29 | 0,0566 | -0,0016 | |||
| TJX / The TJX Companies, Inc. | 0,02 | -0,17 | 3,56 | 6,08 | 0,0560 | 0,0144 | |||
| DCI / Donaldson Company, Inc. | 0,04 | -36,54 | 3,55 | -31,27 | 0,0559 | -0,0082 | |||
| FDS / FactSet Research Systems Inc. | 0,01 | 0,00 | 3,43 | 1,30 | 0,0539 | 0,0119 | |||
| TTC / The Toro Company | 0,04 | 0,00 | 3,42 | 3,29 | 0,0538 | 0,0127 | |||
| TROW / T. Rowe Price Group, Inc. | 0,03 | 0,00 | 3,27 | -0,24 | 0,0515 | 0,0108 | |||
| RTX / RTX Corporation | 0,02 | -0,11 | 3,23 | 9,49 | 0,0508 | 0,0142 | |||
| GWW / W.W. Grainger, Inc. | 0,00 | 36,52 | 3,17 | 44,59 | 0,0498 | 0,0227 | |||
| GNTX / Gentex Corporation | 0,13 | 0,00 | 3,11 | -17,78 | 0,0489 | 0,0020 | |||
| NDSN / Nordson Corporation | 0,01 | 0,00 | 2,90 | 5,96 | 0,0456 | 0,0116 | |||
| CHD / Church & Dwight Co., Inc. | 0,03 | 0,00 | 2,90 | -4,29 | 0,0456 | 0,0080 | |||
| OMC / Omnicom Group Inc. | 0,03 | -54,99 | 2,75 | -55,44 | 0,0433 | -0,0333 | |||
| ABBV / AbbVie Inc. | 0,01 | -38,51 | 2,55 | -39,31 | 0,0401 | -0,0120 | |||
| LEVI / Levi Strauss & Co. | 0,12 | -13,57 | 2,46 | -23,08 | 0,0387 | -0,0010 | |||
| IDXX / IDEXX Laboratories, Inc. | 0,00 | -19,39 | 2,42 | -14,66 | 0,0380 | 0,0029 | |||
| APD / Air Products and Chemicals, Inc. | 0,01 | 0,03 | 2,23 | -9,42 | 0,0351 | 0,0045 | |||
| JNJ / Johnson & Johnson | 0,01 | -64,56 | 2,12 | -60,45 | 0,0334 | -0,0332 | |||
| FICO / Fair Isaac Corporation | 0,00 | -22,84 | 2,11 | -12,83 | 0,0332 | 0,0032 | |||
| HOLX / Hologic, Inc. | 0,03 | -54,14 | 2,09 | -49,39 | 0,0328 | -0,0183 | |||
| URI / United Rentals, Inc. | 0,00 | -27,82 | 1,74 | -38,82 | 0,0274 | -0,0079 | |||
| TXN / Texas Instruments Incorporated | 0,01 | -4,26 | 1,68 | -9,60 | 0,0264 | 0,0034 | |||
| BBY / Best Buy Co., Inc. | 0,02 | -9,68 | 1,66 | -20,05 | 0,0260 | 0,0004 | |||
| BAH / Booz Allen Hamilton Holding Corporation | 0,02 | -55,40 | 1,39 | -62,37 | 0,0218 | -0,0239 | |||
| UNH / UnitedHealth Group Incorporated | 0,00 | -9,88 | 1,30 | -13,85 | 0,0205 | 0,0017 | |||
| ON / ON Semiconductor Corporation | 0,02 | -48,36 | 1,16 | -43,27 | 0,0182 | -0,0071 | |||
| BJJQY / Bajaj Finance Ltd. | 0,10 | 1,05 | 0,0000 | ||||||
| RACE / Ferrari N.V. | 0,00 | 0,96 | 0,0151 | 0,0151 | |||||
| CPB / The Campbell's Company | 0,03 | -60,66 | 0,88 | -65,31 | 0,0138 | -0,0175 | |||
| HD / The Home Depot, Inc. | 0,00 | -67,04 | 0,86 | -72,02 | 0,0135 | -0,0246 | |||
| GIS / General Mills, Inc. | 0,02 | -83,77 | 0,83 | -85,05 | 0,0131 | -0,0557 | |||
| LULU / lululemon athletica inc. | 0,00 | -52,31 | 0,81 | -44,32 | 0,0128 | -0,0053 | |||
| LSTR / Landstar System, Inc. | 0,01 | -14,40 | 0,77 | 0,26 | 0,0121 | 0,0026 | |||
| MANH / Manhattan Associates, Inc. | 0,00 | -14,17 | 0,77 | -27,39 | 0,0121 | -0,0010 | |||
| DOX / Amdocs Limited | 0,01 | 0,74 | 0,0117 | 0,0117 | |||||
| LIN / Linde plc | 0,00 | -6,52 | 0,55 | -16,03 | 0,0087 | 0,0005 | |||
| BDX / Becton, Dickinson and Company | 0,00 | 0,00 | 0,48 | 3,66 | 0,0076 | 0,0018 | |||
| GPC / Genuine Parts Company | 0,00 | 0,00 | 0,33 | -11,35 | 0,0052 | 0,0006 | |||
| K / Kellanova | 0,00 | -100,00 | 0,00 | 0,0000 | |||||
| UPS / United Parcel Service, Inc. | 0,00 | -100,00 | 0,00 | 0,0000 | |||||
| PAYX / Paychex, Inc. | 0,00 | -100,00 | 0,00 | 0,0000 | |||||
| BMY / Bristol-Myers Squibb Company | 0,00 | -100,00 | 0,00 | 0,0000 | |||||
| ZTS / Zoetis Inc. | 0,00 | -100,00 | 0,00 | 0,0000 |