Grundlæggende statistik
| Institutionelle ejere | 155 total, 155 long only, 0 short only, 0 long/short - change of -1,90% MRQ |
| Gennemsnitlig porteføljeallokering | 0.0951 % - change of -11,71% MRQ |
| Institutionelle aktier (lange) | 2.393.893 (ex 13D/G) - change of -0,05MM shares -2,01% MRQ |
| Institutionel værdi (lang) | $ 326.385 USD ($1000) |
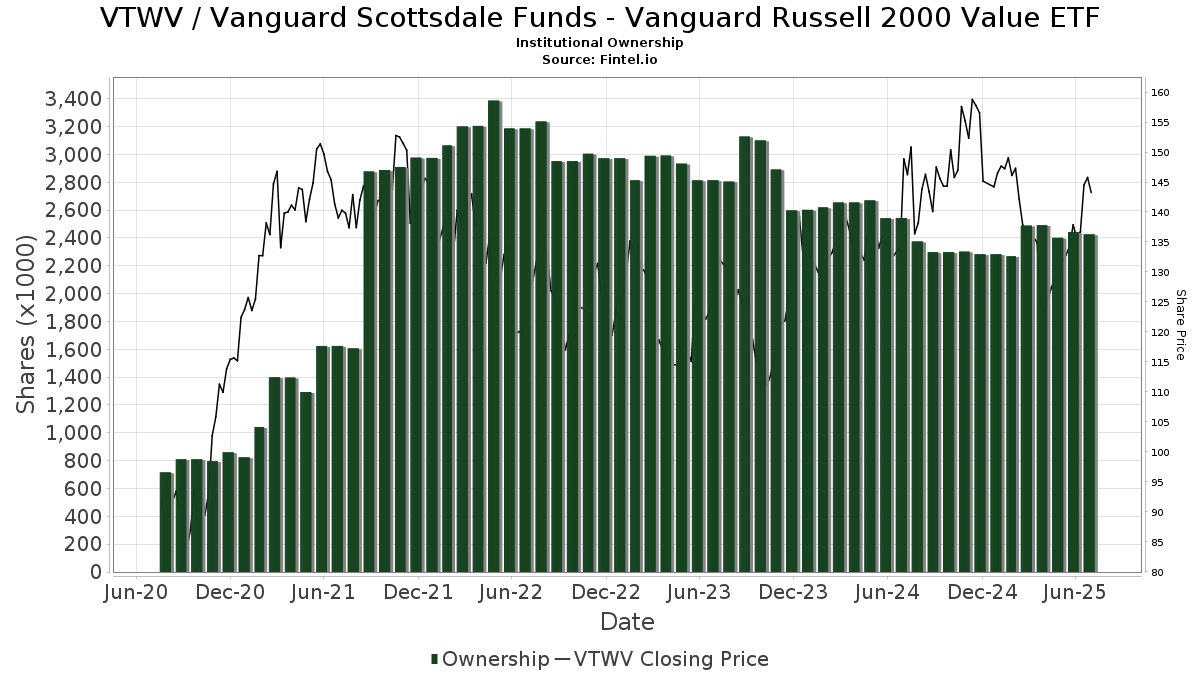
Institutionelt ejerskab og aktionærer
Vanguard Scottsdale Funds - Vanguard Russell 2000 Value ETF (US:VTWV) har 155 institutionelle ejere og aktionærer, der har indsendt 13D/G- eller 13F-formularer til Securities Exchange Commission (SEC). Disse institutioner har i alt 2,393,893 aktier. Største aktionærer omfatter Bank Of America Corp /de/, Pathstone Holdings, LLC, Morgan Stanley, LPL Financial LLC, Rockefeller Capital Management L.P., Bragg Financial Advisors, Inc, Ameriprise Financial Inc, Taddei, Ludwig & Associates, Inc., Congress Wealth Management LLC / DE /, and Financial Advisory Corp .
Vanguard Scottsdale Funds - Vanguard Russell 2000 Value ETF (NasdaqGM:VTWV) institutionel ejerskabsstruktur viser aktuelle positioner i virksomheden efter institutioner og fonde, samt seneste ændringer i positionsstørrelse. Større aktionærer kan omfatte individuelle investorer, investeringsforeninger, hedgefonde eller institutioner. Skema 13D angiver, at investoren besidder (eller besidder) mere end 5 % af virksomheden og har til hensigt (eller har til hensigt at) aktivt at forfølge en ændring i forretningsstrategi. Skema 13G indikerer en passiv investering på over 5%.
The share price as of September 15, 2025 is 155,34 / share. Previously, on September 16, 2024, the share price was 146,14 / share. This represents an increase of 6,30% over that period.
Fondens stemningsscore
Fund Sentiment Score (fka Ownership Accumulation Score) finder de aktier, der bliver mest købt af fonde. Det er resultatet af en sofistikeret, multi-faktor kvantitativ model, der identificerer virksomheder med de højeste niveauer af institutionel akkumulering. Scoringsmodellen bruger en kombination af den samlede stigning i oplyste ejere, ændringerne i porteføljeallokeringer i disse ejere og andre målinger. Tallet går fra 0 til 100, hvor højere tal indikerer et højere niveau af akkumulering for sine jævnaldrende, og 50 er gennemsnittet.
Opdateringsfrekvens: Dagligt
Se Ownership Explorer, som giver en liste over højest rangerende virksomheder.
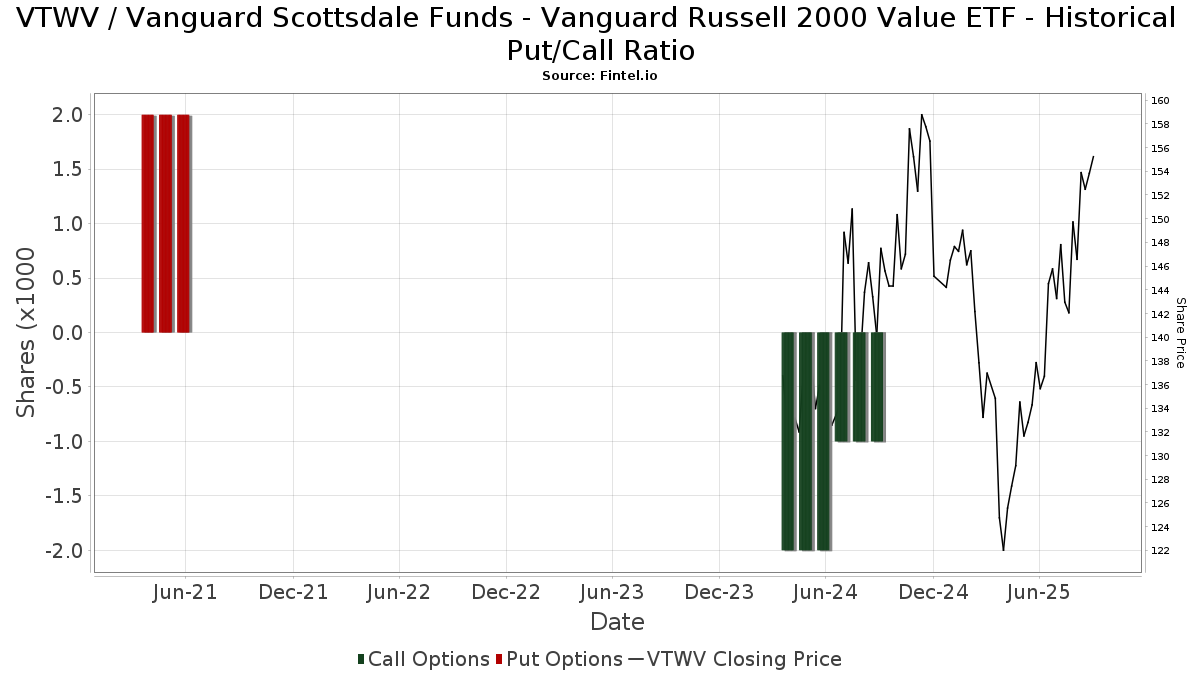
Institutionel Put/Call-forhold
Ud over at indberette standardaktie- og gældsudstedelser skal institutter med mere end 100 mill. aktiver under forvaltning også oplyse deres put- og call-optionsbeholdninger. Da salgsoptioner generelt indikerer negativ stemning, og købsoptioner indikerer positiv stemning, kan vi få en fornemmelse af den overordnede institutionelle stemning ved at plotte forholdet mellem put og kald. Diagrammet til højre viser det historiske put/call-forhold for dette instrument.
Brug af Put/Call Ratio som en indikator for investorernes stemning overvinder en af de vigtigste mangler ved at bruge totalt institutionelt ejerskab, som er, at en betydelig mængde af aktiver under forvaltning investeres passivt for at spore indekser. Passivt forvaltede fonde køber typisk ikke optioner, så indikatoren for put/call-forholdet følger mere nøje følelsen af aktivt forvaltede fonde.
13F og NPORT arkivering
Detaljer om 13F-arkivering er gratis. Detaljer om NP-ansøgninger kræver et premium-medlemskab. Grønne rækker angiver nye positioner. Røde rækker angiver lukkede positioner. Klik på linket ikon for at se den fulde transaktionshistorik.
Opgrader
for at låse premium-data op og eksportere til Excel ![]() .
.
| Fil dato | Kilde | Investor | Type | Gennemsnitlig pris (Øst) |
Aktier | Δ Aktier (%) |
Rapporteret Værdi ($1000) |
Δ Værdi (%) |
Port Alloc (%) |
|
|---|---|---|---|---|---|---|---|---|---|---|
| 2025-08-14 | 13F | Jane Street Group, Llc | 0 | -100,00 | 0 | |||||
| 2025-08-14 | 13F | Warren Averett Asset Management, LLC | 2.037 | 4,25 | 283 | 8,85 | ||||
| 2025-08-15 | 13F | Kestra Advisory Services, LLC | 35.611 | 2,18 | 4.953 | 6,79 | ||||
| 2025-07-10 | 13F | Brooklyn FI, LLC | 4.805 | 9,35 | 668 | -22,14 | ||||
| 2025-07-21 | 13F | Monticello Wealth Management, Llc | 3.946 | 4,50 | 549 | 9,16 | ||||
| 2025-07-23 | 13F | Bear Mountain Capital, Inc. | 126 | 0,00 | 18 | 12,50 | ||||
| 2025-07-31 | 13F | Buckingham Strategic Partners | 2.093 | 10,16 | 291 | 15,48 | ||||
| 2025-07-23 | 13F | Indiana Trust & Investment Management CO | 1.670 | 0,00 | 232 | 4,50 | ||||
| 2025-08-15 | 13F | Morgan Stanley | 150.323 | 13,75 | 20.909 | 18,88 | ||||
| 2025-08-05 | 13F | Carolinas Wealth Consulting Llc | 0 | -100,00 | 0 | -100,00 | ||||
| 2025-08-08 | 13F | Bailard, Inc. | 0 | -100,00 | 0 | |||||
| 2025-04-23 | 13F | Carl Stuart Investment Advisor, Inc | 0 | -100,00 | 0 | |||||
| 2025-08-14 | 13F | Raymond James Financial Inc | 39.461 | 44,76 | 5.489 | 51,27 | ||||
| 2025-08-07 | 13F | Kestra Private Wealth Services, Llc | 3.000 | -11,43 | 417 | -7,33 | ||||
| 2025-08-14 | 13F | Silvercrest Asset Management Group Llc | 27.104 | 22,00 | 3.770 | 27,50 | ||||
| 2025-05-06 | 13F | MCF Advisors LLC | 0 | -100,00 | 0 | |||||
| 2025-08-04 | 13F | Creative Financial Designs Inc /adv | 887 | 0,00 | 123 | 4,24 | ||||
| 2025-05-15 | 13F | Glenmede Trust Co Na | 138 | 0,00 | 18 | -5,26 | ||||
| 2025-04-21 | 13F | Johnson Investment Counsel Inc | 0 | -100,00 | 0 | |||||
| 2025-08-13 | 13F | Beacon Pointe Advisors, LLC | 2.409 | 0,00 | 335 | 4,69 | ||||
| 2025-08-14 | 13F | Bank Of America Corp /de/ | 386.721 | -10,82 | 53.789 | -6,80 | ||||
| 2025-08-13 | 13F | Congress Wealth Management LLC / DE / | 54.256 | 0,20 | 7.547 | 4,72 | ||||
| 2025-08-14 | 13F | Wells Fargo & Company/mn | 18.500 | -16,23 | 2.573 | -12,45 | ||||
| 2025-08-13 | 13F | Nyl Investors Llc | 7.971 | 1.109 | ||||||
| 2025-04-22 | 13F | Jmac Enterprises Llc | 0 | -100,00 | 0 | |||||
| 2025-09-04 | 13F/A | Advisor Group Holdings, Inc. | 2.654 | 22,76 | 369 | 28,13 | ||||
| 2025-08-08 | 13F/A | Sterling Capital Management LLC | 1.134 | 0,00 | 158 | 4,67 | ||||
| 2025-08-18 | 13F | Geneos Wealth Management Inc. | 40 | 100,00 | 6 | 150,00 | ||||
| 2025-07-22 | 13F | Wealthcare Advisory Partners LLC | 3.408 | -3,29 | 474 | 1,28 | ||||
| 2025-07-16 | 13F | Morangie Management LLC | 5.929 | 0,00 | 825 | 4,44 | ||||
| 2025-08-05 | 13F | Bank of New York Mellon Corp | 1.710 | 0,00 | 238 | 4,41 | ||||
| 2025-07-25 | 13F | Sequoia Financial Advisors, LLC | 0 | -100,00 | 0 | -100,00 | ||||
| 2025-08-05 | 13F | Bridgewater Advisors Inc. | 1.854 | -5,12 | 269 | 6,77 | ||||
| 2025-08-14 | 13F | Ancora Advisors, LLC | 40 | 0,00 | 6 | 0,00 | ||||
| 2025-08-06 | 13F | Eukles Asset Management | 115 | 0,00 | 16 | 0,00 | ||||
| 2025-08-12 | 13F | Proequities, Inc. | 0 | 0 | ||||||
| 2025-08-14 | 13F | Great Valley Advisor Group, Inc. | 6.551 | 2,78 | 911 | 7,31 | ||||
| 2025-07-25 | 13F | Atria Wealth Solutions, Inc. | 2.298 | 20,63 | 323 | 27,27 | ||||
| 2025-07-24 | 13F | Ronald Blue Trust, Inc. | 49 | 0,00 | 7 | 0,00 | ||||
| 2025-08-14 | 13F/A | Rockefeller Capital Management L.P. | 96.520 | 4,86 | 13.425 | 9,58 | ||||
| 2025-08-13 | 13F | Jones Financial Companies Lllp | 1.750 | 10,90 | 243 | 15,71 | ||||
| 2025-07-31 | 13F | Jordan Park Group LLC | 8.023 | -18,27 | 1.116 | -14,62 | ||||
| 2025-08-11 | 13F | HighTower Advisors, LLC | 20.180 | -0,81 | 2.807 | 3,66 | ||||
| 2025-08-14 | 13F | Wealth Preservation Advisors, LLC | 15 | 0,00 | 2 | 100,00 | ||||
| 2025-08-14 | 13F | GWM Advisors LLC | 3.227 | 0,00 | 449 | 4,43 | ||||
| 2025-07-03 | 13F | McLean Asset Management Corp | 4.297 | -31,35 | 621 | -14,60 | ||||
| 2025-08-14 | 13F | Financial Advisory Service, Inc. | 2.616 | 0,38 | 364 | 4,91 | ||||
| 2025-07-16 | 13F | Brown, Lisle/cummings, Inc. | 950 | 0,00 | 132 | 4,76 | ||||
| 2025-08-12 | 13F | Jpmorgan Chase & Co | 23.170 | -6,08 | 3.223 | -1,86 | ||||
| 2025-08-14 | 13F | Mercer Global Advisors Inc /adv | 2.398 | -8,09 | 334 | -4,03 | ||||
| 2025-08-12 | 13F | SRS Capital Advisors, Inc. | 254 | 35 | ||||||
| 2025-08-13 | 13F | Virtue Capital Management, LLC | 51.294 | -12,91 | 7.134 | -9,01 | ||||
| 2025-08-08 | 13F | Red Cedar Investment Management, Llc | 0 | -100,00 | 0 | |||||
| 2025-08-14 | 13F | Tennessee Valley Asset Management Partners | 3.098 | -10,15 | 431 | -6,11 | ||||
| 2025-07-30 | 13F | Eqis Capital Management, Inc. | 4.655 | 2,20 | 647 | 6,77 | ||||
| 2025-08-07 | 13F | Allworth Financial LP | 765 | 0,00 | 106 | 9,28 | ||||
| 2025-08-15 | 13F | Equitable Holdings, Inc. | 20.695 | 29,97 | 2.878 | 35,82 | ||||
| 2025-08-11 | 13F | TRUE Private Wealth Advisors | 1.933 | -4,31 | 269 | 0,00 | ||||
| 2025-08-13 | 13F | Allegheny Financial Group LTD | 15.116 | 6,80 | 2.103 | 11,63 | ||||
| 2025-08-13 | 13F | Lido Advisors, LLC | 5.189 | 232,63 | 722 | 248,31 | ||||
| 2025-08-14 | 13F | Ameriprise Financial Inc | 79.621 | -6,64 | 11.070 | -2,36 | ||||
| 2025-08-06 | 13F | Rialto Wealth Management, LLC | 3.011 | -0,59 | 419 | 3,72 | ||||
| 2025-08-14 | 13F | Susquehanna International Group, Llp | 4.377 | -81,81 | 609 | -81,01 | ||||
| 2025-04-21 | 13F | ORG Partners LLC | 0 | -100,00 | 0 | |||||
| 2025-08-14 | 13F | Ieq Capital, Llc | 3.156 | 0,00 | 439 | 4,29 | ||||
| 2025-07-22 | 13F | Miracle Mile Advisors, LLC | 4.707 | -1,09 | 655 | 3,32 | ||||
| 2025-07-17 | 13F | Michels Family Financial, LLC | 4.435 | -0,05 | 617 | 4,41 | ||||
| 2025-08-12 | 13F | Wealth Dimensions Group, Ltd. | 14.859 | 3,40 | 2.067 | 8,05 | ||||
| 2025-08-12 | 13F | Archer Investment Corp | 1.038 | 0,00 | 144 | 4,35 | ||||
| 2025-08-11 | 13F | Aptus Capital Advisors, LLC | 1.236 | 0,41 | 172 | 4,91 | ||||
| 2025-08-12 | 13F | MAI Capital Management | 100 | 0,00 | 14 | 0,00 | ||||
| 2025-08-08 | 13F | Cetera Investment Advisers | 36.596 | 1,21 | 5.090 | 5,78 | ||||
| 2025-04-23 | 13F | Nvest Financial, LLC | 0 | -100,00 | 0 | |||||
| 2025-07-28 | 13F | Harbour Investments, Inc. | 454 | 0,00 | 63 | 5,00 | ||||
| 2025-08-13 | 13F | Vance Wealth, Inc. | 2.510 | -16,42 | 349 | -12,53 | ||||
| 2025-07-07 | 13F | LBJ Family Wealth Advisors, Ltd. | 12.555 | 2,82 | 2 | 0,00 | ||||
| 2025-08-05 | 13F | Bank Of Montreal /can/ | 4.159 | -2,05 | 578 | 2,30 | ||||
| 2025-08-12 | 13F | FourThought Financial Partners, LLC | 8.104 | 1,05 | 1.127 | 5,62 | ||||
| 2025-08-14 | 13F | Atomi Financial Group, Inc. | 1.867 | 0,32 | 260 | 4,86 | ||||
| 2025-08-14 | 13F | Citadel Advisors Llc | 27.497 | 55,70 | 3.825 | 62,72 | ||||
| 2025-08-14 | 13F | Mariner, LLC | 5.088 | 41,53 | 708 | 47,91 | ||||
| 2025-07-29 | 13F | Private Trust Co Na | 191 | 0,00 | 27 | 4,00 | ||||
| 2025-08-11 | 13F | Anderson Financial Strategies, LLC | 0 | -100,00 | 0 | |||||
| 2025-04-22 | 13F | Synergy Financial Management, LLC | 0 | -100,00 | 0 | |||||
| 2025-07-22 | 13F | IVC Wealth Advisors LLC | 4.976 | -36,51 | 692 | -33,65 | ||||
| 2025-08-07 | 13F | Topel & Distasi Wealth Management, LLC | 0 | -100,00 | 0 | |||||
| 2025-08-08 | 13F | SBI Securities Co., Ltd. | 89 | 0,00 | 12 | 9,09 | ||||
| 2025-08-14 | 13F | Guardian Wealth Advisors, Llc / Nc | 1.136 | 0,44 | 158 | 4,67 | ||||
| 2025-08-08 | 13F | Phoenix Wealth Advisors | 14.819 | -12,96 | 2.061 | -9,01 | ||||
| 2025-07-29 | 13F | Rodgers & Associates, LTD | 16.717 | 0,42 | 2.325 | 4,97 | ||||
| 2025-08-13 | 13F | Portland Global Advisors LLC | 2.100 | 0,00 | 292 | 4,66 | ||||
| 2025-07-29 | 13F | Stordahl Capital Management, Inc. | 2.754 | 1,59 | 383 | 6,39 | ||||
| 2025-07-11 | 13F | Farther Finance Advisors, LLC | 437 | 1.050,00 | 61 | 1.100,00 | ||||
| 2025-08-12 | 13F | Investor's Fiduciary Advisor Network, LLC | 2.556 | 0,00 | 0 | |||||
| 2025-04-29 | 13F | Centered Wealth LLC dba Miller Equity Capital Advisors | 0 | -100,00 | 0 | |||||
| 2025-05-15 | 13F | Qube Research & Technologies Ltd | 0 | -100,00 | 0 | |||||
| 2025-08-12 | 13F | Global Retirement Partners, LLC | 367 | 0,82 | 51 | -1,92 | ||||
| 2025-08-08 | 13F | First Western Trust Bank | 1.738 | 0,00 | 242 | 4,33 | ||||
| 2025-08-12 | 13F | Fairscale Capital, LLC | 50 | 0,00 | 7 | 16,67 | ||||
| 2025-07-18 | 13F | Institute for Wealth Management, LLC. | 43.992 | 0,00 | 6.119 | 4,51 | ||||
| 2025-08-14 | 13F | Hrt Financial Lp | 0 | -100,00 | 0 | |||||
| 2025-08-14 | 13F | MidWestOne Financial Group, Inc. | 8.231 | 2,90 | 1.145 | 7,52 | ||||
| 2025-07-11 | 13F | Financial Advisory Corp | 52.804 | -1,82 | 7.345 | 2,61 | ||||
| 2025-08-04 | 13F | AMG National Trust Bank | 40.889 | 100,38 | 5.687 | 109,47 | ||||
| 2025-08-14 | 13F | Two Sigma Investments, Lp | 0 | -100,00 | 0 | |||||
| 2025-08-14 | 13F | Royal Bank Of Canada | 9.169 | -20,01 | 1.275 | -16,39 | ||||
| 2025-08-15 | 13F | Captrust Financial Advisors | 14.439 | 2.008 | ||||||
| 2025-07-22 | 13F | Iron Horse Wealth Management, LLC | 145 | 20 | ||||||
| 2025-08-14 | 13F | CoreFirst Bank & Trust | 99 | 14 | ||||||
| 2025-07-17 | 13F | Northwest Wealth Management, Llc | 1.959 | 10,37 | 272 | 15,25 | ||||
| 2025-08-14 | 13F | Comerica Bank | 1.494 | -0,53 | 208 | 4,02 | ||||
| 2025-08-05 | 13F | Centennial Bank/AR/ | 488 | -71,18 | 68 | -70,22 | ||||
| 2025-08-12 | 13F | AlphaCore Capital LLC | 111 | 0,00 | 15 | 7,14 | ||||
| 2025-08-14 | 13F | Fmr Llc | 1.511 | 73,28 | 210 | 81,03 | ||||
| 2025-07-18 | 13F | Truist Financial Corp | 2.966 | -21,82 | 413 | -18,25 | ||||
| 2025-08-25 | 13F/A | Neuberger Berman Group LLC | 5.918 | 0,08 | 823 | 4,71 | ||||
| 2025-08-06 | 13F | Adviser Investments LLC | 38.953 | 5,87 | 5.418 | 10,64 | ||||
| 2025-08-13 | 13F | Northwestern Mutual Wealth Management Co | 4.994 | 46,58 | 695 | 53,20 | ||||
| 2025-07-17 | 13F | Gleason Group, Inc. | 758 | 0,40 | 105 | 5,00 | ||||
| 2025-08-14 | 13F | Moneta Group Investment Advisors Llc | 3.779 | 0,19 | 526 | 4,58 | ||||
| 2025-08-06 | 13F | Savant Capital, LLC | 48.924 | -3,09 | 6.805 | 1,28 | ||||
| 2025-08-14 | 13F | CIBC World Markets Inc. | 17.312 | -7,23 | 2.408 | -3,06 | ||||
| 2025-08-08 | 13F | Comprehensive Financial Planning, Inc./PA | 80 | 0,00 | 11 | 10,00 | ||||
| 2025-08-19 | 13F | Asset Dedication, LLC | 53 | 7 | ||||||
| 2025-07-14 | 13F | Painted Porch Advisors LLC | 805 | 0,00 | 112 | 3,74 | ||||
| 2025-05-12 | 13F | Evernest Financial Advisors, LLC | 0 | -100,00 | 0 | |||||
| 2025-07-31 | 13F | Oppenheimer & Co Inc | 8.517 | 4,13 | 1.185 | 8,82 | ||||
| 2025-07-18 | 13F | Bartlett & Co. Wealth Management Llc | 17.355 | -8,92 | 2.414 | -4,85 | ||||
| 2025-08-12 | 13F | BlackRock, Inc. | 15.772 | 2.194 | ||||||
| 2025-07-25 | 13F | Cwm, Llc | 790 | 0,00 | 0 | |||||
| 2025-08-12 | 13F | LPL Financial LLC | 117.989 | 5,75 | 16.411 | 10,52 | ||||
| 2025-07-31 | 13F | Cambridge Investment Research Advisors, Inc. | 8.963 | 2,01 | 1 | 0,00 | ||||
| 2025-08-14 | 13F | Financial Engines Advisors L.L.C. | 10.215 | 1.421 | ||||||
| 2025-05-12 | 13F | Potentia Wealth | 0 | -100,00 | 0 | |||||
| 2025-08-05 | 13F | Simplex Trading, Llc | 0 | -100,00 | 0 | |||||
| 2025-08-12 | 13F | Vawter Financial, Ltd. | 0 | -100,00 | 0 | |||||
| 2025-08-11 | 13F | FSA Wealth Management LLC | 201 | 0,00 | 114 | 10,68 | ||||
| 2025-07-14 | 13F | Farmers & Merchants Investments Inc | 0 | -100,00 | 0 | |||||
| 2025-08-13 | 13F | Baird Financial Group, Inc. | 10.194 | -21,74 | 1.418 | -18,23 | ||||
| 2025-08-14 | 13F | McIlrath & Eck, LLC | 85 | -56,63 | 12 | -57,69 | ||||
| 2025-08-13 | 13F | Wrenne Financial Planning LLC | 6.034 | 839 | ||||||
| 2025-07-28 | 13F | Verisail Partners, LLC | 4.621 | 0,00 | 643 | 4,39 | ||||
| 2025-08-05 | 13F | Sigma Planning Corp | 6.255 | -5,87 | 870 | -1,70 | ||||
| 2025-08-15 | 13F | CI Private Wealth, LLC | 3.806 | 1,39 | 529 | 6,01 | ||||
| 2025-08-18 | 13F/A | National Bank Of Canada /fi/ | 605 | -2,42 | 84 | 1,22 | ||||
| 2025-07-10 | 13F | Wealth Enhancement Advisory Services, Llc | 4.656 | -7,66 | 678 | 0,89 | ||||
| 2025-08-07 | 13F | Commerce Bank | 15.705 | 0,32 | 2.184 | 4,85 | ||||
| 2025-05-15 | 13F | Oxford Financial Group Ltd | 0 | -100,00 | 0 | |||||
| 2025-08-13 | 13F | Tobias Financial Advisors, Inc. | 7.661 | 0,00 | 1.066 | 4,51 | ||||
| 2025-08-15 | 13F | Tower Research Capital LLC (TRC) | 4.318 | -64,63 | 601 | -63,05 | ||||
| 2025-07-24 | 13F | Eastern Bank | 96 | 0,00 | 13 | 8,33 | ||||
| 2025-07-08 | 13F | Nbc Securities, Inc. | 35 | 0,00 | 0 | |||||
| 2025-07-16 | 13F | Plancorp, LLC | 4.318 | 0,05 | 601 | 4,53 | ||||
| 2025-07-17 | 13F | Janney Montgomery Scott LLC | 3.816 | -1,55 | 1 | |||||
| 2025-04-23 | 13F | Perigon Wealth Management, LLC | 0 | -100,00 | 0 | |||||
| 2025-07-25 | 13F | Envestnet Portfolio Solutions, Inc. | 2.680 | -4,18 | 373 | 0,00 | ||||
| 2025-08-08 | 13F | Hartland & Co., LLC | 12.851 | 0,01 | 1.787 | 4,50 | ||||
| 2025-08-12 | 13F | Franklin Resources Inc | 25.182 | 0,60 | 3.503 | 5,13 | ||||
| 2025-08-07 | 13F | Parkside Financial Bank & Trust | 11.293 | 9,91 | 1.571 | 14,85 | ||||
| 2025-08-14 | 13F | Bragg Financial Advisors, Inc | 88.750 | 4,71 | 12.344 | 9,43 | ||||
| 2025-08-11 | 13F | Private Advisor Group, LLC | 4.710 | -17,50 | 655 | -13,70 | ||||
| 2025-08-12 | 13F | Cornerstone Wealth Management, LLC | 2.518 | -0,75 | 350 | 3,86 | ||||
| 2025-05-14 | 13F | Boston Private Wealth Llc | 0 | -100,00 | 0 | |||||
| 2025-07-17 | 13F | Fifth Third Securities, Inc. | 11.143 | 3,05 | 1.550 | 7,64 | ||||
| 2025-07-23 | 13F | Roundview Capital LLC | 6.079 | 0,00 | 846 | 4,45 | ||||
| 2025-05-02 | 13F | BluePointe Capital Management, LLC | 3.627 | 0,00 | 483 | -8,02 | ||||
| 2025-07-14 | 13F | AdvisorNet Financial, Inc | 3.479 | -81,43 | 484 | -80,63 | ||||
| 2025-08-14 | 13F | Goldman Sachs Group Inc | 22.664 | -15,25 | 3.152 | -11,44 | ||||
| 2025-08-01 | 13F | Envestnet Asset Management Inc | 12.065 | 13,63 | 1.678 | 18,75 | ||||
| 2025-08-14 | 13F | Stifel Financial Corp | 7.943 | 0,00 | 1.105 | 4,45 | ||||
| 2025-08-14 | 13F | UBS Group AG | 30.514 | 4,37 | 4.244 | 9,07 | ||||
| 2025-07-09 | 13F | Taddei, Ludwig & Associates, Inc. | 57.184 | 0,14 | 7.954 | 4,64 | ||||
| 2025-08-12 | 13F | Pathstone Holdings, LLC | 186.497 | 7,94 | 25.940 | 12,80 | ||||
| 2025-08-13 | 13F | Flow Traders U.s. Llc | 3.275 | -1,92 | 0 | |||||
| 2025-08-14 | 13F | Note Advisors, LLC | 2.505 | -38,42 | 348 | -35,67 | ||||
| 2025-08-08 | 13F | Pnc Financial Services Group, Inc. | 42 | 0,00 | 6 | 0,00 | ||||
| 2025-08-13 | 13F | Berkshire Asset Management Llc/pa | 18.513 | 0,39 | 2.575 | 6,23 | ||||
| 2025-07-23 | 13F | Country Club Bank /gfn | 2.740 | 0,00 | 381 | 4,11 | ||||
| 2025-08-14 | 13F | Banque Transatlantique SA | 0 | -100,00 | 0 | |||||
| 2025-08-06 | 13F | Commonwealth Equity Services, Llc | 12.849 | -0,09 | 2 | 0,00 | ||||
| 2025-08-14 | 13F | RMB Capital Management, LLC | 2.528 | 352 | ||||||
| 2025-08-14 | 13F | Mml Investors Services, Llc | 2.847 | 0,89 | 0 | |||||
| 2025-08-05 | 13F | Gibraltar Capital Management, Inc. | 11.250 | 0,00 | 1.565 | 4,48 |