Grundlæggende statistik
| Institutionelle ejere | 214 total, 214 long only, 0 short only, 0 long/short - change of 5,94% MRQ |
| Gennemsnitlig porteføljeallokering | 0.2695 % - change of 7,09% MRQ |
| Institutionelle aktier (lange) | 6.240.172 (ex 13D/G) - change of 0,13MM shares 2,09% MRQ |
| Institutionel værdi (lang) | $ 583.252 USD ($1000) |
Institutionelt ejerskab og aktionærer
Vanguard Admiral Funds - Vanguard S&P Small-Cap 600 Value ETF (US:VIOV) har 214 institutionelle ejere og aktionærer, der har indsendt 13D/G- eller 13F-formularer til Securities Exchange Commission (SEC). Disse institutioner har i alt 6,240,172 aktier. Største aktionærer omfatter Morgan Stanley, Aspiriant, Llc, N.E.W. Advisory Services LLC, UBS Group AG, Savant Capital, LLC, Concurrent Investment Advisors, LLC, Gallagher Fiduciary Advisors, LLC, Atria Investments Llc, Cannon Financial Strategists, Inc., and Silvercrest Asset Management Group Llc .
Vanguard Admiral Funds - Vanguard S&P Small-Cap 600 Value ETF (ARCA:VIOV) institutionel ejerskabsstruktur viser aktuelle positioner i virksomheden efter institutioner og fonde, samt seneste ændringer i positionsstørrelse. Større aktionærer kan omfatte individuelle investorer, investeringsforeninger, hedgefonde eller institutioner. Skema 13D angiver, at investoren besidder (eller besidder) mere end 5 % af virksomheden og har til hensigt (eller har til hensigt at) aktivt at forfølge en ændring i forretningsstrategi. Skema 13G indikerer en passiv investering på over 5%.
The share price as of April 20, 2026 is 110,19 / share. Previously, on April 21, 2025, the share price was 74,33 / share. This represents an increase of 48,24% over that period.

Fondens stemningsscore
Fund Sentiment Score (fka Ownership Accumulation Score) finder de aktier, der bliver mest købt af fonde. Det er resultatet af en sofistikeret, multi-faktor kvantitativ model, der identificerer virksomheder med de højeste niveauer af institutionel akkumulering. Scoringsmodellen bruger en kombination af den samlede stigning i oplyste ejere, ændringerne i porteføljeallokeringer i disse ejere og andre målinger. Tallet går fra 0 til 100, hvor højere tal indikerer et højere niveau af akkumulering for sine jævnaldrende, og 50 er gennemsnittet.
Opdateringsfrekvens: Dagligt
Se Ownership Explorer, som giver en liste over højest rangerende virksomheder.
AI+ Ask Fintel’s AI assistant about Vanguard Admiral Funds - Vanguard S&P Small-Cap 600 Value ETF.
Select a question to share a public post with an AI-crafted answer.
Thinking of good questions…
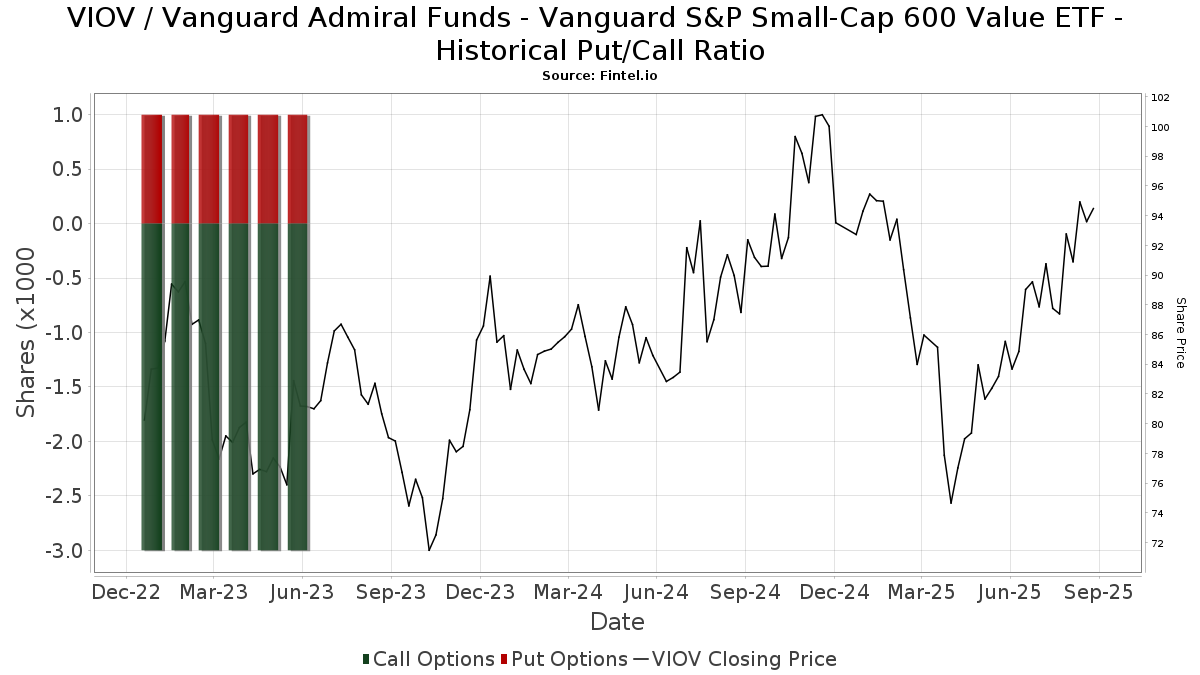
Institutionel Put/Call-forhold
Ud over at indberette standardaktie- og gældsudstedelser skal institutter med mere end 100 mill. aktiver under forvaltning også oplyse deres put- og call-optionsbeholdninger. Da salgsoptioner generelt indikerer negativ stemning, og købsoptioner indikerer positiv stemning, kan vi få en fornemmelse af den overordnede institutionelle stemning ved at plotte forholdet mellem put og kald. Diagrammet til højre viser det historiske put/call-forhold for dette instrument.
Brug af Put/Call Ratio som en indikator for investorernes stemning overvinder en af de vigtigste mangler ved at bruge totalt institutionelt ejerskab, som er, at en betydelig mængde af aktiver under forvaltning investeres passivt for at spore indekser. Passivt forvaltede fonde køber typisk ikke optioner, så indikatoren for put/call-forholdet følger mere nøje følelsen af aktivt forvaltede fonde.
13F og NPORT arkivering
Detaljer om 13F-arkivering er gratis. Detaljer om NP-ansøgninger kræver et premium-medlemskab. Grønne rækker angiver nye positioner. Røde rækker angiver lukkede positioner. Klik på linket ikon for at se den fulde transaktionshistorik.
Opgrader
for at låse premium-data op og eksportere til Excel ![]() .
.
| Fil dato | Kilde | Investor | Type | Gennemsnitlig pris (Øst) |
Aktier | Δ Aktier (%) |
Rapporteret Værdi ($1000) |
Δ Værdi (%) |
Port Alloc (%) |
|
|---|---|---|---|---|---|---|---|---|---|---|
| 2026-01-29 | 13F | Comerica Bank | 4.301 | -25,19 | 420 | -23,22 | ||||
| 2026-01-29 | 13F | DecisionPoint Financial, LLC | 120 | 12 | ||||||
| 2026-02-14 | 13F | Rockefeller Capital Management L.P. | 1.861 | 0,32 | 182 | 2,84 | ||||
| 2026-01-27 | 13F | Stone Point Wealth LLC | 3.692 | 0,00 | 361 | 2,56 | ||||
| 2026-02-13 | 13F | MAI Capital Management | 174 | 0,00 | 17 | 6,25 | ||||
| 2026-04-07 | 13F | Farther Finance Advisors, LLC | 5.305 | -13,74 | 540 | -10,15 | ||||
| 2026-02-11 | 13F | LPL Financial LLC | 128.684 | -0,65 | 12.580 | 2,01 | ||||
| 2026-02-09 | 13F | Fidelity D & D Bancorp Inc | 2.359 | 0,00 | 231 | 2,68 | ||||
| 2026-02-03 | 13F | Silver Oak Advisory Group, Inc. | 88.971 | -0,43 | 9 | 0,00 | ||||
| 2026-02-13 | 13F | SYM FINANCIAL Corp | 120.440 | -3,78 | 11.774 | -1,21 | ||||
| 2026-02-06 | 13F | Vestmark Advisory Solutions, Inc. | 8.811 | -2,64 | 861 | 0,00 | ||||
| 2026-01-20 | 13F | Aspiriant, Llc | 311.630 | -6,50 | 30.465 | -4,01 | ||||
| 2026-02-17 | 13F | Tower Research Capital LLC (TRC) | 5 | 66,67 | 0 | |||||
| 2026-04-16 | 13F | Phillips Financial Management, Llc | 11.096 | -5,39 | 1.129 | -1,57 | ||||
| 2026-02-23 | 13F | Beaird Harris Wealth Management, LLC | 4.089 | 0,54 | 400 | 3,10 | ||||
| 2026-01-30 | 13F | Sigma Planning Corp | 4.223 | -0,24 | 413 | 2,23 | ||||
| 2026-04-15 | 13F | Snider Financial Group | 0 | -100,00 | 0 | |||||
| 2026-01-20 | 13F | Red Door Wealth Management, LLC | 27.922 | 0,42 | 2.730 | 3,10 | ||||
| 2026-01-29 | 13F | UBS Group AG | 300.814 | -1,07 | 29.408 | 1,57 | ||||
| 2026-02-12 | 13F | StoneX Group Inc. | 2.322 | -8,33 | 227 | -6,22 | ||||
| 2026-02-02 | 13F | Mutual Advisors, LLC | 55.284 | -2,82 | 5.405 | -1,67 | ||||
| 2026-04-17 | 13F | AdvisorNet Financial, Inc | 209 | 0,48 | 21 | 5,00 | ||||
| 2026-02-10 | 13F | Verus Capital Partners, Llc | 2.913 | 0,66 | 285 | 3,27 | ||||
| 2026-02-11 | 13F | Vise Technologies, Inc. | 6.124 | 599 | ||||||
| 2026-02-12 | 13F | CIBC Private Wealth Group, LLC | 17.931 | 441,23 | 1.753 | 456,19 | ||||
| 2026-02-04 | 13F | Summit Wealth Group Llc / Co | 24.434 | 2.389 | ||||||
| 2025-10-28 | 13F | BRYN MAWR TRUST Co | 259 | 17,73 | 25 | 33,33 | ||||
| 2026-02-12 | 13F | Triumph Capital Management | 807 | 1,64 | 79 | 4,00 | ||||
| 2026-02-12 | 13F | Principal Securities, Inc. | 0 | -100,00 | 0 | -100,00 | ||||
| 2025-11-07 | 13F | Keener Financial Planning LLC | 0 | -100,00 | 0 | |||||
| 2026-04-07 | 13F | Heartwood Wealth Advisors LLC | 2.886 | 10,91 | 294 | 15,35 | ||||
| 2026-04-20 | 13F | Apella Capital, LLC | 2.390 | 262 | ||||||
| 2026-02-13 | 13F | Mosaic Family Wealth Partners, Llc | 0 | -100,00 | 0 | |||||
| 2026-04-13 | 13F | Creative Financial Designs Inc /adv | 495 | 0,00 | 50 | 4,17 | ||||
| 2026-02-03 | 13F | McIlrath & Eck, LLC | 14 | 0,00 | 1 | 0,00 | ||||
| 2026-01-28 | 13F | Salomon & Ludwin, LLC | 746 | 0,00 | 74 | 2,78 | ||||
| 2026-01-29 | 13F | D.a. Davidson & Co. | 43.313 | 7,37 | 4.234 | 10,23 | ||||
| 2026-02-05 | 13F | AlphaCore Capital LLC | 77 | 8 | ||||||
| 2026-02-17 | 13F | Ameriflex Group, Inc. | 1.206 | -55,08 | 118 | -54,12 | ||||
| 2026-02-17 | 13F | Gallagher Fiduciary Advisors, LLC | 171.421 | -0,27 | 16.758 | 2,40 | ||||
| 2026-02-03 | 13F | Bokf, Na | 118 | 12 | ||||||
| 2026-01-28 | 13F | N.E.W. Advisory Services LLC | 309.473 | 1,02 | 30.254 | 3,71 | ||||
| 2026-02-17 | 13F | Advisor Group Holdings, Inc. | 114.827 | -12,62 | 11.230 | -9,45 | ||||
| 2026-02-17 | 13F | Jones Financial Companies Lllp | 3.377 | 5,90 | 330 | 9,27 | ||||
| 2026-04-02 | 13F | Noble Wealth Management PBC | 891 | -4,30 | 91 | -1,10 | ||||
| 2025-11-14 | 13F | Marquette Associates, Inc. | 0 | -100,00 | 0 | |||||
| 2026-02-11 | 13F | Janney Montgomery Scott LLC | 9.365 | 8,52 | 1 | |||||
| 2026-02-10 | 13F/A | Northwestern Mutual Wealth Management Co | 13.085 | -4,23 | 1.279 | -1,69 | ||||
| 2026-02-17 | 13F | Warren Averett Asset Management, LLC | 8.420 | 823 | ||||||
| 2026-02-17 | 13F | Stokes Family Office, LLC | 7.328 | 25,26 | 716 | 28,55 | ||||
| 2026-02-12 | 13F | Adviser Investments LLC | 5.816 | -2,14 | 569 | 0,53 | ||||
| 2026-02-13 | 13F | Smartleaf Asset Management LLC | 246 | 24 | ||||||
| 2026-02-03 | 13F | Insight 2811, Inc. | 3.067 | 1,89 | 300 | 4,55 | ||||
| 2026-02-11 | 13F | OneAscent Financial Services LLC | 2.947 | 288 | ||||||
| 2026-02-05 | 13F | Pacific Sun Financial Corp | 11.044 | -4,00 | 1.080 | -1,46 | ||||
| 2026-02-17 | 13F | Ameriprise Financial Inc | 37.750 | -1,26 | 3.690 | 1,29 | ||||
| 2026-04-09 | 13F | Nelson, Van Denburg & Campbell Wealth Management Group, LLC | 118.424 | 2,75 | 12.048 | 6,93 | ||||
| 2026-01-16 | 13F | Genesis Financial Group, LLC | 2.125 | 208 | ||||||
| 2026-02-24 | 13F | MidFirst Bank | 45.726 | 4.470 | ||||||
| 2026-02-17 | 13F | Silvercrest Asset Management Group Llc | 147.364 | 38,44 | 14.406 | 42,14 | ||||
| 2026-04-07 | 13F | CoreCap Advisors, LLC | 324 | 0,00 | 33 | 3,23 | ||||
| 2026-02-17 | 13F | Cahill Financial Advisors Inc | 2.239 | -31,55 | 219 | -29,90 | ||||
| 2026-01-27 | 13F | Brighton Jones Llc | 0 | -100,00 | 0 | |||||
| 2026-02-03 | 13F | Mokosak Advisory Group, LLC | 94.834 | 3,70 | 9.271 | 6,47 | ||||
| 2026-02-11 | 13F | Empowered Funds, LLC | 0 | -100,00 | 0 | |||||
| 2026-02-13 | 13F | Colony Group, LLC | 8.288 | 5,03 | 810 | 7,86 | ||||
| 2026-04-17 | 13F | Integrated Capital Management, LLC | 5.319 | -14,42 | 541 | -10,87 | ||||
| 2026-01-30 | 13F | Us Bancorp \de\ | 438 | -42,52 | 43 | -41,67 | ||||
| 2026-02-09 | 13F | Studio Investment Management Llc | 23.587 | -2,49 | 2.306 | 0,09 | ||||
| 2026-04-08 | 13F | Wealth Enhancement Advisory Services, Llc | 61.187 | -39,74 | 6.249 | -39,49 | ||||
| 2026-04-15 | 13F | Silverlake Wealth Management Llc | 35.192 | 10,59 | 3.580 | 15,11 | ||||
| 2026-02-04 | 13F | Ameritas Advisory Services, LLC | 0 | -100,00 | 0 | |||||
| 2026-04-08 | 13F | Hardin Capital Partners, LLC | 3.808 | 0,66 | 387 | 4,88 | ||||
| 2026-04-16 | 13F | Fiduciary Advisors, Inc. | 236 | 0,43 | 24 | 4,35 | ||||
| 2026-02-13 | 13F | Financial Freedom, LLC | 1.463 | 0,41 | 143 | 3,62 | ||||
| 2025-11-14 | 13F | Jane Street Group, Llc | 0 | -100,00 | 0 | |||||
| 2026-02-11 | 13F | Ackerman Capital Advisors, LLC | 15.878 | -10,64 | 1.552 | -8,22 | ||||
| 2026-01-30 | 13F | Caldwell Trust Co | 80 | 0,00 | 8 | 0,00 | ||||
| 2026-04-15 | 13F | Riversedge Advisors, Llc | 100.236 | -1,27 | 10.198 | 2,75 | ||||
| 2026-02-03 | 13F | Legacy Wealth Managment, LLC/ID | 24 | 2 | ||||||
| 2026-01-21 | 13F | SJS Investment Consulting Inc. | 343 | 34 | ||||||
| 2026-01-29 | 13F | Hegarty Advisors, LLC | 36.668 | 3.585 | ||||||
| 2026-02-17 | 13F | Cetera Investment Advisers | 17.249 | -14,02 | 1.686 | -11,73 | ||||
| 2026-01-22 | 13F | Financial Consulate, Inc | 1.344 | 0,60 | 131 | 3,15 | ||||
| 2026-02-17 | 13F | SageView Advisory Group, LLC | 981 | 96 | ||||||
| 2026-02-12 | 13F | Moneta Group Investment Advisors Llc | 29.054 | 12,30 | 2.840 | 15,31 | ||||
| 2026-02-10 | 13F | Bruce G. Allen Investments, LLC | 2.297 | 0,00 | 225 | 2,75 | ||||
| 2026-04-17 | 13F | Vermillion Wealth Management, Inc. | 17 | 0,00 | 2 | 0,00 | ||||
| 2026-02-05 | 13F | Allworth Financial LP | 2.284 | 7.037,50 | 223 | 7.333,33 | ||||
| 2026-01-28 | 13F | Barrett & Company, Inc. | 2.977 | -4,15 | 291 | -1,36 | ||||
| 2026-04-16 | 13F | Diversified Trust Co | 6.377 | 0,00 | 649 | 4,01 | ||||
| 2026-02-13 | 13F | Brown Advisory Inc | 18.014 | -6,13 | 1.761 | -3,61 | ||||
| 2026-04-20 | 13F | Jfs Wealth Advisors, Llc | 216 | 0,00 | 22 | 0,00 | ||||
| 2026-02-05 | 13F | Evensky & Katz LLC | 20.409 | -10,35 | 2 | -50,00 | ||||
| 2026-02-13 | 13F | Ubs Asset Management Americas Inc | 186 | 18 | ||||||
| 2026-02-17 | 13F | Alliancebernstein L.p. | 0 | -100,00 | 0 | |||||
| 2026-02-17 | 13F | Bank Of America Corp /de/ | 136.301 | 1,21 | 13.325 | 3,91 | ||||
| 2026-04-20 | 13F | Morton Brown Family Wealth, LLC | 28 | 0,00 | 3 | 0,00 | ||||
| 2026-02-12 | 13F | Brown Brothers Harriman & Co | 348 | 0,00 | 34 | 3,03 | ||||
| 2026-04-16 | 13F | Rfg Holdings, Inc. | 39.533 | -0,57 | 4.022 | 3,50 | ||||
| 2025-11-03 | 13F | AE Wealth Management LLC | 0 | -100,00 | 0 | |||||
| 2026-02-18 | 13F | Financial Advisory Service, Inc. | 2.990 | 0,67 | 292 | 3,55 | ||||
| 2026-04-08 | 13F | Cambridge Financial Group, LLC | 29.485 | -26,24 | 3.000 | -23,98 | ||||
| 2026-04-02 | 13F | Aspect Partners, LLC | 1.600 | 0,00 | 163 | 3,85 | ||||
| 2026-02-03 | 13F | BHK Investment Advisors, LLC | 3.200 | 0,00 | 313 | 2,63 | ||||
| 2026-02-13 | 13F | Glen Eagle Advisors, LLC | 200 | 0,00 | 20 | 0,00 | ||||
| 2026-04-14 | 13F | Family Wealth Partners, Llc | 10.559 | 0,06 | 1.074 | 4,17 | ||||
| 2026-04-20 | 13F | Kestra Private Wealth Services, Llc | 7.310 | -6,21 | 744 | -2,37 | ||||
| 2026-02-13 | 13F | Pathstone Holdings, LLC | 72.483 | -1,14 | 7.087 | 1,50 | ||||
| 2026-02-17 | 13F | Cardiff Park Advisors, Llc | 141 | 0,71 | 14 | 0,00 | ||||
| 2026-01-22 | 13F | Rodgers & Associates, LTD | 12.070 | 0,00 | 1.180 | 2,61 | ||||
| 2026-02-11 | 13F | Buckingham Strategic Partners | 11.721 | -48,20 | 1.146 | -47,38 | ||||
| 2026-02-17 | 13F | Equitable Holdings, Inc. | 4.347 | 4,37 | 425 | 7,07 | ||||
| 2026-04-15 | 13F | Wright Fund Managment, LLC | 10.559 | 1.074 | ||||||
| 2026-04-15 | 13F | Valley National Advisers Inc | 1.282 | -0,23 | 0 | |||||
| 2026-04-20 | 13F | Breakwater Capital Group | 2.163 | 1,36 | 220 | 5,77 | ||||
| 2026-02-18 | 13F | Veratis Advisors, Inc. | 20.753 | 2.223 | ||||||
| 2026-02-17 | 13F | First Manhattan Co | 120.055 | 0,01 | 11.737 | 2,68 | ||||
| 2026-04-10 | 13F | First Bank & Trust | 78.422 | 0,00 | 7.979 | 4,07 | ||||
| 2026-04-07 | 13F | Park Avenue Securities Llc | 4.472 | -0,36 | 0 | |||||
| 2026-02-04 | 13F | Cannon Financial Strategists, Inc. | 149.915 | -1,73 | 14.656 | 0,89 | ||||
| 2025-10-21 | 13F | Proffitt & Goodson Inc | 0 | -100,00 | 0 | |||||
| 2026-02-06 | 13F | Global Retirement Partners, LLC | 40.995 | 2,94 | 4.008 | 5,67 | ||||
| 2026-02-10 | 13F | Root Financial Partners, LLC | 1.016 | 243,24 | 99 | 253,57 | ||||
| 2026-02-13 | 13F | SRS Capital Advisors, Inc. | 66 | 6 | ||||||
| 2026-02-17 | 13F | Qube Research & Technologies Ltd | 181 | 5,85 | 18 | 6,25 | ||||
| 2026-02-17 | 13F | Wealth Architects, LLC | 12.070 | 0,00 | 1.180 | 2,61 | ||||
| 2026-01-26 | 13F | Inman Jager Wealth Management, LLC | 24.665 | 5,81 | 2.411 | 8,65 | ||||
| 2026-01-27 | 13F | TD Waterhouse Canada Inc. | 90 | 0,00 | 9 | 0,00 | ||||
| 2026-02-17 | 13F | Fmr Llc | 5.175 | -10,47 | 506 | -8,18 | ||||
| 2026-02-23 | 13F | Virtu Financial LLC | 2.530 | -73,65 | 0 | |||||
| 2026-02-13 | 13F | Morgan Stanley | 350.706 | -0,11 | 34.285 | 2,56 | ||||
| 2025-11-13 | 13F | Promus Capital, LLC | 252 | 24 | ||||||
| 2026-02-09 | 13F | Hantz Financial Services, Inc. | 25 | 0 | ||||||
| 2026-02-13 | 13F | Saxon Interests, Inc. | 32.922 | 0,71 | 3.218 | 4,38 | ||||
| 2026-02-13 | 13F | Cornerstone Financial Management LLC | 1.180 | 115 | ||||||
| 2026-02-19 | 13F | CI Private Wealth, LLC | 8.259 | 807 | ||||||
| 2026-01-27 | 13F | Evergreen Capital Management Llc | 41.401 | 1,22 | 4.047 | 3,93 | ||||
| 2026-01-30 | 13F | Simplicity Wealth,LLC | 3.906 | -5,61 | 382 | -3,30 | ||||
| 2026-02-13 | 13F | Gts Securities Llc | 2.456 | 240 | ||||||
| 2026-04-15 | 13F | Code Waechter LLC | 76.087 | 3,29 | 7.741 | 7,50 | ||||
| 2025-11-12 | 13F | CIBC Bancorp USA Inc. | 3.313 | 315 | ||||||
| 2026-02-13 | 13F | Cozad Asset Management Inc | 2.485 | -2,43 | 243 | 0,00 | ||||
| 2025-11-14 | 13F | Larson Financial Group LLC | 0 | -100,00 | 0 | |||||
| 2026-02-06 | 13F | Pnc Financial Services Group, Inc. | 53 | 1,92 | 5 | 25,00 | ||||
| 2025-11-13 | 13F | Jefferies Financial Group Inc. | 0 | -100,00 | 0 | |||||
| 2026-02-04 | 13F | Rockbridge Investment Management, LCC | 4.261 | -0,51 | 417 | 2,21 | ||||
| 2025-10-24 | 13F | Bristlecone Advisors, LLC | 7.800 | 0,00 | 743 | 11,24 | ||||
| 2026-02-05 | 13F | Cambridge Investment Research Advisors, Inc. | 80.567 | 0,38 | 8 | 0,00 | ||||
| 2026-02-10 | 13F | Savant Capital, LLC | 246.738 | 24.121 | ||||||
| 2026-02-11 | 13F | Jpmorgan Chase & Co | 24.773 | 0,55 | 2.422 | 3,20 | ||||
| 2026-01-21 | 13F | Capital Investment Advisory Services, LLC | 38 | 0,00 | 4 | 0,00 | ||||
| 2026-01-12 | 13F | Rialto Wealth Management, LLC | 1.518 | 0,00 | 148 | 2,78 | ||||
| 2026-02-12 | 13F | Betterment LLC | 9.762 | 7,13 | 1 | |||||
| 2026-01-26 | 13F | Cwm, Llc | 75.969 | -8,28 | 7 | 0,00 | ||||
| 2026-02-04 | 13F | Pensionmark Financial Group, Llc | 42.172 | 4,44 | 4.123 | 7,20 | ||||
| 2026-02-17 | 13F | Russell Investments Group, Ltd. | 136 | 0,00 | 13 | 8,33 | ||||
| 2026-02-12 | 13F | Commonwealth Equity Services, Llc | 26.329 | -1,74 | 2.574 | 128.550,00 | ||||
| 2026-02-17 | 13F | Susquehanna International Group, Llp | 10.672 | 11,56 | 1.043 | 14,62 | ||||
| 2026-04-08 | 13F | Miracle Mile Advisors, LLC | 16.225 | 0,00 | 1.651 | 4,04 | ||||
| 2026-02-13 | 13F | Hurley Capital, LLC | 734 | 0,00 | 72 | 2,90 | ||||
| 2025-10-21 | 13F | Crowley Wealth Management, Inc. | 0 | -100,00 | 0 | |||||
| 2026-02-10 | 13F | CIBC World Markets Inc. | 20.001 | 1,60 | 1.955 | 4,32 | ||||
| 2026-02-17 | 13F | Royal Bank Of Canada | 29.595 | 20,41 | 2.893 | 23,58 | ||||
| 2026-01-30 | 13F | American Financial & Tax Strategies Inc | 17.848 | -16,63 | 1.745 | -14,43 | ||||
| 2026-02-13 | 13F | Aptus Capital Advisors, LLC | 1.068 | 0,00 | 104 | 2,97 | ||||
| 2026-01-30 | 13F | Exencial Wealth Advisors, Llc | 30.488 | 0,02 | 2.980 | 2,69 | ||||
| 2026-02-17 | 13F | Raymond James Financial Inc | 60.525 | -74,15 | 5.917 | -73,46 | ||||
| 2026-02-09 | 13F | Integrity Alliance, Llc. | 2.317 | 8,27 | 227 | 11,33 | ||||
| 2026-02-17 | 13F | Creative Planning | 5.612 | -18,03 | 549 | -15,82 | ||||
| 2026-02-13 | 13F | Kestra Advisory Services, LLC | 0 | -100,00 | 0 | |||||
| 2026-01-26 | 13F | Valmark Advisers, Inc. | 4.407 | -1,19 | 431 | 1,42 | ||||
| 2026-04-15 | 13F | Fifth Third Securities, Inc. | 7.042 | -0,94 | 716 | 3,17 | ||||
| 2026-02-18 | 13F | Sierra Capital LLC | 5.623 | 0,21 | 1 | |||||
| 2026-02-10 | 13F | Bank of New York Mellon Corp | 0 | -100,00 | 0 | |||||
| 2026-04-16 | 13F | Triad Wealth Partners, LLC | 6.502 | 75,11 | 662 | 82,60 | ||||
| 2026-01-23 | 13F | Assetmark, Inc | 8.807 | 16,57 | 861 | 19,61 | ||||
| 2026-02-13 | 13F | Mml Investors Services, Llc | 12.928 | -4,64 | 1.264 | -2,09 | ||||
| 2026-02-12 | 13F | Wealthspire Advisors, LLC | 0 | -100,00 | 0 | |||||
| 2026-01-14 | 13F | Spire Wealth Management | 19.047 | 4,42 | 1.862 | 7,20 | ||||
| 2026-02-11 | 13F | O'shaughnessy Asset Management, Llc | 345 | 0,00 | 34 | 3,13 | ||||
| 2026-01-15 | 13F | Saxony Capital Management, LLC | 2.273 | 0,00 | 222 | 2,78 | ||||
| 2026-02-17 | 13F | Aqr Capital Management Llc | 6.520 | 9,73 | 637 | 12,74 | ||||
| 2026-02-05 | 13F | Financial Strategies Group, Inc. | 13.525 | -1,31 | 1.376 | 5,77 | ||||
| 2026-02-19 | 13F | Birchwood Financial Partners, Inc. | 348 | 34 | ||||||
| 2026-04-20 | 13F | Brandywine Oak Private Wealth Llc | 33.571 | -1,18 | 3.415 | 2,83 | ||||
| 2026-02-05 | 13F | Stephens Inc /ar/ | 2.914 | 0,00 | 285 | 2,53 | ||||
| 2026-04-15 | 13F | Financial Management Professionals, Inc. | 82 | 0,00 | 8 | 0,00 | ||||
| 2026-02-02 | 13F | Fifth Third Bancorp | 1.448 | 142 | ||||||
| 2026-01-15 | 13F | Capital Advisors Inc/ok | 146.347 | 14.307 | ||||||
| 2026-02-11 | 13F | TruNorth Capital Management, LLC | 3.414 | -4,61 | 334 | -2,06 | ||||
| 2026-04-14 | 13F | Thurston, Springer, Miller, Herd & Titak, Inc. | 114 | 0,00 | 12 | 0,00 | ||||
| 2026-01-26 | 13F | Asset Dedication, LLC | 584 | 0,00 | 57 | 3,64 | ||||
| 2026-01-23 | 13F | Sage Mountain Advisors LLC | 1.762 | 0,00 | 172 | 2,99 | ||||
| 2026-01-29 | 13F | Concurrent Investment Advisors, LLC | 178.768 | 17.476 | ||||||
| 2026-02-17 | 13F | Two Sigma Investments, Lp | 15.941 | 1.558 | ||||||
| 2026-02-13 | 13F | Bragg Financial Advisors, Inc | 3.130 | 0,00 | 306 | 2,35 | ||||
| 2026-02-03 | 13F | SBI Securities Co., Ltd. | 78 | 0,00 | 8 | 0,00 | ||||
| 2025-11-06 | 13F | Asset Planning Corporation | 126.165 | 1,79 | 12.013 | 13,27 | ||||
| 2026-02-04 | 13F | One Day In July LLC | 137.380 | -12,56 | 13.430 | -10,23 | ||||
| 2026-02-03 | 13F | International Assets Investment Management, Llc | 80 | 8 | ||||||
| 2026-02-04 | 13F | Atlantic Union Bankshares Corp | 2 | 0,00 | 0 | |||||
| 2026-02-06 | 13F | Envestnet Portfolio Solutions, Inc. | 11.073 | 7,78 | 1.083 | 10,63 | ||||
| 2026-01-23 | 13F | Private Wealth Management Group, LLC | 619 | 61 | ||||||
| 2026-02-13 | 13F | Centaurus Financial, Inc. | 1.613 | -7,67 | 0 | |||||
| 2025-11-12 | 13F | Transce3nd, LLC | 0 | -100,00 | 0 | |||||
| 2026-01-22 | 13F | Glass Jacobson Investment Advisors llc | 436 | 32,93 | 43 | 35,48 | ||||
| 2026-02-17 | 13F | Citadel Advisors Llc | 0 | -100,00 | 0 | |||||
| 2026-01-20 | 13F | Relyea Zuckerberg Hanson LLC | 7.557 | -3,95 | 739 | -1,47 | ||||
| 2026-02-13 | 13F | Citigroup Inc | 580 | -0,17 | 57 | 1,82 | ||||
| 2026-02-17 | 13F | Advisory Services Network, LLC | 0 | -100,00 | 0 | |||||
| 2026-02-13 | 13F | Resources Investment Advisors, LLC. | 8.617 | 0,00 | 842 | 2,68 | ||||
| 2026-02-05 | 13F | Atria Investments Llc | 168.771 | -0,28 | 16.499 | 2,38 | ||||
| 2026-02-04 | 13F | Bailard, Inc. | 8.171 | 0,00 | 799 | 2,57 | ||||
| 2026-01-28 | 13F | HB Wealth Management, LLC | 10.519 | 21,38 | 1.028 | 24,61 | ||||
| 2026-04-10 | 13F | Naviter Wealth, LLC | 12.814 | 0,00 | 1.304 | 4,07 | ||||
| 2026-02-09 | 13F | Harbour Investments, Inc. | 628 | 342,25 | 61 | 369,23 | ||||
| 2026-02-05 | 13F | Passive Capital Management, LLC. | 2.058 | 201 | ||||||
| 2026-02-11 | 13F | Gwn Securities Inc. | 2.350 | -10,03 | 230 | -8,03 | ||||
| 2026-02-10 | 13F | Envestnet Asset Management Inc | 79.793 | -2,60 | 7.801 | 0,00 | ||||
| 2026-02-13 | 13F | Icon Wealth Advisors, LLC | 4.438 | 0,00 | 434 | 2,61 | ||||
| 2026-02-05 | 13F | Td Private Client Wealth Llc | 2.673 | -8,43 | 261 | -5,78 | ||||
| 2026-02-13 | 13F | Wells Fargo & Company/mn | 58.541 | -1,30 | 5.723 | 1,33 | ||||
| 2026-02-17 | 13F | Wellington Management Group Llp | 63.526 | -50,37 | 6.210 | -49,05 | ||||
| 2026-02-18 | 13F | EP Wealth Advisors, Inc. | 25.311 | -1,16 | 2.474 | 12,92 | ||||
| 2026-01-20 | 13F | Stratos Wealth Partners, LTD. | 2.102 | 0,00 | 205 | 2,50 | ||||
| 2026-01-30 | 13F | Richardson Capital Management LLC | 13 | 0,00 | 1 | 0,00 | ||||
| 2026-02-13 | 13F | Mariner, LLC | 24.814 | -11,34 | 2.426 | -8,97 | ||||
| 2026-02-10 | 13F | Keyvantage Wealth, Llc | 6.523 | -19,05 | 638 | -16,95 | ||||
| 2026-02-09 | 13F | St. Louis Trust Co | 16.300 | 0,00 | 1.593 | 2,64 | ||||
| 2026-01-23 | 13F | Legend Financial Advisors, Inc. | 97.791 | 1,22 | 9.560 | 3,92 | ||||
| 2026-03-03 | 13F/A | Integrated Investment Consultants, LLC | 126.053 | 1,25 | 12.323 | 3,95 | ||||
| 2025-11-10 | 13F | EverSource Wealth Advisors, LLC | 0 | -100,00 | 0 | -100,00 | ||||
| 2026-02-13 | 13F | Van Eck Associates Corp | 0 | -100,00 | 0 | |||||
| 2026-02-17 | 13F | Private Advisor Group, LLC | 15.997 | -15,83 | 1.564 | -13,60 | ||||
| 2026-02-06 | 13F | HighTower Advisors, LLC | 5.787 | -4,27 | 566 | -1,74 | ||||
| 2026-04-17 | 13F | Total Clarity Wealth Management, Inc. | 0 | -100,00 | 0 | |||||
| 2026-02-14 | 13F | Howe & Rusling Inc | 0 | -100,00 | 0 | |||||
| 2026-02-11 | 13F | Parallel Advisors, LLC | 369 | 0,00 | 36 | 2,86 |