Grundlæggende statistik
| Institutionelle aktier (lange) | 205.273.703 - 97,59% (ex 13D/G) - change of -39,62MM shares -16,18% MRQ |
| Institutionel værdi (lang) | $ 18.041.977 USD ($1000) |
Institutionelt ejerskab og aktionærer
Somnigroup International Inc. (US:TPX) har 542 institutionelle ejere og aktionærer, der har indsendt 13D/G- eller 13F-formularer til Securities Exchange Commission (SEC). Disse institutioner har i alt 205,273,703 aktier. Største aktionærer omfatter Fmr Llc, BlackRock, Inc., Vanguard Group Inc, Select Equity Group, L.P., Windacre Partnership Llc, Linonia Partnership LP, State Street Corp, Abrams Capital Management, L.p., Browning West Lp, and Geode Capital Management, Llc .
Somnigroup International Inc. (NYSE:TPX) institutionel ejerskabsstruktur viser aktuelle positioner i virksomheden efter institutioner og fonde, samt seneste ændringer i positionsstørrelse. Større aktionærer kan omfatte individuelle investorer, investeringsforeninger, hedgefonde eller institutioner. Skema 13D angiver, at investoren besidder (eller besidder) mere end 5 % af virksomheden og har til hensigt (eller har til hensigt at) aktivt at forfølge en ændring i forretningsstrategi. Skema 13G indikerer en passiv investering på over 5%.

Fondens stemningsscore
Fund Sentiment Score (fka Ownership Accumulation Score) finder de aktier, der bliver mest købt af fonde. Det er resultatet af en sofistikeret, multi-faktor kvantitativ model, der identificerer virksomheder med de højeste niveauer af institutionel akkumulering. Scoringsmodellen bruger en kombination af den samlede stigning i oplyste ejere, ændringerne i porteføljeallokeringer i disse ejere og andre målinger. Tallet går fra 0 til 100, hvor højere tal indikerer et højere niveau af akkumulering for sine jævnaldrende, og 50 er gennemsnittet.
Opdateringsfrekvens: Dagligt
Se Ownership Explorer, som giver en liste over højest rangerende virksomheder.
AI+ Ask Fintel’s AI assistant about Somnigroup International Inc..
Select a question to share a public post with an AI-crafted answer.
Thinking of good questions…
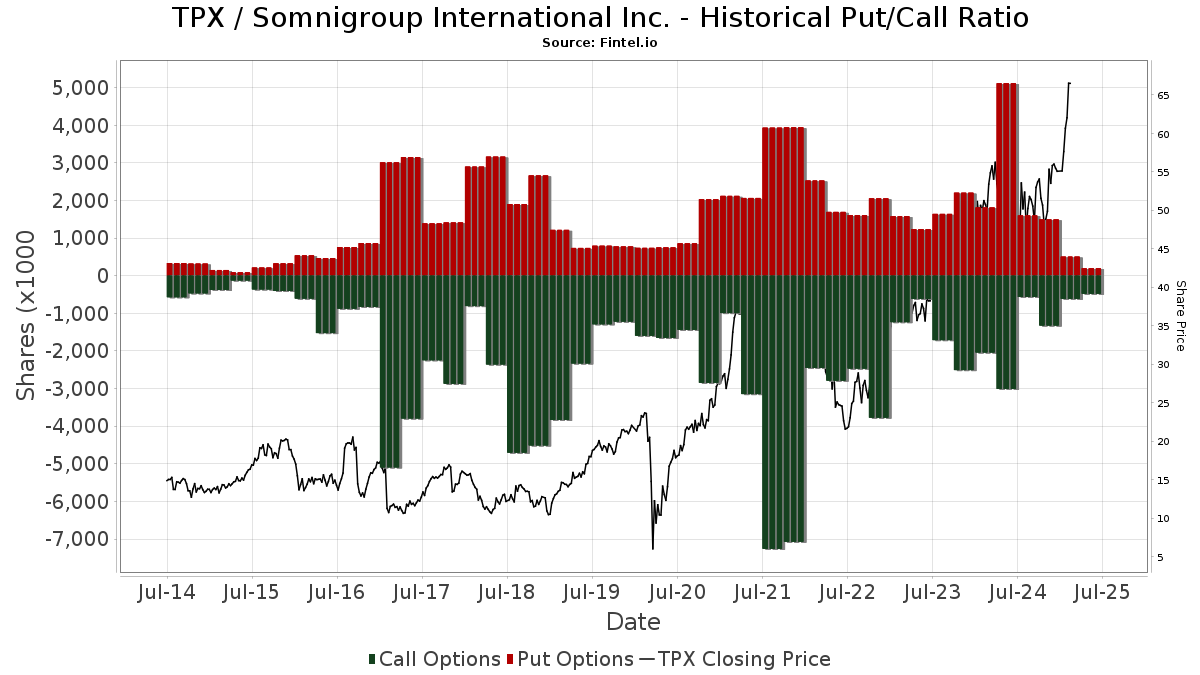
Institutionel Put/Call-forhold
Ud over at indberette standardaktie- og gældsudstedelser skal institutter med mere end 100 mill. aktiver under forvaltning også oplyse deres put- og call-optionsbeholdninger. Da salgsoptioner generelt indikerer negativ stemning, og købsoptioner indikerer positiv stemning, kan vi få en fornemmelse af den overordnede institutionelle stemning ved at plotte forholdet mellem put og kald. Diagrammet til højre viser det historiske put/call-forhold for dette instrument.
Brug af Put/Call Ratio som en indikator for investorernes stemning overvinder en af de vigtigste mangler ved at bruge totalt institutionelt ejerskab, som er, at en betydelig mængde af aktiver under forvaltning investeres passivt for at spore indekser. Passivt forvaltede fonde køber typisk ikke optioner, så indikatoren for put/call-forholdet følger mere nøje følelsen af aktivt forvaltede fonde.
13F og NPORT arkivering
Detaljer om 13F-arkivering er gratis. Detaljer om NP-ansøgninger kræver et premium-medlemskab. Grønne rækker angiver nye positioner. Røde rækker angiver lukkede positioner. Klik på linket ikon for at se den fulde transaktionshistorik.
Opgrader
for at låse premium-data op og eksportere til Excel ![]() .
.
| Fil dato | Kilde | Investor | Type | Gennemsnitlig pris (Øst) |
Aktier | Δ Aktier (%) |
Rapporteret Værdi ($1000) |
Δ Værdi (%) |
Port Alloc (%) |
|
|---|---|---|---|---|---|---|---|---|---|---|
| 2026-02-13 | 13F | Squarepoint Ops LLC | 1.232.152 | 127,15 | 110.007 | 140,49 | ||||
| 2026-02-17 | 13F | Dark Forest Capital Management Lp | 11.079 | 989 | ||||||
| 2026-04-17 | 13F | Tectonic Advisors Llc | 124.776 | 1,36 | 9.223 | -16,08 | ||||
| 2026-02-12 | 13F | Elo Mutual Pension Insurance Co | 16.452 | 1.469 | ||||||
| 2026-01-30 | 13F | Mitsubishi UFJ Trust & Banking Corp | 7.243 | 647 | ||||||
| 2026-02-17 | 13F | Quantinno Capital Management LP | 120.762 | 17,03 | 10.782 | 23,89 | ||||
| 2026-02-10 | 13F | Rothschild Investment Llc | 23 | 360,00 | 2 | |||||
| 2026-02-17 | 13F | Shelton Capital Management | 6.373 | 0,00 | 569 | 5,77 | ||||
| 2026-02-17 | 13F | Man Group plc | 50.483 | 447,00 | 4.507 | 479,31 | ||||
| 2026-02-12 | 13F | Aristides Capital LLC | 0 | -100,00 | 0 | |||||
| 2026-04-27 | 13F | Colonial River Wealth Management, LLC | 4.220 | 22,46 | 312 | 1,30 | ||||
| 2026-02-13 | 13F | Blueshift Asset Management, LLC | 18.037 | 22,43 | 1.610 | 29,63 | ||||
| 2026-02-17 | 13F | Banco Bilbao Vizcaya Argentaria, S.a. | 0 | -100,00 | 0 | |||||
| 2026-01-12 | 13F | Rialto Wealth Management, LLC | 6 | -14,29 | 1 | |||||
| 2026-04-17 | 13F | Bell Investment Advisors, Inc | 37 | 0,00 | 3 | -33,33 | ||||
| 2026-04-28 | 13F | Bogart Wealth, LLC | 6 | 0 | ||||||
| 2026-02-12 | 13F | Federation des caisses Desjardins du Quebec | 17.386 | 16,50 | 1.552 | 23,37 | ||||
| 2026-02-12 | 13F | Campbell & CO Investment Adviser LLC | 42.962 | 508,35 | 3.836 | 544,54 | ||||
| 2026-02-13 | 13F | De Lisle Partners LLP | 8.000 | 0,00 | 714 | 5,93 | ||||
| 2026-04-29 | 13F/A | Salem Investment Counselors Inc | 19.200 | 0,00 | 1.419 | -17,21 | ||||
| 2026-04-28 | 13F | Golden State Equity Partners | 121 | 9 | ||||||
| 2026-02-13 | 13F | FORA Capital, LLC | 0 | -100,00 | 0 | |||||
| 2026-03-04 | 13F | SHP Wealth Management | 583 | 52 | ||||||
| 2026-02-11 | 13F | Erste Asset Management GmbH | 0 | 0 | ||||||
| 2026-04-07 | 13F | CoreCap Advisors, LLC | 438 | 13,47 | 32 | -5,88 | ||||
| 2026-04-08 | 13F | Wealth Enhancement Advisory Services, Llc | 5.933 | -31,53 | 433 | -45,04 | ||||
| 2026-02-09 | 13F | Putnam Fl Investment Management Co | 2.282 | 204 | ||||||
| 2026-02-12 | 13F | Penserra Capital Management LLC | 3.093 | -21,36 | 0 | |||||
| 2026-02-17 | 13F | XTX Topco Ltd | 12.189 | 1.088 | ||||||
| 2026-02-13 | 13F | Silvant Capital Management LLC | 40.837 | 3.646 | ||||||
| 2026-02-13 | 13F | First Trust Advisors Lp | 60.965 | 4,31 | 5.443 | 10,43 | ||||
| 2026-01-28 | 13F | Universal- Beteiligungs- und Servicegesellschaft mbH | 33.914 | 6,13 | 3.028 | 12,36 | ||||
| 2026-02-17 | 13F | Emmett Investment Management, LP | 75.750 | 2,99 | 6.722 | 9,84 | ||||
| 2026-04-28 | 13F | Quent Capital, LLC | 1.069 | -9,25 | 79 | -24,76 | ||||
| 2026-02-17 | 13F | Summit Trail Advisors, Llc | 42.253 | -12,88 | 3.772 | -7,75 | ||||
| 2026-04-29 | 13F | Skopos Labs, Inc. | 8.300 | 18,39 | 614 | -3,62 | ||||
| 2026-02-17 | 13F | ExodusPoint Capital Management, LP | 0 | -100,00 | 0 | -100,00 | ||||
| 2026-05-01 | 13F | Arizona State Retirement System | 54.774 | -1,22 | 4.049 | -18,22 | ||||
| 2026-02-19 | 13F | CI Private Wealth, LLC | 4.845 | 433 | ||||||
| 2026-02-13 | 13F | Ubs Asset Management Americas Inc | 488.896 | 10,69 | 43.649 | 17,18 | ||||
| 2026-02-17 | 13F | Tower Research Capital LLC (TRC) | 6.739 | -35,53 | 602 | -31,78 | ||||
| 2026-02-11 | 13F | Clearbridge Investments, LLC | 477.272 | 42.611 | ||||||
| 2026-02-17 | 13F | Jain Global LLC | 3.083 | 275 | ||||||
| 2026-01-30 | 13F | State of New Jersey Common Pension Fund D | 68.114 | -0,04 | 6.081 | 5,83 | ||||
| 2026-02-09 | 13F | Jefferies Financial Group Inc. | 6.788 | 606 | ||||||
| 2026-02-13 | 13F | Treasurer of the State of North Carolina | 84.708 | -6,81 | 8 | 0,00 | ||||
| 2026-04-28 | 13F | K.J. Harrison & Partners Inc | 0 | -100,00 | 0 | |||||
| 2025-11-06 | 13F | Bryce Point Capital, LLC | 0 | -100,00 | 0 | |||||
| 2026-02-17 | 13F | Algert Global Llc | 26.540 | 2 | ||||||
| 2026-04-29 | 13F | Axxcess Wealth Management, Llc | 5.200 | -37,18 | 384 | -47,97 | ||||
| 2026-02-13 | 13F | Hudson Bay Capital Management LP | 91.961 | 38,85 | 8.210 | 47,00 | ||||
| 2026-02-17 | 13F | No Street GP LP | 330.000 | 29.462 | ||||||
| 2026-04-08 | 13F | Grove Bank & Trust | 0 | -100,00 | 0 | |||||
| 2026-02-03 | 13F | Makena Capital Management Llc | 218.934 | -36,61 | 19.546 | -32,88 | ||||
| 2026-02-10 | 13F | Texas Yale Capital Corp. | 38.480 | 0,00 | 3.435 | 5,86 | ||||
| 2026-02-09 | 13F | Legal & General Group Plc | 317.532 | -3,52 | 28.349 | 2,15 | ||||
| 2026-02-10 | 13F | Coyle Financial Counsel LLC | 22.485 | -11,56 | 2.007 | -6,39 | ||||
| 2026-01-16 | 13F | Longboard Asset Management, LP | 0 | -100,00 | 0 | |||||
| 2026-01-30 | 13F | Turning Point Benefit Group, Inc. | 9 | 0,00 | 0 | |||||
| 2026-02-04 | 13F | Atlantic Union Bankshares Corp | 1.623 | 0,00 | 145 | 5,88 | ||||
| 2026-02-17 | 13F | Weiss Asset Management LP | 8.925 | 797 | ||||||
| 2026-02-18 | 13F | Vident Advisory, LLC | 8.604 | -12,65 | 768 | -7,47 | ||||
| 2026-02-17 | 13F | Laird Norton Trust Company, Llc | 3.028 | 270 | ||||||
| 2026-04-29 | 13F | Police & Firemen's Retirement System of New Jersey | 85.415 | -0,18 | 6.314 | -17,36 | ||||
| 2026-02-18 | 13F | Greenstone Partners & Co., LLC | 525.774 | 46.941 | ||||||
| 2026-02-13 | 13F | Motiv8 Investments LLC | 23 | 0 | ||||||
| 2026-01-29 | 13F | Concurrent Investment Advisors, LLC | 11.249 | 332,32 | 1.004 | 358,45 | ||||
| 2026-02-06 | 13F | Pinnbrook Capital Management Lp | 33.064 | -75,08 | 2.952 | -73,63 | ||||
| 2026-02-10 | 13F | Zweig-DiMenna Associates LLC | 58.941 | -3,38 | 5.262 | 2,29 | ||||
| 2026-02-12 | 13F | Brinker Capital Investments, LLC | 32.187 | -8,24 | 2.874 | -2,87 | ||||
| 2026-04-13 | 13F | IFP Advisors, Inc | 2.302 | -36,25 | 170 | -47,20 | ||||
| 2026-04-20 | 13F | State of Alaska, Department of Revenue | 21.026 | 0,96 | 2 | 0,00 | ||||
| 2026-02-13 | 13F | Commerce Bank | 8.202 | 0,77 | 732 | 6,71 | ||||
| 2025-11-14 | 13F | SummitTX Capital, L.P. | 0 | -100,00 | 0 | |||||
| 2026-01-26 | 13F | Mirae Asset Global Investments Co., Ltd. | 467 | 42 | ||||||
| 2026-02-17 | 13F | FIL Ltd | 443 | 2,07 | 40 | 8,33 | ||||
| 2026-02-17 | 13F | Mercer Global Advisors Inc /adv | 13.211 | 22,08 | 1.180 | 29,39 | ||||
| 2026-02-17 | 13F | United Capital Financial Advisers, Llc | 4.248 | 379 | ||||||
| 2026-04-10 | 13F | Abound Wealth Management | 3 | 0,00 | 0 | |||||
| 2026-02-09 | 13F | 12th Street Asset Management Company, LLC | 424.601 | -2,69 | 37.908 | 3,02 | ||||
| 2026-02-06 | 13F | Global Retirement Partners, LLC | 11.051 | 55,76 | 987 | 64,88 | ||||
| 2026-02-13 | 13F | Public Employees Retirement Association Of Colorado | 15.745 | 0,00 | 1 | 0,00 | ||||
| 2026-02-17 | 13F | Kemnay Advisory Services Inc. | 85.396 | -4,59 | 7.624 | 1,02 | ||||
| 2026-04-23 | 13F | Oppenheimer Asset Management Inc. | 142.143 | -3,30 | 10.507 | -19,93 | ||||
| 2026-04-30 | 13F | Private Trust Co Na | 514 | -3,93 | 38 | -21,28 | ||||
| 2026-02-06 | 13F | Vestmark Advisory Solutions, Inc. | 30.099 | 134,93 | 2.687 | 148,80 | ||||
| 2026-02-17 | 13F | D. E. Shaw & Co., Inc. | 30.605 | 2.732 | ||||||
| 2026-04-29 | 13F | Hughes Financial Services, LLC | 16 | 0,00 | 1 | 0,00 | ||||
| 2026-04-28 | 13F | SBI Securities Co., Ltd. | 4 | 33,33 | 0 | |||||
| 2026-02-17 | 13F | Osterweis Capital Management Inc | 309 | 0,00 | 28 | 3,85 | ||||
| 2026-02-17 | 13F | Aquatic Capital Management LLC | 20.595 | 1.839 | ||||||
| 2026-02-12 | 13F | Cloud Capital Management, LLC | 0 | -100,00 | 0 | |||||
| 2026-02-17 | 13F | ISAM Funds (UK) Ltd | 0 | -100,00 | 0 | |||||
| 2026-02-17 | 13F | Utah Retirement Systems | 33.362 | 0,00 | 2.979 | 5,87 | ||||
| 2025-11-12 | 13F | Westpac Banking Corp | 0 | -100,00 | 0 | |||||
| 2026-04-29 | 13F | Nilsine Partners, LLC | 180.573 | 3,20 | 14.363 | -8,07 | ||||
| 2026-04-22 | 13F | Spirepoint Private Client, Llc | 58.101 | 2,09 | 4.295 | -15,49 | ||||
| 2026-02-13 | 13F | Advyzon Investment Management, LLC | 3.568 | 41,76 | 319 | 50,00 | ||||
| 2026-04-21 | 13F | Morey & Quinn Wealth Partners, LLC | 16.252 | 0,00 | 1.201 | -17,17 | ||||
| 2026-02-17 | 13F | Balyasny Asset Management Llc | 395.593 | 843,33 | 35.319 | 898,81 | ||||
| 2026-02-17 | 13F | Artisan Partners Limited Partnership | 3.072.610 | 274.323 | ||||||
| 2026-02-13 | 13F | OpenArc Corporate Advisory, LLC | 5.542 | 495 | ||||||
| 2026-01-26 | 13F | Main Street Group, LTD | 0 | -100,00 | 0 | |||||
| 2026-02-13 | 13F | Southeast Asset Advisors Inc. | 0 | -100,00 | 0 | |||||
| 2026-04-27 | 13F | Mount Yale Investment Advisors, LLC | 3.256 | 241 | ||||||
| 2026-04-30 | 13F | Kestra Advisory Services, LLC | 0 | -100,00 | 0 | |||||
| 2026-02-17 | 13F | Point72 Asset Management, L.P. | Put | 5.100 | 0,00 | 455 | 5,81 | |||
| 2026-02-17 | 13F | Point72 Asset Management, L.P. | Call | 39.400 | 0,00 | 3.518 | 5,87 | |||
| 2026-02-17 | 13F | Point72 Asset Management, L.P. | 364.564 | 210,47 | 32.548 | 228,70 | ||||
| 2025-11-14 | 13F | Texas Permanent School Fund | 0 | -100,00 | 0 | |||||
| 2026-04-30 | 13F | Cromwell Holdings LLC | 32 | 0,00 | 2 | 0,00 | ||||
| 2026-02-13 | 13F | Mml Investors Services, Llc | 43.179 | 0,71 | 3.855 | 6,61 | ||||
| 2026-05-01 | 13F | Fifth Third Bancorp | 50.757 | 2.471,28 | 3.752 | 2.031,82 | ||||
| 2026-02-13 | 13F | Boston Partners | 3.974.443 | -22,62 | 354.884 | -18,07 | ||||
| 2026-02-11 | 13F | Manchester Capital Management LLC | 3 | 0 | ||||||
| 2025-11-14 | 13F | Castle Hook Partners LP | 0 | -100,00 | 0 | |||||
| 2026-04-15 | 13F | Activest Wealth Management | 23 | -37,84 | 2 | -66,67 | ||||
| 2026-02-12 | 13F | Brown Brothers Harriman & Co | 4.527 | 106,90 | 404 | 119,57 | ||||
| 2026-02-09 | 13F | IPG Investment Advisors LLC | 84.236 | 43,66 | 7.521 | 52,10 | ||||
| 2026-05-01 | 13F | Hantz Financial Services, Inc. | 5.612 | 15,00 | 0 | |||||
| 2026-05-01 | 13F | Martel Wealth Advisors Inc | 9.186 | 679 | ||||||
| 2026-02-17 | 13F | Darsana Capital Partners LP | 3.000.000 | -25,00 | 267.840 | -20,60 | ||||
| 2026-04-29 | 13F | Montag A & Associates Inc | 8 | 1 | ||||||
| 2026-02-13 | 13F | Wolf Hill Capital Management, LP | 0 | -100,00 | 0 | |||||
| 2026-02-17 | 13F | Moore Capital Management, Lp | 29.081 | 56,10 | 2.596 | 65,25 | ||||
| 2026-02-10 | 13F | New Mexico Educational Retirement Board | 42.424 | 0,00 | 4 | 0,00 | ||||
| 2026-02-12 | 13F | Voya Investment Management Llc | 25.120 | -7,55 | 2.243 | -2,14 | ||||
| 2026-04-27 | 13F | HB Wealth Management, LLC | 12.092 | 1,74 | 894 | -15,83 | ||||
| 2026-02-17 | 13F | IHT Wealth Management, LLC | 3.487 | -12,87 | 311 | -7,72 | ||||
| 2026-02-17 | 13F | Price T Rowe Associates Inc /md/ | 722.567 | 7,66 | 65 | 14,29 | ||||
| 2026-02-13 | 13F | Sculptor Capital LP | 900.000 | -34,88 | 80.352 | -31,05 | ||||
| 2026-02-12 | 13F | Jane Street Group, Llc | Call | 28.800 | -49,47 | 2.571 | -46,50 | |||
| 2026-04-21 | 13F | PharVision Advisers, LLC | 0 | -100,00 | 0 | |||||
| 2026-02-11 | 13F | Zions Bancorporation, National Association /ut/ | 169 | 15 | ||||||
| 2026-02-12 | 13F | Jane Street Group, Llc | 663.064 | 6.070,33 | 59.198 | 6.434,00 | ||||
| 2026-02-09 | 13F | Atlantic Trust, LLC | 15 | 0,00 | 1 | 0,00 | ||||
| 2026-02-17 | 13F | Amundi | 12.145 | 192,02 | 1.084 | 208,83 | ||||
| 2026-02-12 | 13F | Jane Street Group, Llc | Put | 12.100 | 0,83 | 1.080 | 6,82 | |||
| 2026-02-17 | 13F | Trexquant Investment LP | 120.924 | 10.796 | ||||||
| 2026-02-17 | 13F | EMG Holdings, L.P. | 0 | -100,00 | 0 | |||||
| 2026-02-03 | 13F | Bokf, Na | 36.007 | 0,00 | 3.215 | 5,86 | ||||
| 2026-02-05 | 13F | Amalgamated Bank | 99.631 | -1,94 | 9 | 0,00 | ||||
| 2026-02-05 | 13F | Allworth Financial LP | 377 | -0,26 | 34 | 6,45 | ||||
| 2025-11-14 | 13F | Dendur Capital Lp | 0 | -100,00 | 0 | |||||
| 2026-02-04 | 13F | Summit Wealth Group Llc / Co | 0 | -100,00 | 0 | -100,00 | ||||
| 2026-02-11 | 13F | O'shaughnessy Asset Management, Llc | 43.380 | 7,93 | 3.873 | 14,25 | ||||
| 2026-02-11 | 13F | Strategy Asset Managers Llc | 3.085 | -4,49 | 275 | 1,10 | ||||
| 2026-02-17 | 13F | Occudo Quantitative Strategies Lp | 36.599 | 817,04 | 3.268 | 872,32 | ||||
| 2026-04-24 | 13F | Abacus Wealth Partners, LLC | 2.892 | 0,00 | 214 | -17,44 | ||||
| 2026-04-24 | 13F | Yousif Capital Management, Llc | 63.129 | -4,80 | 4.667 | -24,04 | ||||
| 2026-02-17 | 13F | Ararat Capital Management, LP | 106.002 | -20,57 | 9.464 | -15,91 | ||||
| 2026-04-15 | 13F | Exchange Traded Concepts, Llc | 3.256 | 43,69 | 241 | 18,81 | ||||
| 2025-11-14 | 13F | Bayesian Capital Management, LP | 0 | -100,00 | 0 | -100,00 | ||||
| 2026-04-24 | 13F | CHICAGO TRUST Co NA | 3.810 | 0,00 | 282 | -17,35 | ||||
| 2026-02-12 | 13F | Rossby Financial, LCC | 47 | 88,00 | 4 | 100,00 | ||||
| 2026-04-27 | 13F | Moran Wealth Management, LLC | 67.202 | -21,14 | 4.968 | -34,71 | ||||
| 2026-02-14 | 13F | Rockefeller Capital Management L.P. | 2.322 | 91,58 | 207 | 102,94 | ||||
| 2025-11-14 | 13F | Holocene Advisors, LP | 0 | -100,00 | 0 | -100,00 | ||||
| 2026-01-21 | 13F | Clayton Financial Group LLC | 0 | -100,00 | 0 | |||||
| 2026-01-29 | 13F | Calamos Advisors LLC | 32.937 | 10,15 | 2.941 | 16,62 | ||||
| 2026-02-17 | 13F | Optiver Holding B.V. | 94 | -76,08 | 8 | -75,76 | ||||
| 2026-02-12 | 13F | Colonial Trust Co / SC | 0 | -100,00 | 0 | -100,00 | ||||
| 2026-04-09 | 13F | Vista Investment Partners Llc | 66.446 | 2,27 | 4.907 | -15,40 | ||||
| 2026-04-16 | 13F | Capital Advisors, Ltd. LLC | 18 | 0,00 | 0 | |||||
| 2026-02-13 | 13F | Sachem Head Capital Management LP | 0 | -100,00 | 0 | |||||
| 2026-02-17 | 13F | Delaware Management Holdings, Inc. | 113.362 | 10.121 | ||||||
| 2025-11-13 | 13F | Riggs Asset Managment Co. Inc. | 0 | -100,00 | 0 | |||||
| 2026-02-06 | 13F | Gsa Capital Partners Llp | 0 | -100,00 | 0 | |||||
| 2026-02-18 | 13F | GWM Advisors LLC | 0 | -100,00 | 0 | |||||
| 2026-02-13 | 13F | Resources Investment Advisors, LLC. | 3.565 | -1,00 | 318 | 4,95 | ||||
| 2026-04-27 | 13F | Qrg Capital Management, Inc. | 4.377 | -31,19 | 324 | -43,03 | ||||
| 2026-03-03 | 13F | NWF Advisory Services Inc. | 7.000 | 0,00 | 625 | 5,76 | ||||
| 2026-02-06 | 13F | Intrust Bank Na | 2.555 | 0,00 | 228 | 6,05 | ||||
| 2026-02-12 | 13F | BRYN MAWR TRUST Co | 0 | -100,00 | 0 | -100,00 | ||||
| 2026-02-13 | 13F | SRS Capital Advisors, Inc. | 4.436 | -20,74 | 396 | -16,10 | ||||
| 2025-11-07 | 13F | Shell Asset Management Co | 3.759 | -57,12 | 0 | |||||
| 2026-02-09 | 13F | Catalyst Funds Management Pty Ltd | 18.002 | 1.607 | ||||||
| 2026-04-14 | 13F | Zrc Wealth Management, Llc | 16 | 1 | ||||||
| 2026-01-15 | 13F | Allspring Global Investments Holdings, LLC | 1.874.835 | 6,91 | 166.373 | 14,01 | ||||
| 2026-02-03 | 13F | Ballentine Partners, LLC | 6.715 | 0,78 | 600 | 6,77 | ||||
| 2026-02-11 | 13F | Ameritas Investment Partners, Inc. | 38.469 | 3.435 | ||||||
| 2026-02-13 | 13F | Beutel, Goodman & Co Ltd. | 5.635 | 0,00 | 1 | |||||
| 2026-02-17 | 13F | Lombard Odier Asset Management (USA) Corp | 6.503 | -50,02 | 581 | -47,13 | ||||
| 2026-01-27 | 13F | Brighton Jones Llc | 0 | -100,00 | 0 | |||||
| 2026-02-11 | 13F | Group One Trading, L.p. | Call | 19.900 | 24,38 | 1.777 | 31,65 | |||
| 2026-04-27 | 13F | Ethic Inc. | 12.954 | -7,38 | 958 | -23,32 | ||||
| 2026-02-11 | 13F | Group One Trading, L.p. | Put | 1.500 | 0,00 | 134 | 5,56 | |||
| 2025-11-14 | 13F | Greenstone Partners, L.P. | 272.017 | 22.939 | ||||||
| 2026-04-30 | 13F | Teacher Retirement System Of Texas | 27.445 | 219,13 | 2.029 | 164,41 | ||||
| 2026-02-13 | 13F | Smartleaf Asset Management LLC | 658 | 14,43 | 59 | 25,53 | ||||
| 2026-02-10 | 13F | Md Sass Investors Services Inc | 585.651 | 0,67 | 52.287 | 6,58 | ||||
| 2026-02-13 | 13F | Cynosure Management, Llc | 5.365 | 479 | ||||||
| 2026-02-09 | 13F | Quest Partners LLC | 14.236 | -32,42 | 1.271 | -28,49 | ||||
| 2026-02-13 | 13F | Brown Advisory Inc | 18.535 | 89,04 | 1.655 | 100,24 | ||||
| 2026-04-23 | 13F | North Growth Management Ltd. | 202.000 | -5,16 | 15 | -26,32 | ||||
| 2026-02-10 | 13F | Eurizon Capital SGR S.p.A. | 1.985 | 179 | ||||||
| 2025-11-14 | 13F | Wolverine Trading, Llc | Call | 5.600 | 462 | |||||
| 2026-02-09 | 13F | Rit Capital Partners Plc | 0 | -100,00 | 0 | |||||
| 2025-11-14 | 13F | Wolverine Trading, Llc | Put | 7.000 | 42,86 | 578 | 74,85 | |||
| 2026-01-29 | 13F | UBS Group AG | 1.777.747 | -29,55 | 158.717 | -25,41 | ||||
| 2026-02-17 | 13F | Numerai GP LLC | 39.446 | 869,67 | 3.522 | 926,53 | ||||
| 2026-04-27 | 13F | New York State Teachers Retirement System | 159.457 | -4,09 | 12 | -21,43 | ||||
| 2026-02-09 | 13F | Keating Financial Advisory Services, Inc. | 646 | 58 | ||||||
| 2026-02-13 | 13F | Wells Fargo & Company/mn | 227.806 | 3,59 | 20.338 | 9,67 | ||||
| 2026-02-13 | 13F | Ieq Capital, Llc | 3.493 | 0,11 | 312 | 5,78 | ||||
| 2026-02-11 | 13F | 111 Capital | 0 | -100,00 | 0 | -100,00 | ||||
| 2026-02-13 | 13F | Manufacturers Life Insurance Company, The | 120.107 | -4,14 | 10.723 | 1,49 | ||||
| 2025-11-14 | 13F | Wolverine Trading, Llc | 10.262 | 33,24 | 847 | 63,01 | ||||
| 2026-02-12 | 13F | Dimensional Fund Advisors Lp | 2.027.673 | -0,03 | 181.042 | 5,87 | ||||
| 2026-04-28 | 13F | Core Wealth Advisors, Llc | 0 | -100,00 | 0 | |||||
| 2026-02-17 | 13F | Sig Brokerage, Lp | 2.368 | 211 | ||||||
| 2026-02-11 | 13F | Deutsche Bank Ag\ | 43.928 | 95,96 | 3.922 | 107,46 | ||||
| 2026-03-04 | 13F | Leonteq Securities AG | 0 | -100,00 | 0 | |||||
| 2026-04-23 | 13F | SJS Investment Consulting Inc. | 43 | 65,38 | 3 | 50,00 | ||||
| 2026-02-09 | 13F | Williamson Legacy Group, LLC | 10.169 | 155,12 | 908 | 169,94 | ||||
| 2025-11-13 | 13F | Fuller & Thaler Asset Management, Inc. | 0 | -100,00 | 0 | |||||
| 2026-01-30 | 13F | Us Bancorp \de\ | 3.379 | 5,92 | 302 | 11,90 | ||||
| 2026-02-12 | 13F | Loomis Sayles & Co L P | 171.644 | 4,59 | 15.324 | 10,72 | ||||
| 2026-02-13 | 13F | Victory Capital Management Inc | 88.190 | 31,18 | 7.874 | 38,88 | ||||
| 2026-01-07 | 13F | Sagespring Wealth Partners, Llc | 2.953 | 1,79 | 264 | 7,79 | ||||
| 2026-02-13 | 13F | Barclays Plc | 308.918 | -21,06 | 27.580 | -16,42 | ||||
| 2025-11-14 | 13F | D1 Capital Partners L.P. | 0 | -100,00 | 0 | -100,00 | ||||
| 2026-02-13 | 13F | Bluedoor Private Wealth, Llc | 5.005 | 447 | ||||||
| 2026-02-13 | 13F | Maverick Capital Ltd | 1.141.820 | -0,91 | 101.942 | 4,90 | ||||
| 2026-02-13 | 13F | Barclays Plc | Call | 80.700 | 0,00 | 7.205 | 5,86 | |||
| 2026-02-24 | 13F/A | Pacer Advisors, Inc. | 31.772 | 13,71 | 2.837 | 20,37 | ||||
| 2026-04-27 | 13F | Y-Intercept (Hong Kong) Ltd | 0 | -100,00 | 0 | |||||
| 2026-02-06 | 13F | HighTower Advisors, LLC | 46.849 | 2,78 | 4.183 | 8,82 | ||||
| 2026-02-17 | 13F | Jones Financial Companies Lllp | 2.157 | 10,96 | 193 | 20,00 | ||||
| 2026-04-24 | 13F | Root Financial Partners, LLC | 184 | -13,21 | 14 | -27,78 | ||||
| 2026-04-09 | 13F | Curated Wealth Partners LLC | 3.000 | 0,00 | 222 | -17,23 | ||||
| 2026-01-29 | 13F | IMC-Chicago, LLC | 11.746 | -30,24 | 1.049 | -26,15 | ||||
| 2026-02-12 | 13F | California Public Employees Retirement System | 352.848 | 0,70 | 31.502 | 6,61 | ||||
| 2026-02-17 | 13F | Russell Investments Group, Ltd. | 52.807 | 6,06 | 4.716 | 12,34 | ||||
| 2026-01-29 | 13F | IMC-Chicago, LLC | Put | 31.900 | 25,10 | 2.848 | 32,47 | |||
| 2026-02-17 | 13F | Twinbeech Capital Lp | 154.638 | 13.806 | ||||||
| 2026-01-29 | 13F | IMC-Chicago, LLC | Call | 39.800 | 53,08 | 3.553 | 62,09 | |||
| 2026-04-13 | 13F | Artemis Investment Management LLP | 378.527 | -10,23 | 27.981 | -25,67 | ||||
| 2026-02-18 | 13F | Hanlon Investment Management, Inc. | 9.584 | -5,89 | 856 | -0,35 | ||||
| 2026-02-09 | 13F | Zeno Equity Partners LLP | 267.584 | 14,85 | 23.890 | 21,60 | ||||
| 2026-02-13 | 13F | SW Investment Management LLC | 575.000 | 0,00 | 53.336 | 10,00 | ||||
| 2026-02-12 | 13F | Banco BTG Pactual S.A. | 2.787 | 249 | ||||||
| 2026-02-02 | 13F | Winslow Asset Management Inc | 4.882 | -1,67 | 0 | |||||
| 2026-02-05 | 13F | Qsemble Capital Management, LP | 76.081 | 52,16 | 6.793 | 61,10 | ||||
| 2026-02-03 | 13F | NewEdge Wealth, LLC | 2.606 | 233 | ||||||
| 2026-02-17 | 13F | Advisory Services Network, LLC | 13.820 | 4,00 | 1.234 | 10,09 | ||||
| 2025-11-06 | 13F | Ameritas Advisory Services, LLC | 0 | -100,00 | 0 | |||||
| 2026-04-24 | 13F | Key FInancial Inc | 135 | 0,00 | 10 | -25,00 | ||||
| 2026-04-22 | 13F | Spire Wealth Management | 0 | -100,00 | 0 | |||||
| 2026-04-29 | 13F | Envestnet Portfolio Solutions, Inc. | 0 | -100,00 | 0 | |||||
| 2026-04-22 | 13F | Pictet Asset Management Holding SA | 31.853 | 10,38 | 2.355 | -8,62 | ||||
| 2026-02-02 | 13F | Van Berkom & Associates Inc. | 13.456 | -98,27 | 1 | -98,46 | ||||
| 2026-02-17 | 13F | Northern Trust Corp | 1.727.894 | -2,07 | 154.266 | 3,68 | ||||
| 2026-02-17 | 13F | Scopia Capital Management Lp | 107.304 | -47,34 | 9.580 | -44,24 | ||||
| 2026-02-11 | 13F | Simplex Trading, Llc | Call | 0 | -100,00 | 0 | ||||
| 2026-04-28 | 13F | Strata Wealth Advisors, LLC | 15.929 | -18,84 | 1.177 | -32,82 | ||||
| 2026-02-17 | 13F | London Co Of Virginia | 0 | -100,00 | 0 | |||||
| 2026-02-11 | 13F | Simplex Trading, Llc | Put | 0 | -100,00 | 0 | ||||
| 2026-02-17 | 13F | Raymond James Financial Inc | 294.272 | 5,20 | 26.273 | 11,37 | ||||
| 2026-02-11 | 13F | Los Angeles Capital Management Llc | 887 | 71 | ||||||
| 2026-04-28 | 13F | Flagship Harbor Advisors, Llc | 0 | -100,00 | 0 | |||||
| 2026-02-04 | 13F | Dogwood Wealth Management LLC | 171 | 0,00 | 15 | 7,14 | ||||
| 2026-02-17 | 13F | Millennium Management Llc | 231.298 | -2,29 | 20.650 | 3,44 | ||||
| 2026-02-04 | 13F | Seelaus Asset Management LLC | 0 | -100,00 | 0 | |||||
| 2026-04-10 | 13F | Salvus Wealth Management, LLC | 58.485 | -1,65 | 4.323 | -18,57 | ||||
| 2026-02-13 | 13F | AlTi Global, Inc. | 5.456 | -92,24 | 487 | -91,78 | ||||
| 2026-02-17 | 13F | Boothbay Fund Management, Llc | 85.492 | 76,88 | 7.633 | 87,29 | ||||
| 2026-01-29 | 13F | Comerica Bank | 52.656 | -8,86 | 4.701 | -3,51 | ||||
| 2026-02-17 | 13F | Cresset Asset Management, LLC | 53.044 | 5,26 | 4.736 | 11,44 | ||||
| 2026-02-11 | 13F | Cerity Partners LLC | 42.542 | 9,44 | 3.798 | 15,86 | ||||
| 2026-02-13 | 13F | Morgan Stanley | 1.178.755 | 10,08 | 105.239 | 16,54 | ||||
| 2026-02-12 | 13F | South Dakota Investment Council | 50.965 | -10,06 | 5 | 0,00 | ||||
| 2026-02-17 | 13F | Alliancebernstein L.p. | 253.591 | 4,33 | 22.641 | 10,45 | ||||
| 2026-02-09 | 13F | New Age Alpha Advisors, LLC | 37.597 | 42,63 | 3.357 | 51,04 | ||||
| 2026-02-12 | 13F | Great Lakes Advisors, Llc | 5.289 | -1,08 | 472 | 4,89 | ||||
| 2026-02-10 | 13F | Envestnet Asset Management Inc | 480.620 | -2,23 | 42.910 | 3,51 | ||||
| 2026-02-13 | 13F | Transamerica Financial Advisors, Inc. | 83.623 | 7.466 | ||||||
| 2026-02-17 | 13F | Public Employees Retirement System Of Ohio | 111.673 | -10,87 | 9.970 | -5,64 | ||||
| 2026-02-10 | 13F | Robertson Opportunity Capital, LLC | 439.826 | 0,00 | 39.268 | 5,87 | ||||
| 2026-02-12 | 13F | Castleark Management Llc | 51.235 | 3,41 | 4.574 | 9,48 | ||||
| 2026-02-13 | 13F | Macquarie Group Ltd | 0 | -100,00 | 0 | |||||
| 2026-04-20 | 13F | Hilton Head Capital Partners, LLC | 472 | 0,00 | 35 | -19,05 | ||||
| 2026-04-07 | 13F | Signaturefd, Llc | 1.583 | 14,38 | 117 | -4,88 | ||||
| 2026-04-22 | 13F | Princeton Global Asset Management LLC | 0 | -100,00 | 0 | |||||
| 2026-02-13 | 13F | Colony Group, LLC | 10.856 | 6,60 | 969 | 12,94 | ||||
| 2026-02-12 | 13F | JPL Wealth Management, LLC | 0 | -100,00 | 0 | |||||
| 2026-02-13 | 13F | Soros Fund Management Llc | 220.000 | -64,82 | 19.642 | -62,76 | ||||
| 2026-03-12 | 13F/A | Peak6 Llc | 24.936 | 127,41 | 2.226 | 140,91 | ||||
| 2026-02-12 | 13F | CIBC Private Wealth Group, LLC | 28.992 | 1,77 | 2.588 | 7,74 | ||||
| 2026-02-11 | 13F | Twin Tree Management, LP | 3.853 | 54,31 | 344 | 63,33 | ||||
| 2026-02-13 | 13F | Neuberger Berman Group LLC | 922.294 | -1,16 | 82.389 | 4,81 | ||||
| 2026-02-10 | 13F | Ellevest, Inc. | 3.003 | 8,76 | 268 | 15,52 | ||||
| 2026-02-17 | 13F | Fmr Llc | 29.221.594 | -5,99 | 2.608.904 | -0,47 | ||||
| 2026-04-30 | 13F | Acorn Wealth Advisors, LLC | 2.880 | -4,92 | 213 | -21,48 | ||||
| 2026-04-23 | 13F | Vista Investment Partners Ii, Llc | 37.123 | -1,08 | 2.744 | -18,09 | ||||
| 2026-02-18 | 13F/A | Empowered Funds, LLC | 40.965 | 18,94 | 3.657 | 25,93 | ||||
| 2026-02-13 | 13F | State Street Corp | 6.749.199 | -2,00 | 602.568 | 3,76 | ||||
| 2026-05-01 | 13F | Securian Asset Management, Inc | 15.472 | 1,14 | 1.144 | -16,26 | ||||
| 2026-02-13 | 13F | Edgestream Partners, L.P. | 0 | -100,00 | 0 | |||||
| 2026-02-12 | 13F | Xponance, Inc. | 39.896 | -6,94 | 3.562 | -1,49 | ||||
| 2026-04-09 | 13F | Park Place Capital Corp | 482 | 36 | ||||||
| 2026-01-26 | 13F | Cwm, Llc | 1.858 | 15,48 | 0 | |||||
| 2026-02-13 | 13F | Panagora Asset Management Inc | 86.728 | 1.363,52 | 7.743 | 1.451,70 | ||||
| 2026-04-30 | 13F | Hsbc Holdings Plc | 44.922 | 264,51 | 3.286 | 197,29 | ||||
| 2026-04-13 | 13F | Mather Group, Llc. | 154 | 11 | ||||||
| 2026-02-09 | 13F | Hartland & Co., LLC | 1.152 | 71,68 | 103 | 82,14 | ||||
| 2026-04-06 | 13F | CX Institutional | 143 | 0 | ||||||
| 2026-04-30 | 13F | Nuveen, LLC | 501.384 | 3,76 | 37.062 | -14,09 | ||||
| 2026-02-11 | 13F | United Financial Planning Group LLC | 4 | 0 | ||||||
| 2026-02-06 | 13F | Larson Financial Group LLC | 38 | 31,03 | 3 | 50,00 | ||||
| 2026-02-12 | 13F | Bank Of Montreal /can/ | 154.401 | 423,25 | 13.785 | 454,02 | ||||
| 2026-02-13 | 13F | Financial Network Wealth Advisors LLC | 15 | 0,00 | 1 | 0,00 | ||||
| 2026-02-11 | 13F | Simplex Trading, Llc | 0 | -100,00 | 0 | |||||
| 2026-02-17 | 13F | Interval Partners, LP | 11.107 | 992 | ||||||
| 2026-04-29 | 13F | Oregon Public Employees Retirement Fund | 43.110 | 3,36 | 3.187 | -14,42 | ||||
| 2026-02-17 | 13F | Creative Planning | 21.413 | 10,23 | 1.912 | 16,67 | ||||
| 2026-02-17 | 13F | SageView Advisory Group, LLC | 174 | 16 | ||||||
| 2026-04-10 | 13F | Quaker Wealth Management, LLC | 8 | 0,00 | 1 | |||||
| 2026-02-13 | 13F | Charles Schwab Investment Management Inc | 1.374.844 | 0,31 | 122.746 | 6,20 | ||||
| 2026-04-21 | 13F | Kieckhefer Group Llc | 17.532 | 0,00 | 1.296 | -17,25 | ||||
| 2026-02-13 | 13F | Parkside Financial Bank & Trust | 572 | 1,60 | 51 | 8,51 | ||||
| 2026-04-15 | 13F | Fortitude Family Office, LLC | 28 | 47,37 | 2 | 100,00 | ||||
| 2026-02-17 | 13F | Tabor Asset Management, LP | 61.418 | -13,96 | 5.483 | -8,91 | ||||
| 2026-02-13 | 13F | American Century Companies Inc | 35.734 | 5,10 | 3.190 | 11,27 | ||||
| 2026-02-17 | 13F | Anabranch Capital Management, LP | 304.956 | -7,86 | 27.226 | -2,46 | ||||
| 2026-02-05 | 13F | North Dakota State Investment Board | 7.118 | 635 | ||||||
| 2026-02-19 | 13F | Atomi Financial Group, Inc. | 5.473 | 15,83 | 489 | 22,61 | ||||
| 2026-02-13 | 13F | Sei Investments Co | 804.286 | 291,64 | 71.807 | 314,66 | ||||
| 2026-04-15 | 13F | Bayforest Capital Ltd | 971 | 7,65 | 72 | -11,25 | ||||
| 2026-02-05 | 13F | Edge Financial Advisors LLC | 5.900 | 279 | ||||||
| 2026-04-29 | 13F | American Capital Advisory, LLC | 7 | 75,00 | 1 | |||||
| 2026-02-17 | 13F | Voloridge Investment Management, Llc | 591.448 | 52.804 | ||||||
| 2026-02-17 | 13F | Jump Financial, LLC | 17.940 | 1.602 | ||||||
| 2026-02-13 | 13F | Squarepoint Ops LLC | Call | 0 | -100,00 | 0 | -100,00 | |||
| 2026-04-17 | 13F | CENTRAL TRUST Co | 1.044 | -0,19 | 77 | -17,20 | ||||
| 2026-02-11 | 13F | SOUTH STATE Corp | 58 | 544,44 | 5 | |||||
| 2026-05-01 | 13F | Avion Wealth | 0 | -100,00 | 0 | |||||
| 2026-02-17 | 13F | Blair William & Co/il | 14.873 | 1.328 | ||||||
| 2026-04-17 | 13F | IFC & Insurance Marketing, Inc. | 0 | -100,00 | 0 | |||||
| 2026-02-13 | 13F | Walleye Trading LLC | Put | 58.400 | 11,66 | 5.214 | 18,21 | |||
| 2026-04-13 | 13F | Gateway Investment Advisers Llc | 7.692 | 569 | ||||||
| 2026-02-13 | 13F | Dnca Finance | 121.000 | 272,31 | 10.803 | 294,23 | ||||
| 2026-02-13 | 13F | Prudential Financial Inc | 9.044 | -47,27 | 817 | -43,57 | ||||
| 2026-02-06 | 13F | Tortoise Investment Management, LLC | 0 | -100,00 | 0 | |||||
| 2026-02-06 | 13F | Covestor Ltd | 200 | -0,50 | 0 | |||||
| 2026-04-23 | 13F | First Pacific Financial | 19 | 1 | ||||||
| 2026-02-13 | 13F | Walleye Trading LLC | Call | 44.900 | 28,65 | 4.009 | 36,19 | |||
| 2026-02-10 | 13F | Quantbot Technologies LP | 55.552 | 4.960 | ||||||
| 2026-04-16 | 13F | Toth Financial Advisory Corp | 3 | 0,00 | 0 | |||||
| 2026-04-24 | 13F | ProShare Advisors LLC | 8.417 | -0,01 | 622 | -17,18 | ||||
| 2026-02-13 | 13F | MAI Capital Management | 49 | -14,04 | 4 | 0,00 | ||||
| 2026-02-13 | 13F | Pinnacle Wealth Planning Services, Inc. | 98 | 9 | ||||||
| 2026-02-06 | 13F | Pnc Financial Services Group, Inc. | 10.926 | 1,32 | 975 | 7,26 | ||||
| 2026-02-17 | 13F | Adage Capital Partners Gp, L.l.c. | 333.000 | -17,57 | 29.730 | -12,74 | ||||
| 2026-02-12 | 13F | New York State Common Retirement Fund | 100.419 | 2,55 | 8.965 | 8,57 | ||||
| 2026-01-29 | 13F | Ashton Thomas Private Wealth, LLC | 17.047 | 0,41 | 1.522 | 6,29 | ||||
| 2026-02-13 | 13F | Gts Securities Llc | 2.956 | 264 | ||||||
| 2026-01-27 | 13F | Evergreen Capital Management Llc | 4.842 | -13,61 | 432 | -8,47 | ||||
| 2026-02-17 | 13F | Lotus Technology Management, LP | 12.243 | 1.093 | ||||||
| 2026-04-20 | 13F | Trust Co Of Oklahoma | 36.372 | 0,00 | 2.689 | -17,22 | ||||
| 2026-04-17 | 13F | Brown, Lisle/cummings, Inc. | 18 | 1 | ||||||
| 2026-02-17 | 13F | Citadel Advisors Llc | Call | 56.500 | 1,25 | 5.044 | 7,21 | |||
| 2026-02-17 | 13F | Citadel Advisors Llc | 42.072 | -91,79 | 3.756 | -91,31 | ||||
| 2026-01-07 | 13F | Aventura Private Wealth, LLC | 21 | 0,00 | 2 | 0,00 | ||||
| 2026-02-13 | 13F | National Bank Of Canada /fi/ | 8.208 | 26,02 | 732 | 33,33 | ||||
| 2026-02-17 | 13F | Citadel Advisors Llc | Put | 23.500 | -4,08 | 2.098 | 1,55 | |||
| 2026-02-09 | 13F | Annis Gardner Whiting Capital Advisors, LLC | 2 | 0 | ||||||
| 2026-02-12 | 13F | Principal Securities, Inc. | 3.573 | 5,31 | 319 | 11,19 | ||||
| 2026-02-04 | 13F | Clark Wealth Partners | 341 | 0,00 | 30 | 0,00 | ||||
| 2026-04-27 | 13F | Truist Financial Corp | 15.241 | -23,96 | 1.127 | -37,06 | ||||
| 2026-01-29 | 13F | Vanguard Group Inc | 18.813.858 | -0,91 | 1.679.701 | 4,91 | ||||
| 2026-02-04 | 13F | Virginia Retirement Systems Et Al | 2.300 | 205 | ||||||
| 2026-02-10 | 13F | Bnp Paribas Arbitrage, Sa | 40.658 | -18,50 | 3.630 | -13,74 | ||||
| 2026-02-12 | 13F | Swiss National Bank | 393.200 | 1,03 | 35.105 | 6,96 | ||||
| 2026-02-13 | 13F | Cornerstone Financial Management LLC | 13 | 1 | ||||||
| 2026-04-29 | 13F | Index Technologies Group LLC | 11.801 | 6,58 | 872 | -11,74 | ||||
| 2026-02-13 | 13F | Walleye Capital LLC | 2.594 | 190,16 | 232 | 208,00 | ||||
| 2026-02-11 | 13F | Illinois Municipal Retirement Fund | 32.172 | 0,54 | 2.872 | 6,45 | ||||
| 2026-02-13 | 13F | Goodnow Investment Group, Llc | 639.895 | -2,28 | 57.130 | 3,45 | ||||
| 2026-04-29 | 13F | Burney Co/ | 5.573 | -40,93 | 412 | -51,19 | ||||
| 2026-04-06 | 13F | GAMMA Investing LLC | 8.001 | -2,32 | 591 | -19,15 | ||||
| 2026-02-13 | 13F | Mariner, LLC | 53.726 | 4,15 | 4.798 | 10,28 | ||||
| 2026-02-17 | 13F | California State Teachers Retirement System | 189.368 | -0,12 | 16.907 | 5,74 | ||||
| 2026-01-27 | 13F | Seeds Investor Llc | 4.397 | 0,76 | 393 | 6,81 | ||||
| 2026-02-10 | 13F | Marshall & Sterling Wealth Advisors Inc. | 0 | -100,00 | 0 | |||||
| 2026-02-12 | 13F | Quadrant Capital Group Llc | 18.768 | 1,14 | 1.676 | 7,10 | ||||
| 2026-02-13 | 13F | 140 Summer Partners LP | 656.046 | -6,15 | 58.572 | -0,64 | ||||
| 2026-02-13 | 13F | Rivulet Capital, Llc | 0 | -100,00 | 0 | |||||
| 2026-02-13 | 13F | Walleye Capital LLC | Call | 16.900 | 356,76 | 1.509 | 383,33 | |||
| 2026-02-13 | 13F | Rhumbline Advisers | 552.772 | -5,29 | 49.351 | 0,27 | ||||
| 2026-02-13 | 13F | Walleye Capital LLC | Put | 3.100 | -8,82 | 277 | -3,50 | |||
| 2026-02-17 | 13F | Gotham Asset Management, LLC | 406.654 | 64,95 | 36.306 | 74,63 | ||||
| 2026-02-05 | 13F | Atria Investments Llc | 68.812 | 5,84 | 6.144 | 12,06 | ||||
| 2026-02-17 | 13F | Prelude Capital Management, Llc | 7.330 | 654 | ||||||
| 2026-04-20 | 13F | Louisiana State Employees Retirement System | 60.900 | 4,82 | 4.502 | -13,23 | ||||
| 2026-02-11 | 13F | Rise Advisors, LLC | 0 | -100,00 | 0 | -100,00 | ||||
| 2026-02-12 | 13F | Steward Partners Investment Advisory, Llc | 4.049 | -3,48 | 361 | 2,27 | ||||
| 2026-04-30 | 13F | Sequoia Financial Advisors, LLC | 36.757 | 578,93 | 2.717 | 462,53 | ||||
| 2026-02-09 | 13F | Coldstream Capital Management Inc | 5.966 | -8,29 | 533 | -2,92 | ||||
| 2026-04-21 | 13F | Vise Technologies, Inc. | 4.862 | 0,00 | 434 | 0,00 | ||||
| 2026-02-05 | 13F | Northwestern Mutual Investment Management Company, Llc | 46.964 | 0,39 | 4.193 | 6,26 | ||||
| 2026-02-05 | 13F | DnB Asset Management AS | 3.523 | 14,61 | 315 | 21,24 | ||||
| 2025-11-14 | 13F | Steadfast Capital Management Lp | 0 | -100,00 | 0 | -100,00 | ||||
| 2026-04-28 | 13F | Everence Capital Management Inc | 5.890 | 0,00 | 0 | |||||
| 2026-01-27 | 13F | Zurcher Kantonalbank (Zurich Cantonalbank) | 41.605 | 5,67 | 3.714 | 11,87 | ||||
| 2026-04-13 | 13F | Massmutual Trust Co Fsb/adv | 1.052 | -12,91 | 78 | -28,04 | ||||
| 2026-04-29 | 13F | CVA Family Office, LLC | 97 | 870,00 | 7 | |||||
| 2026-02-12 | 13F | BlackRock, Inc. | 19.663.848 | 1,20 | 1.755.588 | 7,14 | ||||
| 2026-02-10 | 13F | CIBC Asset Management Inc | 6.467 | 21,04 | 577 | 28,22 | ||||
| 2026-04-10 | 13F | Oak Thistle LLC | 11.823 | -25,10 | 874 | -38,04 | ||||
| 2026-02-03 | 13F | Crossmark Global Holdings, Inc. | 10.548 | 4,67 | 942 | 10,84 | ||||
| 2026-02-05 | 13F | IMG Wealth Management, Inc. | 17 | 0,00 | 2 | 0,00 | ||||
| 2026-02-10 | 13F | Axq Capital, Lp | 11.000 | 982 | ||||||
| 2026-01-29 | 13F | Simon Quick Advisors, Llc | 0 | -100,00 | 0 | |||||
| 2025-11-13 | 13F | GeoWealth Management, LLC | 0 | -100,00 | 0 | -100,00 | ||||
| 2026-02-10 | 13F/A | Northwestern Mutual Wealth Management Co | 4.053 | 34,56 | 362 | 42,13 | ||||
| 2026-02-12 | 13F | Johnson Financial Group, Inc. | 16 | 1 | ||||||
| 2026-02-17 | 13F | Wiley Bros.-aintree Capital, Llc | 15.688 | -14,47 | 1.376 | -11,06 | ||||
| 2026-02-17 | 13F | Signature Equity Partners, LLC | 235 | 21 | ||||||
| 2026-02-17 | 13F | Browning West Lp | 5.747.286 | -36,83 | 513.118 | -33,12 | ||||
| 2026-02-17 | 13F | Wellington Management Group Llp | 1.955.721 | -3,52 | 174.607 | 2,14 | ||||
| 2026-02-10 | 13F | Argent Trust Co | 9.173 | -1,18 | 819 | 4,60 | ||||
| 2026-02-13 | 13F | Aigen Investment Management, Lp | 13.427 | 1.199 | ||||||
| 2026-02-17 | 13F | Toronto Dominion Bank | 5.151 | 1,24 | 459 | 9,29 | ||||
| 2026-02-10 | 13F | Nomura Asset Management Co Ltd | 530 | 0,00 | 47 | 6,82 | ||||
| 2026-02-10 | 13F | Principia Wealth Advisory, LLC | 12 | -7,69 | 1 | 0,00 | ||||
| 2026-02-04 | 13F | Versor Investments LP | 12.379 | 1.105 | ||||||
| 2026-02-13 | 13F | Elwood Capital Partners Lp | 70.388 | -13,78 | 6.284 | -8,72 | ||||
| 2026-02-09 | 13F | Schwarz Dygos Wheeler Investment Advisors Llc | 8.250 | 0,00 | 737 | 5,90 | ||||
| 2026-04-07 | 13F | Park Avenue Securities Llc | 11.750 | -2,99 | 1 | -100,00 | ||||
| 2026-03-02 | 13F | Bank Of Hawaii | 10.822 | 17,54 | 966 | 24,48 | ||||
| 2025-11-14 | 13F | Financial Network Wealth Management LLC | 0 | -100,00 | 0 | |||||
| 2026-04-20 | 13F | Apella Capital, LLC | 2.369 | 0,04 | 201 | -4,74 | ||||
| 2026-04-22 | 13F | JNBA Financial Advisors | 0 | -100,00 | 0 | |||||
| 2026-04-27 | 13F | Koshinski Asset Management, Inc. | 4.039 | 299 | ||||||
| 2026-02-17 | 13F | Scientech Research LLC | 2.827 | 252 | ||||||
| 2026-02-02 | 13F | Benjamin Edwards Inc | 19.638 | 1,55 | 1.753 | 7,55 | ||||
| 2026-04-29 | 13F | Klp Kapitalforvaltning As | 45.100 | 3,20 | 3.334 | -14,56 | ||||
| 2026-02-17 | 13F | Windacre Partnership Llc | 9.325.800 | -0,52 | 832.607 | 5,32 | ||||
| 2026-02-17 | 13F | Schonfeld Strategic Advisors LLC | 127.706 | 3.045,47 | 11.402 | 3.233,63 | ||||
| 2026-01-30 | 13F | Sigma Planning Corp | 2.789 | 3,64 | 249 | 10,18 | ||||
| 2026-02-11 | 13F | Winton Capital Group Ltd | 2.600 | -97,42 | 232 | -97,27 | ||||
| 2026-02-11 | 13F | Jpmorgan Chase & Co | 3.429.208 | 7,29 | 306.160 | 13,59 | ||||
| 2026-04-30 | 13F | Donaldson Capital Management, Llc | 107.483 | 15,09 | 7.945 | -4,71 | ||||
| 2026-01-05 | 13F | Argent Capital Management Llc | 60.322 | -1,40 | 5.386 | 4,38 | ||||
| 2026-02-13 | 13F | Forest Avenue Capital Management LP | 695.566 | -0,10 | 62.100 | 5,77 | ||||
| 2026-04-22 | 13F | Janney Montgomery Scott LLC | 19.091 | 5,39 | 1 | 0,00 | ||||
| 2026-02-02 | 13F | Cornerstone Planning Group LLC | 25 | 1.150,00 | 2 | |||||
| 2025-11-14 | 13F | Binnacle Investments Inc | 37 | 3 | ||||||
| 2026-02-12 | 13F | Ironwood Investment Management Llc | 47.621 | -0,40 | 4.252 | 5,43 | ||||
| 2026-02-06 | 13F | Bare Financial Services, Inc | 16 | 1 | ||||||
| 2026-02-17 | 13F | Royal Bank Of Canada | 818.576 | -38,72 | 73.083 | -35,12 | ||||
| 2026-02-17 | 13F | Cetera Investment Advisers | 39.131 | 16,10 | 3.494 | 22,91 | ||||
| 2026-02-13 | 13F | Barclays Plc | Put | 0 | -100,00 | 0 | -100,00 | |||
| 2026-01-29 | 13F | Dunhill Financial, LLC | 4 | 0 | ||||||
| 2026-02-13 | 13F | Heights Point Management, LP | 61.437 | 5.485 | ||||||
| 2026-02-04 | 13F | Swiss Life Asset Management Ltd | 13.256 | 46,23 | 1.183 | 54,84 | ||||
| 2026-04-15 | 13F | Merit Financial Group, LLC | 0 | -100,00 | 0 | |||||
| 2025-11-14 | 13F | Silver Point Capital L.P. | 0 | -100,00 | 0 | |||||
| 2026-04-23 | 13F | Brown Miller Wealth Management, LLC | 5.200 | 7,88 | 384 | -10,70 | ||||
| 2025-11-14 | 13F | Cartenna Capital, LP | 0 | -100,00 | 0 | -100,00 | ||||
| 2026-02-12 | 13F | Ci Investments Inc. | 0 | -100,00 | 0 | |||||
| 2026-02-17 | 13F | Magnetar Financial LLC | 11.074 | 989 | ||||||
| 2026-02-13 | 13F | Level Four Advisory Services, Llc | 4.088 | 2,92 | 365 | 9,28 | ||||
| 2026-04-07 | 13F | Farther Finance Advisors, LLC | 6.435 | 56,23 | 474 | 28,88 | ||||
| 2026-04-28 | 13F | Handelsbanken Fonder AB | 79.420 | 37,83 | 6 | 0,00 | ||||
| 2026-04-24 | 13F | Strs Ohio | 96.335 | 4,78 | 7.121 | -13,24 | ||||
| 2026-02-17 | 13F | Eminence Capital, Lp | 313.755 | -79,04 | 28.012 | -77,81 | ||||
| 2026-04-16 | 13F | SG Americas Securities, LLC | 158.259 | 88,08 | 12 | 57,14 | ||||
| 2026-04-27 | 13F | Td Private Client Wealth Llc | 212 | -29,10 | 16 | -42,31 | ||||
| 2026-02-17 | 13F | Third Point LLC | 3.400.000 | 13,33 | 303.552 | 19,99 | ||||
| 2026-04-30 | 13F | First Horizon Corp | 355 | -23,49 | 26 | -36,59 | ||||
| 2026-01-29 | 13F | Teachers Retirement System Of The State Of Kentucky | 64.292 | 0,00 | 6 | 0,00 | ||||
| 2026-02-09 | 13F | Harbour Investments, Inc. | 43 | 258,33 | 4 | 200,00 | ||||
| 2026-02-13 | 13F | Bridgefront Capital, LLC | 8.533 | 119,75 | 762 | 132,72 | ||||
| 2026-04-17 | 13F | Fifth Third Wealth Advisors LLC | 6.136 | 4,19 | 454 | -13,71 | ||||
| 2026-02-10 | 13F | Natixis Advisors, L.p. | 459.163 | 12,30 | 41 | 17,65 | ||||
| 2026-02-11 | 13F | LPL Financial LLC | 170.623 | 9,81 | 15.233 | 16,26 | ||||
| 2026-02-17 | 13F | Warren Averett Asset Management, LLC | 9.244 | -5,19 | 825 | 0,36 | ||||
| 2026-04-21 | 13F | Xcel Wealth Management, LLC | 0 | -100,00 | 0 | |||||
| 2026-01-23 | 13F | Optima Capital Llc | 1 | 0 | ||||||
| 2026-02-13 | 13F | BNP Paribas Asset Management Holding S.A. | 2.704 | 35,88 | 0 | |||||
| 2026-02-17 | 13F | DV Trading LLC | 200 | 18 | ||||||
| 2026-02-17 | 13F | Linonia Partnership LP | 8.778.047 | 0,03 | 783.704 | 5,90 | ||||
| 2026-02-06 | 13F | Cullen/frost Bankers, Inc. | 900 | 80 | ||||||
| 2026-02-13 | 13F | Baird Financial Group, Inc. | 20.937 | 4,19 | 1.869 | 10,33 | ||||
| 2025-11-14 | 13F | Senator Investment Group LP | 0 | -100,00 | 0 | -100,00 | ||||
| 2026-02-10 | 13F | Private Wealth Asset Management, LLC | 3 | 0,00 | 0 | |||||
| 2026-02-17 | 13F | Fred Alger Management, Llc | 663.524 | -17,22 | 59.239 | -12,36 | ||||
| 2026-01-29 | 13F | State Of Michigan Retirement System | 49.638 | -0,60 | 4.432 | 5,22 | ||||
| 2025-11-14 | 13F | Peak6 Llc | Call | 0 | -100,00 | 0 | -100,00 | |||
| 2026-04-01 | 13F | Bangor Savings Bank | 0 | -100,00 | 0 | |||||
| 2026-04-27 | 13F | Greenleaf Trust | 10.478 | 0,44 | 775 | -16,86 | ||||
| 2026-02-17 | 13F | Qube Research & Technologies Ltd | 195.595 | 17.463 | ||||||
| 2026-02-17 | 13F | Guggenheim Capital Llc | 5.667 | 506 | ||||||
| 2026-02-13 | 13F | JustInvest LLC | 21.928 | 14,15 | 1.958 | 20,88 | ||||
| 2026-02-13 | 13F | Citigroup Inc | Call | 12.000 | 1.071 | |||||
| 2026-02-13 | 13F | Umb Bank N A/mo | 2.563 | 14,37 | 229 | 21,28 | ||||
| 2026-04-24 | 13F | Profund Advisors Llc | 5.248 | 11,97 | 388 | -7,42 | ||||
| 2026-02-13 | 13F | Citigroup Inc | 103.738 | 51,18 | 9.262 | 60,06 | ||||
| 2026-01-30 | 13F/A | M&t Bank Corp | 17.088 | 61,18 | 1.525 | 70,58 | ||||
| 2026-02-13 | 13F | Ontario Teachers Pension Plan Board | 7.573 | 676 | ||||||
| 2026-02-02 | 13F | Principal Financial Group Inc | 507.994 | -6,28 | 45.354 | -0,77 | ||||
| 2026-02-13 | 13F | Truvestments Capital Llc | 892 | 0,11 | 80 | 5,33 | ||||
| 2026-02-13 | 13F | Quarry LP | 931 | 83 | ||||||
| 2026-02-05 | 13F | Elyxium Wealth, LLC | 391 | 35 | ||||||
| 2026-01-14 | 13F | USA Financial Portformulas Corp | 0 | -100,00 | 0 | |||||
| 2026-02-06 | 13F | EverSource Wealth Advisors, LLC | 34.342 | -0,66 | 3.066 | 5,22 | ||||
| 2026-02-09 | 13F | Geode Capital Management, Llc | 4.375.264 | 9,27 | 390.699 | 15,69 | ||||
| 2026-04-08 | 13F | DiNuzzo Private Wealth, Inc. | 17 | 6,25 | 1 | 0,00 | ||||
| 2026-02-17 | 13F | Engineers Gate Manager LP | 249.128 | 46,54 | 22.242 | 55,15 | ||||
| 2026-05-01 | 13F | Welch & Forbes Llc | 0 | -100,00 | 0 | |||||
| 2026-02-12 | 13F | Wealthspire Advisors, LLC | 0 | -100,00 | 0 | |||||
| 2026-02-13 | 13F | Landscape Capital Management, L.l.c. | 0 | -100,00 | 0 | |||||
| 2026-02-17 | 13F | Hook Mill Capital Partners, LP | 258.723 | 191,45 | 23.099 | 208,59 | ||||
| 2026-02-20 | 13F | Dorsey Wright & Associates | 77.479 | 5,75 | 6.927 | 12,11 | ||||
| 2026-02-12 | 13F | State Board Of Administration Of Florida Retirement System | 174.851 | -4,24 | 15.611 | 1,38 | ||||
| 2026-04-17 | 13F | Murphy & Mullick Capital Management Corp | 2 | 0,00 | 0 | |||||
| 2026-04-20 | 13F | Ronald Blue Trust, Inc. | 758 | -1,04 | 56 | -17,65 | ||||
| 2026-02-17 | 13F | Hudson Way Capital Management LLC | 1.106.515 | -2,94 | 98.790 | 2,76 | ||||
| 2026-02-13 | 13F | Timucuan Asset Management Inc/fl | 3.001.702 | -3,63 | 267.992 | 2,03 | ||||
| 2026-02-10 | 13F | Intech Investment Management Llc | 50.519 | 172,63 | 4.510 | 188,73 | ||||
| 2026-02-13 | 13F | CTF Capital Management, LP | 101.440 | 9.057 | ||||||
| 2026-04-30 | 13F | Elevated Capital Advisors, LLC | 40 | 0,00 | 3 | -33,33 | ||||
| 2026-02-11 | 13F | Parallel Advisors, LLC | 2.271 | 2,62 | 203 | 8,60 | ||||
| 2026-04-22 | 13F | Stone House Investment Management, LLC | 13 | 0,00 | 1 | -100,00 | ||||
| 2026-04-22 | 13F | Sterling Capital Management LLC | 1.450 | 0,21 | 107 | -17,05 | ||||
| 2026-02-11 | 13F | Franklin Resources Inc | 147.773 | 9,29 | 13.193 | 15,71 | ||||
| 2025-11-13 | 13F | Canada Pension Plan Investment Board | 0 | -100,00 | 0 | -100,00 | ||||
| 2026-04-17 | 13F | PKO Investment Management Joint-Stock Co | 10.000 | 0,00 | 739 | -17,15 | ||||
| 2026-02-17 | 13F | Driehaus Capital Management Llc | 460.525 | 173,53 | 41.116 | 189,58 | ||||
| 2026-02-02 | 13F | Danske Bank A/s | 3.500 | 133,33 | 312 | 147,62 | ||||
| 2026-02-12 | 13F | Ensign Peak Advisors, Inc | 12.744 | -69,35 | 1.138 | -67,57 | ||||
| 2026-02-13 | 13F | Meritage Group LP | 2.403.651 | -20,83 | 214.598 | -16,19 | ||||
| 2026-02-17 | 13F | Susquehanna International Group, Llp | Call | 179.300 | 11,50 | 16.008 | 18,05 | |||
| 2026-02-17 | 13F | Aqr Capital Management Llc | 56.720 | 23,07 | 5.064 | 33,45 | ||||
| 2026-04-10 | 13F | First Bank & Trust | 4.233 | -0,75 | 313 | -17,89 | ||||
| 2026-01-29 | 13F | Sanctuary Advisors, LLC | 2.912 | 5,09 | 260 | 11,16 | ||||
| 2026-02-17 | 13F | Susquehanna International Group, Llp | 68.308 | 161,33 | 6.099 | 176,68 | ||||
| 2026-02-17 | 13F | Susquehanna International Group, Llp | Put | 54.100 | -4,59 | 4.830 | 1,02 | |||
| 2026-02-12 | 13F | Hrt Financial Lp | 8.996 | -67,19 | 1 | -100,00 | ||||
| 2026-05-01 | 13F | International Assets Investment Management, Llc | 109 | 18,48 | 8 | 0,00 | ||||
| 2026-02-17 | 13F | Avala Global LP | 1.449.193 | 0,00 | 129.384 | 5,87 | ||||
| 2025-11-12 | 13F | Modern Wealth Management, LLC | 0 | -100,00 | 0 | -100,00 | ||||
| 2026-02-13 | 13F | Schroder Investment Management Group | 6.915 | -1,80 | 624 | 7,40 | ||||
| 2026-02-17 | 13F | Ameriprise Financial Inc | 212.012 | -3,61 | 18.924 | 2,06 | ||||
| 2026-05-01 | 13F | HFM Investment Advisors, LLC | 5 | 0,00 | 0 | |||||
| 2026-05-01 | 13F/A | Custom Index Systems, Llc | 19.346 | 4,18 | 1.430 | -13,70 | ||||
| 2026-02-13 | 13F | Ausdal Financial Partners, Inc. | 3.610 | 43,20 | 322 | 51,89 | ||||
| 2026-02-18 | 13F | State of Tennessee, Treasury Department | 80.627 | -1,67 | 7.083 | 2,44 | ||||
| 2026-02-17 | 13F | Kinetic Partners Management, LP | 249.949 | 87,44 | 22.315 | 98,44 | ||||
| 2026-04-14 | 13F | Highlander Partners, L.P. | 14.000 | 1.035 | ||||||
| 2026-04-23 | 13F | Forum Financial Management, LP | 0 | -100,00 | 0 | |||||
| 2026-02-05 | 13F | Plante Moran Financial Advisors, LLC | 536 | 0,00 | 48 | 4,44 | ||||
| 2026-02-06 | 13F | Meiji Yasuda Asset Management Co Ltd. | 4.850 | 0,00 | 433 | 5,87 | ||||
| 2026-02-17 | 13F | Select Equity Group, L.P. | 10.429.043 | -10,95 | 931.105 | -5,73 | ||||
| 2026-04-06 | 13F | Versant Capital Management, Inc | 759 | 3,12 | 56 | -13,85 | ||||
| 2026-04-13 | 13F | Hm Payson & Co | 0 | -100,00 | 0 | |||||
| 2026-02-13 | 13F | Seneschal Advisors, LLC | 3 | 0 | ||||||
| 2026-02-09 | 13F | Fft Wealth Management Llc | 106.165 | -26,47 | 9.478 | -22,15 | ||||
| 2026-02-17 | 13F | Bridgeway Capital Management Inc | 24.650 | 2.201 | ||||||
| 2026-04-24 | 13F | Retirement Systems of Alabama | 314.328 | 24,77 | 23.235 | 3,31 | ||||
| 2025-11-14 | 13F | Lighthouse Investment Partners, LLC | 0 | -100,00 | 0 | |||||
| 2026-04-16 | 13F | Davis Capital Management | 4 | 0 | ||||||
| 2026-01-23 | 13F | Assetmark, Inc | 512 | 56,57 | 46 | 66,67 | ||||
| 2026-02-13 | 13F | Verition Fund Management LLC | Put | 22.900 | 0,00 | 2.045 | 5,85 | |||
| 2026-04-17 | 13F | Vermillion Wealth Management, Inc. | 17 | 1 | ||||||
| 2026-02-10 | 13F | Machina Capital S.a.s. | 2.612 | 233 | ||||||
| 2026-02-09 | 13F | Huntington National Bank | 206 | 25,61 | 18 | 38,46 | ||||
| 2026-02-10 | 13F | State of Wyoming | 14.941 | 593,64 | 1.334 | 636,46 | ||||
| 2026-02-13 | 13F | Verition Fund Management LLC | Call | 5.600 | -68,18 | 500 | -66,37 | |||
| 2026-02-13 | 13F | Verition Fund Management LLC | 118.530 | -33,55 | 10.582 | -29,65 | ||||
| 2026-02-04 | 13F | Advisor OS, LLC | 2.915 | 14,90 | 260 | 22,07 | ||||
| 2026-02-17 | 13F | Captrust Financial Advisors | 56.718 | 0,97 | 5.064 | 6,88 | ||||
| 2026-02-02 | 13F | Horizon Investments, LLC | 61.410 | 2.046.900,00 | 5.483 | |||||
| 2026-02-17 | 13F | Wealth Watch Advisors, INC | 32 | 3 | ||||||
| 2026-02-17 | 13F | State Of Wisconsin Investment Board | 222.735 | -5,36 | 19.886 | 0,19 | ||||
| 2026-05-01 | 13F | Thrivent Financial For Lutherans | 183.370 | 287,95 | 14 | 225,00 | ||||
| 2026-04-30 | 13F | LRI Investments, LLC | 66 | -52,17 | 5 | -66,67 | ||||
| 2026-04-23 | 13F | Farmers & Merchants Investments Inc | 171 | -1,16 | 13 | -20,00 | ||||
| 2026-04-14 | 13F | Bay Harbor Wealth Management, LLC | 10 | 66,67 | 1 | |||||
| 2026-04-13 | 13F | True Wealth Design, LLC | 18 | 12,50 | 1 | 0,00 | ||||
| 2026-04-14 | 13F | Nbc Securities, Inc. | 2 | 0 | ||||||
| 2026-02-13 | 13F | Ceredex Value Advisors LLC | 122.647 | -20,23 | 10.950 | -15,55 | ||||
| 2026-02-13 | 13F | Great West Life Assurance Co /can/ | 122.266 | -19,33 | 11 | -16,67 | ||||
| 2026-04-24 | 13F | Keybank National Association/oh | 0 | -100,00 | 0 | |||||
| 2026-04-29 | 13F | Garner Asset Management Corp | 0 | -100,00 | 0 | |||||
| 2026-02-17 | 13F | Tudor Investment Corp Et Al | 16.681 | 1.489 | ||||||
| 2026-02-17 | 13F | Snowden Capital Advisors LLC | 4.724 | -0,17 | 422 | 5,51 | ||||
| 2026-02-11 | 13F | Investors Towarzystwo Funduszy Inwestycyjnych Spolka Akcyjna | 10.500 | 937 | ||||||
| 2026-04-23 | 13F | Marquette Asset Management, LLC | 0 | -100,00 | 0 | |||||
| 2026-04-29 | 13F | WPG Advisers, LLC | 0 | -100,00 | 0 | |||||
| 2026-02-10 | 13F | Bank of New York Mellon Corp | 1.428.812 | -12,19 | 127.564 | -7,04 | ||||
| 2025-11-13 | 13F | Quantitative Investment Management, LLC | 0 | -100,00 | 0 | |||||
| 2026-01-28 | 13F | Salomon & Ludwin, LLC | 50 | 0,00 | 4 | 0,00 | ||||
| 2026-02-13 | 13F | Rafferty Asset Management, LLC | 3.528 | -2,70 | 315 | 2,95 | ||||
| 2026-02-17 | 13F | Janus Henderson Group Plc | 272.553 | 96,98 | 24.330 | 108,49 | ||||
| 2026-04-30 | 13F | Cambridge Investment Research Advisors, Inc. | 9.712 | -0,07 | 1 | |||||
| 2026-02-17 | 13F | Ameriflex Group, Inc. | 0 | -100,00 | 0 | |||||
| 2026-04-20 | 13F | Kestra Private Wealth Services, Llc | 8.518 | 13,14 | 630 | -6,40 | ||||
| 2026-02-12 | 13F | Beck Mack & Oliver Llc | 2.323.615 | 0,02 | 207.452 | 5,89 | ||||
| 2026-04-10 | 13F | Matrix Trust Co | 17.036 | 39,78 | 1 | 0,00 | ||||
| 2026-02-13 | 13F | Natixis | 0 | -100,00 | 0 | |||||
| 2026-02-17 | 13F | Beaconlight Capital, Llc | 94.357 | -4,13 | 8.424 | 1,51 | ||||
| 2026-02-12 | 13F | Renaissance Technologies Llc | 168.400 | 15.035 | ||||||
| 2026-02-17 | 13F | Maryland State Retirement & Pension System | 9.826 | 0,00 | 877 | 5,92 | ||||
| 2026-04-20 | 13F | Jfs Wealth Advisors, Llc | 99 | -10,00 | 7 | -22,22 | ||||
| 2026-02-10 | 13F | Norges Bank | 3.033.311 | 270.814 | ||||||
| 2026-02-13 | 13F | Stifel Financial Corp | 77.997 | -47,43 | 6.964 | -44,35 | ||||
| 2026-02-13 | 13F | Fieldview Capital Management, LLC | 58.420 | 223,62 | 5.216 | 242,64 | ||||
| 2025-11-12 | 13F | CIBC Bancorp USA Inc. | 29.328 | 2.473 | ||||||
| 2026-02-17 | 13F | Advisor Group Holdings, Inc. | 16.408 | -4,59 | 1.465 | 1,60 | ||||
| 2025-11-12 | 13F | NewSquare Capital LLC | 0 | -100,00 | 0 | |||||
| 2026-04-23 | 13F | MQS Management LLC | 4.062 | -15,45 | 300 | -29,91 | ||||
| 2026-04-30 | 13F | Torren Management, LLC | 23 | 0,00 | 2 | -50,00 | ||||
| 2026-02-17 | 13F | Sherbrooke Park Advisers Llc | 0 | -100,00 | 0 | |||||
| 2026-02-06 | 13F | Keystone Financial Group | 5.944 | 0,02 | 531 | 5,79 | ||||
| 2026-04-07 | 13F | Estate Planners Group, LLC | 906 | 81 | ||||||
| 2026-02-13 | 13F | Marshall Wace, Llp | 0 | -100,00 | 0 | |||||
| 2026-04-17 | 13F | AdvisorNet Financial, Inc | 10 | 11,11 | 1 | |||||
| 2026-01-28 | 13F | Geneos Wealth Management Inc. | 440 | -36,05 | 39 | -32,76 | ||||
| 2026-02-17 | 13F | Brevan Howard Capital Management LP | 78.442 | 5,23 | 7.045 | 12,06 | ||||
| 2026-04-30 | 13F | Nisa Investment Advisors, Llc | 32.502 | -32,68 | 2.403 | -44,27 | ||||
| 2026-02-12 | 13F | MetLife Investment Management, LLC | 112.188 | -4,38 | 10.016 | 1,24 | ||||
| 2026-02-19 | 13F | Invesco Ltd. | 1.639.022 | 14,37 | 146.332 | 21,08 | ||||
| 2026-01-28 | 13F | Fiduciary Wealth Partners, LLC | 2.847 | 0,14 | 254 | 6,28 | ||||
| 2026-02-09 | 13F | Lisanti Capital Growth, LLC | 24.785 | 65,90 | 2.213 | 75,69 | ||||
| 2026-02-17 | 13F | ArrowMark Colorado Holdings LLC | 216.846 | 19.360 | ||||||
| 2026-04-23 | 13F | CWM Advisors, LLC | 16 | 0,00 | 1 | 0,00 | ||||
| 2026-04-28 | 13F | Stephens Inc /ar/ | 3.998 | -1,09 | 296 | -18,06 | ||||
| 2026-04-24 | 13F | Canton Hathaway, LLC | 2.028 | -15,50 | 150 | -30,37 | ||||
| 2026-04-06 | 13F | Washington Trust Advisors, Inc. | 5 | 0 | ||||||
| 2026-04-27 | 13F | Platform Technology Partners | 2.770 | 5,93 | 205 | -12,45 | ||||
| 2026-02-17 | 13F | Broad Bay Capital Management, LP | 385.428 | 1,58 | 34.411 | 7,54 | ||||
| 2026-02-13 | 13F | Rosenblum Silverman Sutton S F Inc /ca | 0 | -100,00 | 0 | |||||
| 2026-01-30 | 13F | Wealthfront Advisers Llc | 2.249 | -5,42 | 201 | 0,00 | ||||
| 2026-05-01 | 13F | Commonwealth Of Pennsylvania Public School Empls Retrmt Sys | 52.593 | 0,12 | 3.888 | -17,10 | ||||
| 2026-04-23 | 13F | Private Wealth Management Group, LLC | 44 | 0,00 | 3 | 0,00 | ||||
| 2026-02-11 | 13F | Harvest Fund Management Co., Ltd | 2.788 | 131,75 | 0 | |||||
| 2026-02-17 | 13F | Polymer Capital Management (US) LLC | 12.954 | 1.157 | ||||||
| 2026-01-27 | 13F | TD Waterhouse Canada Inc. | 1.793 | -65,22 | 160 | -62,94 | ||||
| 2026-02-10 | 13F | Goldman Sachs Group Inc | 1.258.002 | 1,30 | 112.314 | 7,24 | ||||
| 2026-04-21 | 13F | Nemes Rush Group LLC | 16 | 0,00 | 1 | 0,00 | ||||
| 2026-04-13 | 13F | Creative Financial Designs Inc /adv | 102 | 0,00 | 8 | -22,22 | ||||
| 2026-02-17 | 13F | Bank Of America Corp /de/ | 2.526.187 | -1,66 | 225.538 | 4,11 | ||||
| 2026-01-26 | 13F | KBC Group NV | 5.771 | 0,00 | 1 | |||||
| 2026-02-13 | 13F | Pathstone Holdings, LLC | 22.757 | -4,23 | 2.032 | 1,40 | ||||
| 2026-04-20 | 13F | Banque Cantonale Vaudoise | 1.630 | 59,18 | 120 | 31,87 | ||||
| 2026-02-11 | 13F | Fox Run Management, L.l.c. | 3.604 | 322 | ||||||
| 2026-02-13 | 13F | Toroso Investments, LLC | 0 | -100,00 | 0 | |||||
| 2026-02-10 | 13F | Mutual Of America Capital Management Llc | 87.359 | -9,88 | 7.799 | -4,59 | ||||
| 2026-02-05 | 13F | Bessemer Group Inc | 35.030 | 66,62 | 3 | 200,00 | ||||
| 2026-02-13 | 13F | Abrams Capital Management, L.p. | 5.804.136 | -0,70 | 518.193 | 5,13 | ||||
| 2026-02-14 | 13F | Dempze Nancy E | 5.500 | -8,33 | 491 | -2,77 | ||||
| 2026-04-15 | 13F | Financial Management Professionals, Inc. | 2 | 0,00 | 0 | |||||
| 2026-02-12 | 13F | Federated Hermes, Inc. | 16.881 | -16,35 | 1.507 | -11,41 | ||||
| 2026-02-06 | 13F | GPS Wealth Strategies Group, LLC | 0 | -100,00 | 0 | |||||
| 2026-02-03 | 13F | Mitsubishi UFJ Kokusai Asset Management Co., Ltd. | 312 | 0,00 | 28 | 3,85 | ||||
| 2026-02-17 | 13F | Mangrove Partners | 0 | -100,00 | 0 |