Grundlæggende statistik
| Institutionelle aktier (lange) | 41.644.109 - 52,92% (ex 13D/G) - change of -9,61MM shares -18,74% MRQ |
| Institutionel værdi (lang) | $ 3.461.269 USD ($1000) |
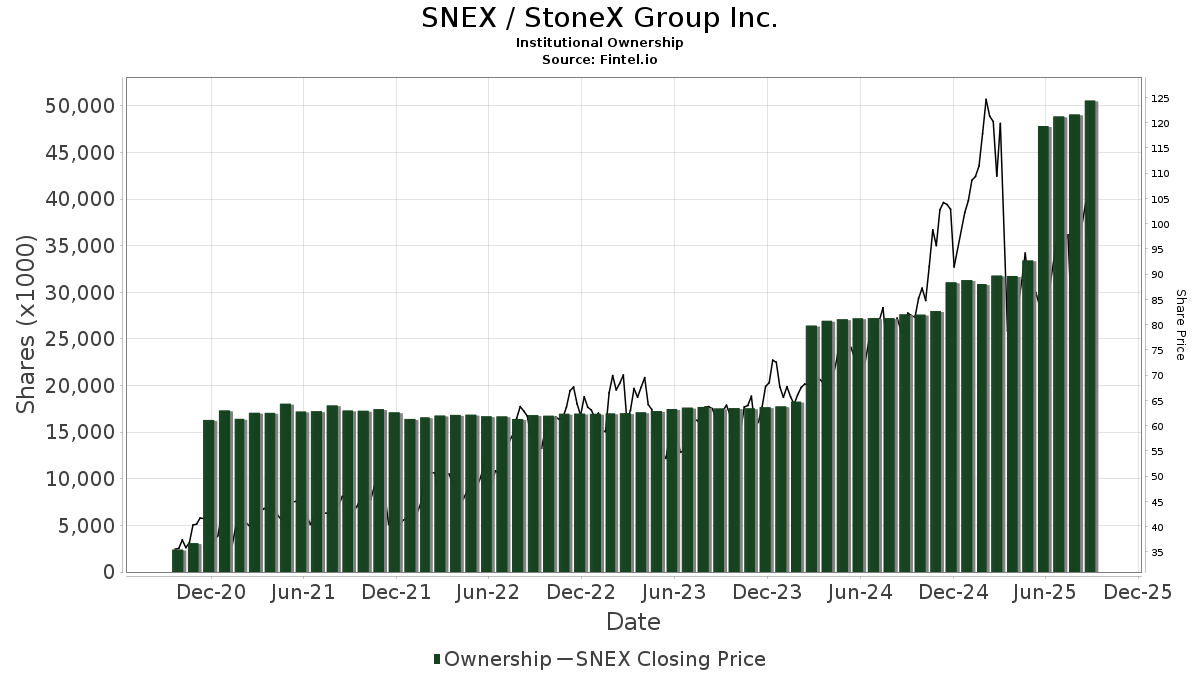
Institutionelt ejerskab og aktionærer
StoneX Group Inc. (US:SNEX) har 377 institutionelle ejere og aktionærer, der har indsendt 13D/G- eller 13F-formularer til Securities Exchange Commission (SEC). Disse institutioner har i alt 41,644,109 aktier. Største aktionærer omfatter BlackRock, Inc., Vanguard Group Inc, Price T Rowe Associates Inc /md/, American Century Companies Inc, State Street Corp, Dimensional Fund Advisors Lp, AltraVue Capital, LLC, Geode Capital Management, Llc, Van Berkom & Associates Inc., and Ameriprise Financial Inc .
StoneX Group Inc. (NasdaqGS:SNEX) institutionel ejerskabsstruktur viser aktuelle positioner i virksomheden efter institutioner og fonde, samt seneste ændringer i positionsstørrelse. Større aktionærer kan omfatte individuelle investorer, investeringsforeninger, hedgefonde eller institutioner. Skema 13D angiver, at investoren besidder (eller besidder) mere end 5 % af virksomheden og har til hensigt (eller har til hensigt at) aktivt at forfølge en ændring i forretningsstrategi. Skema 13G indikerer en passiv investering på over 5%.
The share price as of April 20, 2026 is 105,38 / share. Previously, on April 21, 2025, the share price was 39,17 / share. This represents an increase of 169,03% over that period.
Fondens stemningsscore
Fund Sentiment Score (fka Ownership Accumulation Score) finder de aktier, der bliver mest købt af fonde. Det er resultatet af en sofistikeret, multi-faktor kvantitativ model, der identificerer virksomheder med de højeste niveauer af institutionel akkumulering. Scoringsmodellen bruger en kombination af den samlede stigning i oplyste ejere, ændringerne i porteføljeallokeringer i disse ejere og andre målinger. Tallet går fra 0 til 100, hvor højere tal indikerer et højere niveau af akkumulering for sine jævnaldrende, og 50 er gennemsnittet.
Opdateringsfrekvens: Dagligt
Se Ownership Explorer, som giver en liste over højest rangerende virksomheder.
AI+ Ask Fintel’s AI assistant about StoneX Group Inc..
Select a question to share a public post with an AI-crafted answer.
Thinking of good questions…
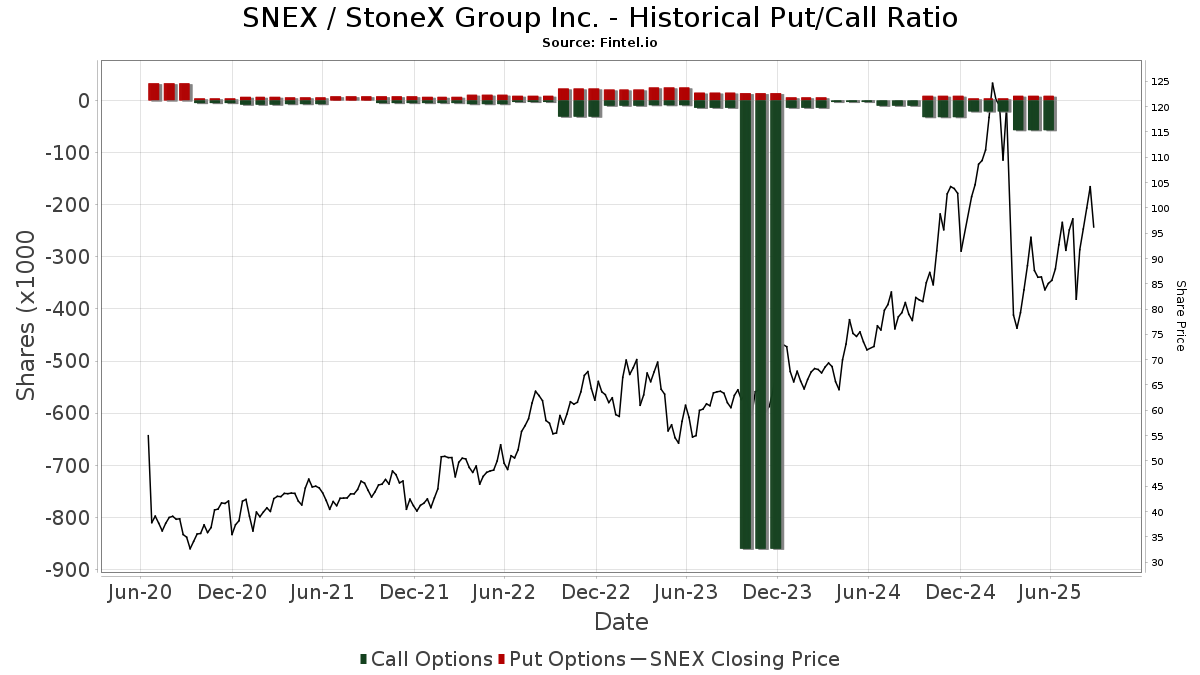
Institutionel Put/Call-forhold
Ud over at indberette standardaktie- og gældsudstedelser skal institutter med mere end 100 mill. aktiver under forvaltning også oplyse deres put- og call-optionsbeholdninger. Da salgsoptioner generelt indikerer negativ stemning, og købsoptioner indikerer positiv stemning, kan vi få en fornemmelse af den overordnede institutionelle stemning ved at plotte forholdet mellem put og kald. Diagrammet til højre viser det historiske put/call-forhold for dette instrument.
Brug af Put/Call Ratio som en indikator for investorernes stemning overvinder en af de vigtigste mangler ved at bruge totalt institutionelt ejerskab, som er, at en betydelig mængde af aktiver under forvaltning investeres passivt for at spore indekser. Passivt forvaltede fonde køber typisk ikke optioner, så indikatoren for put/call-forholdet følger mere nøje følelsen af aktivt forvaltede fonde.
13D/G-arkivering
Vi præsenterer 13D/G ansøgninger separat fra 13F ansøgninger på grund af den forskellige behandling af SEC. 13D/G-ansøgninger kan indgives af grupper af investorer (med én ledende), hvorimod 13F-ansøgninger ikke kan. Dette resulterer i situationer, hvor en investor kan indsende en 13D/G, der rapporterer én værdi for de samlede aktier (der repræsenterer alle de aktier, der ejes af investorgruppen), men derefter indsender en 13F, der rapporterer en anden værdi for de samlede aktier (der udelukkende repræsenterer deres egne) ejendomsret). Det betyder, at aktieejerskab af 13D/G-arkiver og 13F-arkiveringer ofte ikke er direkte sammenlignelige, så vi præsenterer dem separat.
Bemærk: Fra den 16. maj 2021 viser vi ikke længere ejere, der ikke har indsendt en 13D/G inden for det seneste år. Tidligere viste vi den fulde historie af 13D/G-arkiver. Generelt skal enheder, der er forpligtet til at indgive 13D/G-ansøgninger, indgive mindst årligt, før de indsender en afsluttende ansøgning. Dog forlader fonde nogle gange positioner uden at indsende en afsluttende ansøgning (dvs. de afvikler), så visning af den fulde historie resulterede nogle gange i forvirring om det nuværende ejerskab. For at undgå forvirring viser vi nu kun 'aktuelle' ejere - det vil sige - ejere, der har anmeldt inden for det seneste år.
Upgrade to unlock premium data.
| Fil dato | Form | Investor | Forrige Aktier |
Seneste Aktier |
Δ Aktier (Procent) |
Ejendomsret (Procent) |
Δ Ejerskab (Procent) |
|
|---|---|---|---|---|---|---|---|---|
| 2026-03-27 | VANGUARD GROUP INC | 4,020,305 | 0 | -100.00 | 0.00 | -100.00 | ||
| 2026-02-17 | PRICE T ROWE ASSOCIATES INC /MD/ | 2,851,483 | 5.50 | |||||
| 2025-10-17 | BlackRock, Inc. | 4,361,834 | 6,568,359 | 50.59 | 12.60 | -9.35 |
13F og NPORT arkivering
Detaljer om 13F-arkivering er gratis. Detaljer om NP-ansøgninger kræver et premium-medlemskab. Grønne rækker angiver nye positioner. Røde rækker angiver lukkede positioner. Klik på linket ikon for at se den fulde transaktionshistorik.
Opgrader
for at låse premium-data op og eksportere til Excel ![]() .
.
| Fil dato | Kilde | Investor | Type | Gennemsnitlig pris (Øst) |
Aktier | Δ Aktier (%) |
Rapporteret Værdi ($1000) |
Δ Værdi (%) |
Port Alloc (%) |
|
|---|---|---|---|---|---|---|---|---|---|---|
| 2025-11-14 | 13F | AXA Investment Managers S.A. | 13.870 | 1.400 | ||||||
| 2026-02-13 | 13F | Change Path, LLC | 0 | -100,00 | 0 | |||||
| 2026-02-12 | 13F | Brinker Capital Investments, LLC | 32.453 | 8,85 | 3.087 | 2,63 | ||||
| 2026-01-29 | 13F | Axecap Investments, LLC | 0 | -100,00 | 0 | |||||
| 2026-01-21 | 13F | Jefferson Bridge Capital, LLC | 63.940 | 6.083 | ||||||
| 2026-04-17 | 13F | Tectonic Advisors Llc | 3.689 | 47,86 | 298 | 25,32 | ||||
| 2026-02-05 | 13F | Allworth Financial LP | 1.265 | -2,24 | 120 | -7,69 | ||||
| 2026-02-13 | 13F | Victory Capital Management Inc | 12.391 | -74,21 | 1.179 | -75,70 | ||||
| 2026-02-17 | 13F | D. E. Shaw & Co., Inc. | 56.773 | 151,27 | 5.401 | 136,84 | ||||
| 2026-04-08 | 13F | Cadent Capital Advisors, LLC | 5.820 | 50,00 | 469 | 27,10 | ||||
| 2026-01-21 | 13F | Woodmont Investment Counsel Llc | 233.774 | 2,46 | 22.239 | -3,42 | ||||
| 2026-01-30 | 13F | CFC Planning Co LLC | 0 | -100,00 | 0 | |||||
| 2025-11-14 | 13F | Dark Forest Capital Management Lp | 6.148 | 0,00 | 560 | 0,00 | ||||
| 2026-02-12 | 13F | Stelac Advisory Services LLC | 2.560 | 0,00 | 244 | -5,81 | ||||
| 2026-02-09 | 13F | Legal & General Group Plc | 115.731 | -4,30 | 11.009 | -9,79 | ||||
| 2026-02-13 | 13F | Champlain Investment Partners, LLC | 0 | -100,00 | 0 | |||||
| 2026-02-23 | 13F | Wealth Preservation Advisors, LLC | 91 | 0,00 | 9 | -11,11 | ||||
| 2026-02-03 | 13F | RFG Advisory, LLC | 0 | -100,00 | 0 | |||||
| 2026-04-20 | 13F | Louisiana State Employees Retirement System | 31.050 | 45,77 | 2.504 | 23,59 | ||||
| 2026-02-12 | 13F | Quadrant Capital Group Llc | 5.904 | -0,30 | 562 | -6,03 | ||||
| 2026-01-29 | 13F | Concurrent Investment Advisors, LLC | 12.457 | 31,17 | 1.185 | 23,70 | ||||
| 2025-11-13 | 13F | Lord, Abbett & Co. Llc | 0 | -100,00 | 0 | -100,00 | ||||
| 2026-02-10 | 13F | Future Fund LLC | 17.770 | 42,62 | 1.690 | 34,45 | ||||
| 2026-02-17 | 13F | MIRAE ASSET GLOBAL ETFS HOLDINGS Ltd. | 22.786 | 6,72 | 2.168 | 0,60 | ||||
| 2026-01-28 | 13F | Peregrine Capital Management Llc | 49.525 | 4.711 | ||||||
| 2026-02-13 | 13F | Mml Investors Services, Llc | 9.913 | 49,83 | 943 | 41,38 | ||||
| 2025-11-14 | 13F | Voloridge Investment Management, Llc | 0 | -100,00 | 0 | -100,00 | ||||
| 2026-02-12 | 13F | Brown Brothers Harriman & Co | 18 | 2 | ||||||
| 2026-04-20 | 13F | State of Alaska, Department of Revenue | 37.763 | 46,53 | 3 | 50,00 | ||||
| 2025-11-14 | 13F | National Bank Of Canada /fi/ | 0 | -100,00 | 0 | |||||
| 2026-02-11 | 13F | O'shaughnessy Asset Management, Llc | 9.813 | -11,23 | 934 | -16,32 | ||||
| 2026-02-02 | 13F | Wolverine Asset Management Llc | Put | 13.500 | 1.284 | |||||
| 2026-02-13 | 13F | Caxton Associates Llp | 0 | -100,00 | 0 | |||||
| 2026-02-17 | 13F | Canada Pension Plan Investment Board | 20.900 | 1.988 | ||||||
| 2026-02-05 | 13F | HFM Investment Advisors, LLC | 3 | -25,00 | 0 | |||||
| 2026-04-06 | 13F | CX Institutional | 79.093 | 6 | ||||||
| 2026-04-10 | 13F | Abound Wealth Management | 4 | 33,33 | 0 | |||||
| 2026-01-27 | 13F | Forum Financial Management, LP | 2.489 | 0,00 | 237 | -5,98 | ||||
| 2026-02-17 | 13F | XTX Topco Ltd | 6.662 | 634 | ||||||
| 2026-02-06 | 13F | Bare Financial Services, Inc | 37 | 146,67 | 4 | 200,00 | ||||
| 2026-02-17 | 13F | Polar Capital Holdings Plc | 71.055 | 6.759 | ||||||
| 2026-01-30 | 13F | State of New Jersey Common Pension Fund D | 25.339 | 14,30 | 2.410 | 7,73 | ||||
| 2026-01-16 | 13F | Standard Life Aberdeen plc | 167.842 | -15,11 | 15.967 | -19,98 | ||||
| 2026-02-10 | 13F | Catalyst Capital Advisors LLC | 5.174 | 0,00 | 492 | -5,75 | ||||
| 2026-02-17 | 13F | Credit Agricole S A | 37.299 | 0,00 | 3.548 | -5,74 | ||||
| 2026-02-12 | 13F | Cibc World Markets Corp | 3.243 | -41,79 | 309 | -39,25 | ||||
| 2026-02-17 | 13F | Aquatic Capital Management LLC | 2.395 | 228 | ||||||
| 2026-04-06 | 13F | Versant Capital Management, Inc | 345 | 74,24 | 28 | 50,00 | ||||
| 2026-02-10 | 13F | Rothschild Investment Llc | 63 | -14,86 | 6 | -28,57 | ||||
| 2026-02-06 | 13F | Csenge Advisory Group | 18.282 | 5,90 | 1.739 | -0,17 | ||||
| 2026-02-10 | 13F | One Capital Management, LLC | 17.885 | 42,23 | 1.701 | 34,04 | ||||
| 2026-02-13 | 13F | First Trust Advisors Lp | 12.184 | -8,87 | 1.159 | -14,08 | ||||
| 2026-02-17 | 13F | Ancora Advisors, LLC | 15.308 | 0,00 | 1.456 | -5,70 | ||||
| 2025-11-13 | 13F | Jump Financial, LLC | 0 | -100,00 | 0 | |||||
| 2026-01-23 | 13F | Burney Co/ | 49.819 | 4.739 | ||||||
| 2026-04-15 | 13F | Merit Financial Group, LLC | 3.260 | 263 | ||||||
| 2026-02-11 | 13F | Franklin Resources Inc | 53.016 | -1,84 | 5.043 | -7,47 | ||||
| 2026-02-17 | 13F | Mpwm Advisory Solutions, Llc | 90 | 9 | ||||||
| 2025-11-12 | 13F | Hohimer Wealth Management, Llc | 0 | -100,00 | 0 | |||||
| 2026-04-14 | 13F | Drive Wealth Management, Llc | 2.618 | 211 | ||||||
| 2026-02-09 | 13F | 12th Street Asset Management Company, LLC | 124.321 | 0,33 | 11.827 | -5,43 | ||||
| 2026-02-13 | 13F | BNP Paribas Asset Management Holding S.A. | 605 | 42,69 | 0 | |||||
| 2026-02-17 | 13F | Kemnay Advisory Services Inc. | 115 | 11 | ||||||
| 2026-02-03 | 13F | Ethic Inc. | 3.400 | -27,10 | 323 | -31,28 | ||||
| 2025-11-14 | 13F | Algert Global Llc | 0 | -100,00 | 0 | |||||
| 2026-02-09 | 13F | Smithfield Trust Co | 189 | 0,00 | 0 | |||||
| 2026-04-07 | 13F | Park Avenue Securities Llc | 2.540 | 0 | ||||||
| 2026-02-13 | 13F | Public Employees Retirement Association Of Colorado | 155.729 | 0,00 | 15 | -6,67 | ||||
| 2026-02-02 | 13F | Wolverine Asset Management Llc | 2.519 | 240 | ||||||
| 2026-02-17 | 13F | Aqr Capital Management Llc | 32.001 | -1,00 | 3.044 | -6,68 | ||||
| 2026-02-05 | 13F | Cambridge Investment Research Advisors, Inc. | 3.796 | -90,18 | 0 | -100,00 | ||||
| 2026-01-29 | 13F | Vanguard Group Inc | 4.031.545 | 0,28 | 383.521 | -5,47 | ||||
| 2026-02-09 | 13F | Key FInancial Inc | 935 | 608,33 | 89 | 576,92 | ||||
| 2026-02-17 | 13F | Tower Research Capital LLC (TRC) | 3.354 | 85,00 | 319 | 75,27 | ||||
| 2025-11-14 | 13F | Tudor Investment Corp Et Al | 0 | -100,00 | 0 | |||||
| 2026-04-08 | 13F | NorthCrest Asset Manangement, LLC | 6.006 | 49,74 | 507 | 24,32 | ||||
| 2026-01-28 | 13F | Universal- Beteiligungs- und Servicegesellschaft mbH | 46.924 | 31,68 | 4.484 | 24,67 | ||||
| 2026-02-09 | 13F | Royce & Associates Lp | 100.367 | -9,96 | 9.548 | -15,13 | ||||
| 2026-02-02 | 13F | Strs Ohio | 13.900 | 0,00 | 1.322 | -5,71 | ||||
| 2026-01-26 | 13F/A | Phocas Financial Corp. | 136.202 | -0,25 | 12.957 | -5,97 | ||||
| 2026-02-12 | 13F | Commonwealth Equity Services, Llc | 3.687 | -94,94 | 351 | 4.900,00 | ||||
| 2026-02-11 | 13F | Vestcor Inc | 9.698 | 18,02 | 1 | |||||
| 2026-02-11 | 13F | Vise Technologies, Inc. | 2.674 | 20,18 | 254 | 13,39 | ||||
| 2026-02-06 | 13F | Vestmark Advisory Solutions, Inc. | 6.394 | 608 | ||||||
| 2026-03-03 | 13F/A | Caitong International Asset Management Co., Ltd | 196 | 19 | ||||||
| 2025-10-24 | 13F | Hemington Wealth Management | 85 | 2,41 | 0 | |||||
| 2026-01-15 | 13F | Nisa Investment Advisors, Llc | 512 | -16,34 | 49 | -21,31 | ||||
| 2026-02-02 | 13F | Cornerstone Planning Group LLC | 0 | -100,00 | 0 | |||||
| 2026-02-06 | 13F | Cullen/frost Bankers, Inc. | 306 | 15,91 | 29 | 11,54 | ||||
| 2026-02-02 | 13F | Danske Bank A/s | 200 | 0,00 | 19 | -5,00 | ||||
| 2026-02-09 | 13F | Atlantic Trust, LLC | 0 | -100,00 | 0 | |||||
| 2026-02-13 | 13F | Umb Bank N A/mo | 280 | 21,21 | 27 | 13,04 | ||||
| 2026-02-17 | 13F | Polymer Capital Management (US) LLC | 0 | -100,00 | 0 | |||||
| 2026-02-17 | 13F | Citadel Advisors Llc | Put | 5.200 | 55,22 | 495 | 46,15 | |||
| 2026-02-17 | 13F | Amundi | 6.319 | -22,38 | 601 | -25,34 | ||||
| 2026-01-14 | 13F | Chatham Capital Group, Inc. | 57.142 | 0,81 | 5.436 | -4,98 | ||||
| 2026-02-17 | 13F | Citadel Advisors Llc | Call | 14.900 | -75,79 | 1.417 | -77,19 | |||
| 2026-02-17 | 13F | Citadel Advisors Llc | 8.889 | 97,36 | 846 | 86,12 | ||||
| 2026-01-29 | 13F | Cornerstone Investment Partners, LLC | 9.831 | 0,54 | 935 | -5,17 | ||||
| 2026-01-29 | 13F | D.a. Davidson & Co. | 5.343 | 0,00 | 508 | -5,75 | ||||
| 2026-02-11 | 13F | AltraVue Capital, LLC | 1.311.632 | -0,16 | 124.776 | -5,89 | ||||
| 2026-02-17 | 13F | Mercer Global Advisors Inc /adv | 8.074 | -7,95 | 768 | -13,22 | ||||
| 2026-02-10 | 13F | Quantbot Technologies LP | 6.150 | -4,92 | 585 | -10,28 | ||||
| 2026-02-02 | 13F | Principal Financial Group Inc | 291.861 | 8,31 | 27.765 | 2,09 | ||||
| 2026-02-13 | 13F | Boston Partners | 592.635 | 41,76 | 57.147 | 35,40 | ||||
| 2026-04-13 | 13F | IFP Advisors, Inc | 2.652 | 37,48 | 214 | 16,39 | ||||
| 2026-01-22 | 13F | Vicus Capital | 0 | -100,00 | 0 | |||||
| 2026-01-28 | 13F | Teacher Retirement System Of Texas | 0 | -100,00 | 0 | |||||
| 2026-04-15 | 13F | Atwood & Palmer Inc | 150 | 50,00 | 12 | 33,33 | ||||
| 2026-02-09 | 13F | Geode Capital Management, Llc | 1.212.568 | 6,55 | 115.369 | 0,44 | ||||
| 2025-11-04 | 13F | Convergence Investment Partners, LLC | 0 | -100,00 | 0 | |||||
| 2026-02-03 | 13F | SBI Securities Co., Ltd. | 100 | 0,00 | 10 | -10,00 | ||||
| 2026-02-17 | 13F | Guggenheim Capital Llc | 12.635 | 1.202 | ||||||
| 2026-04-08 | 13F | DiNuzzo Private Wealth, Inc. | 7 | 0,00 | 1 | |||||
| 2026-02-10 | 13F | Intech Investment Management Llc | 23.529 | -32,66 | 2.238 | -36,53 | ||||
| 2026-02-12 | 13F | Integrated Quantitative Investments LLC | 0 | -100,00 | 0 | |||||
| 2025-11-07 | 13F | Shell Asset Management Co | 1.295 | -99,16 | 0 | -100,00 | ||||
| 2025-11-13 | 13F | Renaissance Technologies Llc | 0 | -100,00 | 0 | |||||
| 2025-11-13 | 13F | Connor, Clark & Lunn Investment Management Ltd. | 0 | -100,00 | 0 | |||||
| 2026-02-23 | 13F | Blue Capital, Inc. | 0 | -100,00 | 0 | |||||
| 2026-01-08 | 13F | Maridea Wealth Management LLC | 4.730 | 4,51 | 450 | -1,54 | ||||
| 2026-02-12 | 13F | Steward Partners Investment Advisory, Llc | 0 | -100,00 | 0 | |||||
| 2026-02-13 | 13F | Anb Bank | 2.901 | 0,87 | 276 | -5,17 | ||||
| 2026-04-16 | 13F | Diversified Trust Co | 14.140 | 79,10 | 1.140 | 51,80 | ||||
| 2026-02-17 | 13F | Voleon Capital Management Lp | 5.390 | 513 | ||||||
| 2026-02-17 | 13F | Price T Rowe Associates Inc /md/ | 2.851.468 | 18,23 | 271 | 11,52 | ||||
| 2025-11-14 | 13F | Axa S.a. | 0 | -100,00 | 0 | |||||
| 2026-02-11 | 13F | Motley Fool Asset Management LLC | 259.961 | -5,59 | 24.730 | -11,00 | ||||
| 2026-01-26 | 13F | Roman Butler Fullerton & Co | 0 | -100,00 | 0 | |||||
| 2026-02-06 | 13F | Legato Capital Management LLC | 122.633 | 0,00 | 11.666 | -5,74 | ||||
| 2026-01-14 | 13F | Jfs Wealth Advisors, Llc | 44 | 22,22 | 4 | 33,33 | ||||
| 2025-11-12 | 13F | Neuberger Berman Group LLC | 0 | -100,00 | 0 | |||||
| 2026-04-16 | 13F | Trium Capital LLP | 10 | 1 | ||||||
| 2026-02-02 | 13F | Equitable Trust Co | 4.291 | 0,00 | 408 | -5,77 | ||||
| 2026-01-29 | 13F | Comerica Bank | 10.971 | -21,24 | 1.044 | -25,77 | ||||
| 2026-02-10 | 13F | Td Asset Management Inc | 161.394 | 13,86 | 15.353 | 7,33 | ||||
| 2026-02-17 | 13F | Royal Bank Of Canada | 37.949 | -33,45 | 3.610 | -37,27 | ||||
| 2026-04-20 | 13F | Yorktown Management & Research Co Inc | 15.750 | 50,00 | 1.270 | 27,25 | ||||
| 2026-04-15 | 13F | Exchange Traded Concepts, Llc | 73.435 | 212,49 | 5.923 | 164,97 | ||||
| 2026-01-16 | 13F | BridgePort Financial Solutions, LLC | 0 | -100,00 | 0 | |||||
| 2026-02-09 | 13F | Harbour Investments, Inc. | 2.015 | 1.136,20 | 192 | 1.093,75 | ||||
| 2026-02-11 | 13F | Deutsche Bank Ag\ | 127.419 | 12,57 | 12.121 | 6,11 | ||||
| 2025-11-13 | 13F | Cove Street Capital, LLC | 26.084 | 1,26 | 2.632 | 12,14 | ||||
| 2026-02-11 | 13F | Rise Advisors, LLC | 0 | -100,00 | 0 | |||||
| 2026-02-11 | 13F | Greykasell Wealth Strategies, Inc. | 100 | 0,00 | 10 | -10,00 | ||||
| 2025-11-14 | 13F | Nbc Securities, Inc. | 0 | -100,00 | 0 | -100,00 | ||||
| 2026-04-09 | 13F | Diversified Management Inc | 2.922 | 236 | ||||||
| 2025-11-17 | 13F | PDT Partners, LLC | 0 | -100,00 | 0 | |||||
| 2026-02-10 | 13F | Envestnet Asset Management Inc | 125.594 | -2,53 | 11.948 | -8,13 | ||||
| 2025-11-12 | 13F | TCG Advisory Services, LLC | 0 | -100,00 | 0 | |||||
| 2026-04-07 | 13F | Signaturefd, Llc | 202 | 62,90 | 16 | 45,45 | ||||
| 2026-02-12 | 13F | Wealthspire Advisors, LLC | 0 | -100,00 | 0 | |||||
| 2026-02-12 | 13F | CIBC Private Wealth Group, LLC | 1.280 | 0,87 | 122 | -5,47 | ||||
| 2026-02-17 | 13F | Advisory Services Network, LLC | 3.509 | -39,26 | 334 | -42,88 | ||||
| 2026-02-05 | 13F | Amalgamated Bank | 13.570 | 2,08 | 1 | 0,00 | ||||
| 2026-02-13 | 13F | Golden State Wealth Management, LLC | 36 | 0,00 | 3 | 0,00 | ||||
| 2026-02-12 | 13F | Loomis Sayles & Co L P | 127.168 | -12,97 | 12.097 | -17,96 | ||||
| 2026-02-17 | 13F | Qube Research & Technologies Ltd | 0 | -100,00 | 0 | |||||
| 2026-02-13 | 13F | Candriam Luxembourg S.C.A. | 28.398 | 2.702 | ||||||
| 2026-01-26 | 13F | Cwm, Llc | 851 | -7,60 | 0 | |||||
| 2026-02-13 | 13F | Ashford Capital Management Inc | 298.329 | -4,76 | 28.380 | -10,22 | ||||
| 2026-04-14 | 13F | BayBridge Capital Group, LLC | 3.958 | 0,00 | 377 | 0,00 | ||||
| 2026-02-12 | 13F | Bank Of Montreal /can/ | 4.831 | -1,27 | 460 | -6,90 | ||||
| 2025-11-13 | 13F | Magnetar Financial LLC | 0 | -100,00 | 0 | |||||
| 2026-02-17 | 13F | Equitable Holdings, Inc. | 2.966 | -20,14 | 282 | -24,60 | ||||
| 2026-02-17 | 13F | Ibex Wealth Advisors | 61.407 | 18,84 | 5.842 | 12,03 | ||||
| 2025-11-14 | 13F | Goldentree Asset Management Lp | 57.191 | -83,99 | 5.772 | -82,23 | ||||
| 2026-02-13 | 13F | JustInvest LLC | 0 | -100,00 | 0 | |||||
| 2026-02-13 | 13F | Transamerica Financial Advisors, Inc. | 433 | 41 | ||||||
| 2026-02-13 | 13F | Colony Group, LLC | 12.917 | 9,33 | 1.229 | 3,02 | ||||
| 2026-02-10 | 13F | Commonwealth Of Pennsylvania Public School Empls Retrmt Sys | 11.495 | -2,77 | 1.094 | -8,38 | ||||
| 2026-02-17 | 13F | Armistice Capital, Llc | 7.189 | 684 | ||||||
| 2026-02-02 | 13F | Van Berkom & Associates Inc. | 1.143.509 | -4,73 | 109 | -10,74 | ||||
| 2026-02-11 | 13F | Janney Montgomery Scott LLC | 26.408 | -5,55 | 3 | 0,00 | ||||
| 2025-11-14 | 13F | Two Sigma Investments, Lp | 0 | -100,00 | 0 | |||||
| 2026-02-13 | 13F | Smartleaf Asset Management LLC | 760 | 1,74 | 74 | -1,33 | ||||
| 2025-11-14 | 13F | Wolverine Trading, Llc | 5.005 | 504 | ||||||
| 2025-10-27 | 13F | Smith Shellnut Wilson Llc /adv | 4.146 | 1,47 | 418 | 12,37 | ||||
| 2025-11-14 | 13F | Wolverine Trading, Llc | Call | 3.600 | -37,93 | 363 | -31,70 | |||
| 2026-02-04 | 13F | Oregon Public Employees Retirement Fund | 10.650 | 1,85 | 1.013 | -3,98 | ||||
| 2026-01-16 | 13F | Trust Co Of Vermont | 14.736 | 0,00 | 1.402 | -5,78 | ||||
| 2026-02-17 | 13F | SageView Advisory Group, LLC | 15 | 1 | ||||||
| 2026-01-21 | 13F | SJS Investment Consulting Inc. | 6 | 0,00 | 1 | |||||
| 2026-02-13 | 13F | State Street Corp | 1.829.897 | 0,34 | 174.078 | -5,42 | ||||
| 2025-11-14 | 13F | Eqis Capital Management, Inc. | 0 | -100,00 | 0 | |||||
| 2026-02-09 | 13F | Thrive Capital Management, LLC | 6.078 | 0,00 | 578 | -5,71 | ||||
| 2026-02-13 | 13F | Peak6 Llc | Call | 0 | -100,00 | 0 | ||||
| 2025-10-30 | 13F | Ridgewood Investments LLC | 0 | -100,00 | 0 | |||||
| 2026-02-09 | 13F | Hartland & Co., LLC | 1.121 | 202,97 | 107 | 186,49 | ||||
| 2026-01-28 | 13F | Geneos Wealth Management Inc. | 103 | 0,00 | 10 | -10,00 | ||||
| 2026-04-09 | 13F | Moody National Bank Trust Division | 2.752 | 222 | ||||||
| 2026-02-18 | 13F | EP Wealth Advisors, Inc. | 0 | -100,00 | 0 | |||||
| 2026-02-09 | 13F | New Age Alpha Advisors, LLC | 2.216 | -94,32 | 211 | -94,67 | ||||
| 2026-02-10 | 13F | CIBC Asset Management Inc | 0 | -100,00 | 0 | |||||
| 2026-02-10 | 13F | Exit Wealth Advisors, LLC. | 0 | -100,00 | 0 | |||||
| 2026-04-07 | 13F | CoreCap Advisors, LLC | 11 | 1 | ||||||
| 2026-04-08 | 13F | Wealth Enhancement Advisory Services, Llc | 9.877 | 13,13 | 327 | -63,62 | ||||
| 2026-01-26 | 13F | Decker Retirement Planning Inc. | 10 | 0,00 | 1 | -100,00 | ||||
| 2025-11-14 | 13F | Nomura Holdings Inc | 0 | -100,00 | 0 | -100,00 | ||||
| 2026-02-17 | 13F | Two Sigma Securities, Llc | 4.938 | 470 | ||||||
| 2026-02-04 | 13F | Aubrey Capital Management Ltd | 43.100 | 0,00 | 4.099 | -5,77 | ||||
| 2026-02-13 | 13F | Healthcare Of Ontario Pension Plan Trust Fund | 83.164 | 7.911 | ||||||
| 2026-02-13 | 13F | American Century Companies Inc | 2.040.126 | -5,41 | 194.077 | -10,84 | ||||
| 2026-01-21 | 13F | Yousif Capital Management, Llc | 12.707 | -12,01 | 1.349 | -7,48 | ||||
| 2026-02-17 | 13F | Capstone Investment Advisors, Llc | 0 | -100,00 | 0 | -100,00 | ||||
| 2025-11-13 | 13F/A | Cynosure Management, Llc | 8.411 | -0,05 | 849 | 10,70 | ||||
| 2026-02-06 | 13F | Tortoise Investment Management, LLC | 0 | -100,00 | 0 | |||||
| 2026-02-12 | 13F | Dimensional Fund Advisors Lp | 1.403.302 | -0,97 | 133.507 | -6,64 | ||||
| 2026-02-13 | 13F | Squarepoint Ops LLC | 52.500 | 0,00 | 4.994 | -5,74 | ||||
| 2026-02-13 | 13F | Marshall Wace, Llp | 72.115 | 6.860 | ||||||
| 2026-02-17 | 13F | Advisor Group Holdings, Inc. | 23.692 | -46,37 | 2.254 | -49,86 | ||||
| 2026-04-14 | 13F | Perpetual Ltd | 329.912 | 21,79 | 26.607 | 3,25 | ||||
| 2026-02-17 | 13F | Quantinno Capital Management LP | 6.615 | 65,09 | 629 | 55,69 | ||||
| 2026-02-17 | 13F | Jones Financial Companies Lllp | 1.518 | -38,59 | 144 | -41,22 | ||||
| 2026-02-13 | 13F | Parkside Financial Bank & Trust | 1.432 | 18,54 | 136 | 12,40 | ||||
| 2026-01-23 | 13F | Beacon Harbor Wealth Advisors, Inc. | 0 | -100,00 | 0 | |||||
| 2026-02-17 | 13F | Alliancebernstein L.p. | 56.642 | 7,83 | 5.388 | 1,64 | ||||
| 2026-01-15 | 13F | Three Seasons Wealth, LLC | 0 | -100,00 | 0 | |||||
| 2026-02-17 | 13F | Man Group plc | 109.035 | 34,67 | 10.372 | 26,95 | ||||
| 2026-02-17 | 13F | Public Employees Retirement System Of Ohio | 1.119 | 22,30 | 106 | 15,22 | ||||
| 2026-02-17 | 13F | Northern Trust Corp | 566.644 | 8,29 | 53.905 | 2,08 | ||||
| 2026-02-24 | 13F | MidFirst Bank | 28.125 | 2.676 | ||||||
| 2026-01-12 | 13F | Rialto Wealth Management, LLC | 12 | 20,00 | 1 | 0,00 | ||||
| 2026-01-29 | 13F | Pictet Asset Management Holding SA | 7.110 | 15,85 | 676 | 9,21 | ||||
| 2026-02-12 | 13F | Jane Street Group, Llc | Call | 59.000 | 2,97 | 5.613 | -2,94 | |||
| 2026-04-16 | 13F | SG Americas Securities, LLC | 26.684 | -54,78 | 2 | -60,00 | ||||
| 2026-02-19 | 13F | Atomi Financial Group, Inc. | 7.505 | -14,83 | 714 | -19,80 | ||||
| 2026-02-17 | 13F | Susquehanna International Group, Llp | Call | 4.900 | -89,48 | 466 | -90,09 | |||
| 2026-02-17 | 13F | Susquehanna International Group, Llp | 8.071 | -47,41 | 768 | -50,45 | ||||
| 2026-01-22 | 13F | Red Tortoise LLC | 163 | 0,00 | 16 | -6,25 | ||||
| 2026-02-19 | 13F | CI Private Wealth, LLC | 2.993 | 5,76 | 285 | 0,00 | ||||
| 2025-10-30 | 13F | Twin Peaks Wealth Advisors, LLC | 0 | -100,00 | 0 | |||||
| 2026-02-12 | 13F | Xponance, Inc. | 3.872 | 6,84 | 368 | 0,82 | ||||
| 2026-02-13 | 13F | Toroso Investments, LLC | 269.198 | -4,31 | 25.609 | -9,80 | ||||
| 2026-04-17 | 13F | Bell Investment Advisors, Inc | 87 | 47,46 | 7 | 40,00 | ||||
| 2025-11-21 | 13F/A | CIBC Bancorp USA Inc. | 4.899 | 494 | ||||||
| 2026-02-12 | 13F | Nuveen, LLC | 269.803 | 1,42 | 25.666 | -4,40 | ||||
| 2026-01-26 | 13F | Private Trust Co Na | 232 | -4,53 | 22 | -8,33 | ||||
| 2026-02-05 | 13F | Northwestern Mutual Wealth Management Co | 26.772 | 18.363,45 | 2.273 | 16.135,71 | ||||
| 2026-02-03 | 13F | Tweedy, Browne Co LLC | 22.676 | 16,67 | 2.157 | 9,99 | ||||
| 2026-02-13 | 13F | Ubs Asset Management Americas Inc | 77.367 | 1,30 | 7.360 | -4,52 | ||||
| 2026-03-06 | 13F | Hsbc Holdings Plc | 10.783 | 1.032 | ||||||
| 2026-04-15 | 13F | Bayforest Capital Ltd | 970 | 78 | ||||||
| 2026-02-13 | 13F | Manufacturers Life Insurance Company, The | 0 | -100,00 | 0 | |||||
| 2026-01-29 | 13F | UMA Financial Services, Inc. | 29 | 0,00 | 3 | 0,00 | ||||
| 2026-02-09 | 13F | Hantz Financial Services, Inc. | 95 | 82,69 | 0 | |||||
| 2026-04-20 | 13F | Ronald Blue Trust, Inc. | 48 | 50,00 | 4 | 0,00 | ||||
| 2026-01-30 | 13F | Us Bancorp \de\ | 1.532 | -1,42 | 146 | -7,05 | ||||
| 2026-02-17 | 13F | Creative Planning | 24.426 | -13,48 | 2.324 | -18,46 | ||||
| 2026-02-13 | 13F | Kilter Group LLC | 24 | 2 | ||||||
| 2025-11-14 | 13F | Skopos Labs, Inc. | 0 | -100,00 | 0 | |||||
| 2026-02-17 | 13F | Wiley Bros.-aintree Capital, Llc | 5.053 | 6,16 | 481 | 0,00 | ||||
| 2026-02-13 | 13F | C M Bidwell & Associates Ltd | 62 | 0,00 | 6 | -16,67 | ||||
| 2026-01-27 | 13F | Zurcher Kantonalbank (Zurich Cantonalbank) | 17.912 | -16,39 | 1.704 | -21,19 | ||||
| 2026-02-03 | 13F | Crossmark Global Holdings, Inc. | 3.356 | -12,40 | 319 | -17,36 | ||||
| 2026-02-12 | 13F | Swiss National Bank | 87.475 | 2,46 | 8.321 | -3,42 | ||||
| 2026-02-11 | 13F | SOUTH STATE Corp | 9 | 0,00 | 1 | |||||
| 2026-01-30 | 13F | Jennison Associates Llc | 6.972 | -0,41 | 663 | -6,09 | ||||
| 2026-04-15 | 13F | Fortitude Family Office, LLC | 35 | 250,00 | 3 | |||||
| 2026-02-13 | 13F | Oxford Financial Group Ltd | 3.384 | -19,79 | 322 | -24,47 | ||||
| 2026-02-17 | 13F | Cetera Investment Advisers | 17.562 | -31,39 | 1.671 | -35,35 | ||||
| 2026-02-09 | 13F | MRP Capital Investments, LLC | 19.881 | -18,91 | 1.891 | -15,35 | ||||
| 2026-04-13 | 13F | Massmutual Trust Co Fsb/adv | 59 | 47,50 | 5 | 33,33 | ||||
| 2026-01-26 | 13F | KBC Group NV | 1.249 | 0,00 | 0 | |||||
| 2026-02-10 | 13F | Godfrey Financial Associates, Inc. | 21 | 2 | ||||||
| 2026-04-13 | 13F | Hm Payson & Co | 2.700 | 50,00 | 218 | 26,90 | ||||
| 2026-01-21 | 13F | Sound Income Strategies, LLC | 168 | 18 | ||||||
| 2026-02-05 | 13F | Plante Moran Financial Advisors, LLC | 260 | 25 | ||||||
| 2026-01-13 | 13F | Matrix Trust Co | 0 | -100,00 | 0 | |||||
| 2026-02-17 | 13F | Infrastructure Capital Advisors, Llc | 6.215 | -9,73 | 591 | -6,49 | ||||
| 2025-11-14 | 13F | Walleye Capital LLC | 0 | -100,00 | 0 | |||||
| 2026-01-30 | 13F | Simplicity Wealth,LLC | 8.174 | -2,99 | 778 | -8,59 | ||||
| 2026-02-19 | 13F | Van Diest Capital, LLC | 2.291 | 218 | ||||||
| 2026-02-13 | 13F | Public Sector Pension Investment Board | 0 | -100,00 | 0 | |||||
| 2026-02-10 | 13F | Argent Trust Co | 3.372 | 0,00 | 321 | -5,88 | ||||
| 2026-02-05 | 13F | Leuthold Group, Llc | 30.487 | 834,04 | 2.900 | 781,46 | ||||
| 2026-04-16 | 13F | Sheets Smith Wealth Management | 13.627 | 49,96 | 1.099 | 27,08 | ||||
| 2026-02-11 | 13F | Picton Mahoney Asset Management | 21 | 0,00 | 2 | |||||
| 2026-02-03 | 13F | Farmers & Merchants Investments Inc | 27 | 0,00 | 3 | 0,00 | ||||
| 2026-02-04 | 13F | Swiss Life Asset Management Ltd | 4.138 | 98,85 | 394 | 87,14 | ||||
| 2026-02-10 | 13F | Nomura Asset Management Co Ltd | 590 | 0,00 | 56 | -5,08 | ||||
| 2026-02-11 | 13F | Empowered Funds, LLC | 85.427 | 270,26 | 8.127 | 249,05 | ||||
| 2026-04-13 | 13F | Trust Co | 9 | 50,00 | 1 | |||||
| 2026-01-23 | 13F | Private Wealth Management Group, LLC | 132 | 0,00 | 13 | -7,69 | ||||
| 2026-02-13 | 13F | Prudential Financial Inc | 53.836 | -5,65 | 5.121 | -11,06 | ||||
| 2026-02-13 | 13F | Wells Fargo & Company/mn | 98.788 | 58,09 | 9.398 | 49,02 | ||||
| 2026-02-03 | 13F | SummerHaven Investment Management, LLC | 8.813 | 0,00 | 838 | -5,74 | ||||
| 2025-11-13 | 13F | EntryPoint Capital, LLC | 0 | -100,00 | 0 | |||||
| 2026-02-10 | 13F | Belvedere Trading LLC | Put | 0 | -100,00 | 0 | ||||
| 2026-02-17 | 13F | Nine Ten Capital Management LLC | 397.486 | -4,79 | 37.813 | -10,25 | ||||
| 2026-02-02 | 13F | Fifth Third Bancorp | 274 | 1,86 | 26 | -3,70 | ||||
| 2026-02-11 | 13F | Simplex Trading, Llc | Put | 100 | 10 | |||||
| 2026-02-11 | 13F | Gilpin Wealth Management, Llc | 4 | 0 | ||||||
| 2026-02-11 | 13F | Illinois Municipal Retirement Fund | 23.514 | -2,83 | 2.237 | -8,44 | ||||
| 2026-02-11 | 13F | Simplex Trading, Llc | 1.637 | 442,05 | 156 | |||||
| 2026-02-11 | 13F | Simplex Trading, Llc | Call | 200 | 0,00 | 19 | ||||
| 2026-02-02 | 13F | Highland Capital Management, Llc | 0 | -100,00 | 0 | |||||
| 2026-02-10 | 13F | Mutual Of America Capital Management Llc | 5.308 | 2,04 | 505 | -3,82 | ||||
| 2026-02-03 | 13F | International Assets Investment Management, Llc | 525 | 50 | ||||||
| 2026-02-06 | 13F | EverSource Wealth Advisors, LLC | 534 | 167,00 | 51 | 150,00 | ||||
| 2025-11-06 | 13F | Ameritas Advisory Services, LLC | 0 | -100,00 | 0 | |||||
| 2026-02-11 | 13F | Hughes Financial Services, LLC | 1 | 0 | ||||||
| 2026-02-14 | 13F | Rockefeller Capital Management L.P. | 610.634 | -23,92 | 58.090 | -28,28 | ||||
| 2026-01-30 | 13F | Sage Rhino Capital Llc | 0 | -100,00 | 0 | |||||
| 2026-02-06 | 13F | ProShare Advisors LLC | 9.499 | 9,61 | 904 | 3,32 | ||||
| 2026-01-20 | 13F | Harbor Capital Advisors, Inc. | 85.740 | -8,67 | 8 | -11,11 | ||||
| 2025-11-14 | 13F | Texas Permanent School Fund | 0 | -100,00 | 0 | |||||
| 2026-02-09 | 13F | Millington Financial Advisors, LLC | 30.583 | 3,43 | 3.686 | 28,03 | ||||
| 2026-02-13 | 13F | SRS Capital Advisors, Inc. | 50 | 5 | ||||||
| 2026-01-29 | 13F | Teachers Retirement System Of The State Of Kentucky | 11.349 | -3,70 | 1 | 0,00 | ||||
| 2026-02-12 | 13F | Federation des caisses Desjardins du Quebec | 300 | 0,00 | 29 | -6,67 | ||||
| 2026-02-10 | 13F | Swmg, Llc | 2.421 | -4,23 | 292 | 15,48 | ||||
| 2026-01-29 | 13F | Sanctuary Advisors, LLC | 0 | -100,00 | 0 | -100,00 | ||||
| 2026-02-12 | 13F | JT Stratford LLC | 0 | -100,00 | 0 | |||||
| 2026-02-03 | 13F | Navellier & Associates Inc | 8.198 | -23,30 | 780 | -27,74 | ||||
| 2026-02-05 | 13F | Hiddenite Capital Partners LP | 88.926 | 0,00 | 8.460 | -5,74 | ||||
| 2026-02-04 | 13F | Virginia Retirement Systems Et Al | 12.898 | 0,00 | 1.227 | -5,76 | ||||
| 2026-02-11 | 13F | Motley Fool Wealth Management, LLC | 158.516 | -13,64 | 15.080 | -18,59 | ||||
| 2026-01-23 | 13F | Rsm Us Wealth Management Llc | 2.764 | 4,46 | 270 | 0,75 | ||||
| 2026-02-10 | 13F | Bruce G. Allen Investments, LLC | 15 | 25,00 | 1 | 0,00 | ||||
| 2026-02-10 | 13F | Natixis Advisors, L.p. | 24.064 | -20,27 | 2 | -33,33 | ||||
| 2026-02-13 | 13F | Baird Financial Group, Inc. | 3.768 | 0,00 | 358 | -5,79 | ||||
| 2026-02-05 | 13F | Atria Investments Llc | 20.499 | 4,85 | 1.950 | -1,12 | ||||
| 2026-02-06 | 13F | Pnc Financial Services Group, Inc. | 11.535 | 0,37 | 1.097 | -5,35 | ||||
| 2026-02-05 | 13F | Tucker Asset Management Llc | 303 | -89,23 | 29 | -90,11 | ||||
| 2026-02-17 | 13F | Summit Global Investments | 2.613 | 0 | ||||||
| 2026-02-17 | 13F | Hilltop Holdings Inc. | 0 | -100,00 | 0 | |||||
| 2026-02-13 | 13F | Panagora Asset Management Inc | 0 | -100,00 | 0 | |||||
| 2026-02-17 | 13F | Russell Investments Group, Ltd. | 50.706 | -9,53 | 4.824 | -14,73 | ||||
| 2026-02-06 | 13F | HighTower Advisors, LLC | 4.555 | -61,98 | 433 | -64,16 | ||||
| 2026-02-10 | 13F | Root Financial Partners, LLC | 160 | 8,11 | 15 | 7,14 | ||||
| 2026-02-13 | 13F | Charles Schwab Investment Management Inc | 536.666 | 5,32 | 51.053 | -0,72 | ||||
| 2026-01-15 | 13F | Allspring Global Investments Holdings, LLC | 191.030 | 21,65 | 18.603 | 17,10 | ||||
| 2026-01-22 | 13F | Financial Consulate, Inc | 5 | 0,00 | 0 | |||||
| 2026-02-17 | 13F | Optiver Holding B.V. | 122 | -42,45 | 12 | -47,62 | ||||
| 2026-04-10 | 13F/A | OP Asset Management Ltd | 87.129 | 55,02 | 7.027 | 23,87 | ||||
| 2026-02-13 | 13F | Barclays Plc | 78.178 | 15,84 | 7.437 | 9,21 | ||||
| 2026-02-10 | 13F | Lido Advisors, LLC | 4.050 | 3,18 | 403 | 1,52 | ||||
| 2026-02-17 | 13F | Private Capital Management, LLC | 167.186 | -0,71 | 15.904 | -6,40 | ||||
| 2026-02-13 | 13F | LRT Capital Management, LLC | 0 | -100,00 | 0 | |||||
| 2026-02-13 | 13F | Jacobs Levy Equity Management, Inc | 2.333 | -83,24 | 222 | -84,27 | ||||
| 2026-02-03 | 13F | Koshinski Asset Management, Inc. | 0 | -100,00 | 0 | |||||
| 2025-11-14 | 13F | Engineers Gate Manager LP | 0 | -100,00 | 0 | |||||
| 2026-04-20 | 13F | BTC Capital Management, Inc. | 11.190 | 29,26 | 902 | 9,47 | ||||
| 2026-02-09 | 13F | Keating Financial Advisory Services, Inc. | 2.215 | 211 | ||||||
| 2026-02-10 | 13F | Yukon Wealth Management, Inc. | 0 | -100,00 | 0 | |||||
| 2026-01-29 | 13F | Kickstand Ventures, Llc. | 0 | -100,00 | 0 | |||||
| 2026-02-17 | 13F | Millennium Management Llc | 41.938 | 3.990 | ||||||
| 2026-02-17 | 13F | Fmr Llc | 184.796 | 36,50 | 17.580 | 28,66 | ||||
| 2026-02-17 | 13F | Raymond James Financial Inc | 156.113 | -22,80 | 15.227 | -25,39 | ||||
| 2026-02-12 | 13F | Hollencrest Capital Management | 153 | 0,00 | 15 | -6,67 | ||||
| 2026-02-09 | 13F | Quest Partners LLC | 1.101 | 291,81 | 105 | 271,43 | ||||
| 2025-11-14 | 13F | Jane Street Group, Llc | 0 | -100,00 | 0 | -100,00 | ||||
| 2026-01-23 | 13F | Halbert Hargrove Global Advisors, Llc | 0 | -100,00 | 0 | |||||
| 2025-11-03 | 13F | TD Waterhouse Canada Inc. | 0 | -100,00 | 0 | |||||
| 2025-11-04 | 13F | Penserra Capital Management LLC | 0 | -100,00 | 0 | |||||
| 2025-11-14 | 13F | Jane Street Group, Llc | Put | 0 | -100,00 | 0 | -100,00 | |||
| 2026-02-09 | 13F | Huntington National Bank | 0 | -100,00 | 0 | |||||
| 2026-02-10 | 13F | Bank of New York Mellon Corp | 276.811 | -7,76 | 26.333 | -13,05 | ||||
| 2026-01-07 | 13F | Harbour Capital Advisors, LLC | 13.654 | -6,12 | 1.330 | -6,67 | ||||
| 2026-02-17 | 13F | Punch & Associates Investment Management, Inc. | 707.835 | -0,42 | 67.336 | -6,14 | ||||
| 2026-02-13 | 13F | Morgan Stanley | 656.791 | 9,11 | 62.481 | 2,85 | ||||
| 2025-11-14 | 13F | EAM Global Investors LLC | 0 | -100,00 | 0 | |||||
| 2026-02-17 | 13F | Captrust Financial Advisors | 8.179 | 5,12 | 778 | -0,89 | ||||
| 2026-02-17 | 13F | T. Rowe Price Investment Management, Inc. | 363.673 | -69,82 | 35 | -71,90 | ||||
| 2026-02-18 | 13F | Vermillion & White Wealth Management Group, LLC | 46 | 0,00 | 4 | 0,00 | ||||
| 2026-02-12 | 13F | Ensign Peak Advisors, Inc | 2.385 | -74,31 | 227 | -75,88 | ||||
| 2026-01-30 | 13F | New York State Teachers Retirement System | 38.691 | 2,50 | 4 | 0,00 | ||||
| 2026-02-10 | 13F | Florida Financial Advisors, Llc | 18.248 | 20,51 | 1.734 | 13,48 | ||||
| 2026-02-03 | 13F | Bokf, Na | 5.335 | -0,56 | 508 | -6,28 | ||||
| 2026-02-17 | 13F/A | Laurion Capital Management LP | 7.947 | 756 | ||||||
| 2026-02-10 | 13F | Goldman Sachs Group Inc | 387.274 | 141,57 | 36.841 | 127,72 | ||||
| 2026-02-11 | 13F | Los Angeles Capital Management Llc | 376 | -88,11 | 35 | -89,03 | ||||
| 2026-02-05 | 13F | Thrivent Financial For Lutherans | 32.862 | -16,91 | 3 | 0,00 | ||||
| 2026-02-17 | 13F | Bank Of America Corp /de/ | 215.387 | 38,53 | 20.490 | 30,59 | ||||
| 2025-11-13 | 13F | Winton Capital Group Ltd | 0 | -100,00 | 0 | |||||
| 2026-02-12 | 13F | Ankerstar Wealth, LLC | 14 | 1 | ||||||
| 2026-02-13 | 13F | Great West Life Assurance Co /can/ | 39.400 | -8,36 | 4 | -25,00 | ||||
| 2026-02-12 | 13F | Riverwater Partners LLC | 29.308 | 0,00 | 2.788 | -5,72 | ||||
| 2026-02-13 | 13F/A | Alberta Investment Management Corp | 0 | -100,00 | 0 | |||||
| 2026-02-06 | 13F | Global Retirement Partners, LLC | 68 | -98,98 | 6 | -99,11 | ||||
| 2026-02-17 | 13F | Harvest Investment Services, LLC | 39.522 | 33,89 | 3.760 | 26,18 | ||||
| 2025-11-14 | 13F | Bares Capital Management, Inc. | 402 | -99,60 | 41 | -99,56 | ||||
| 2026-02-17 | 13F | Driehaus Capital Management Llc | 483.833 | 14,18 | 46.027 | 7,63 | ||||
| 2026-02-12 | 13F | State Board Of Administration Of Florida Retirement System | 11.116 | 0,00 | 1.057 | -5,71 | ||||
| 2026-02-13 | 13F | Liberty One Investment Management, Llc | 7.938 | 755 | ||||||
| 2026-04-20 | 13F | Ritholtz Wealth Management | 8.404 | 678 | ||||||
| 2026-02-05 | 13F | O'Brien Greene & Co. Inc | 19.650 | 0,00 | 1.869 | -5,75 | ||||
| 2026-01-28 | 13F | Milestone Asset Management, Llc | 0 | -100,00 | 0 | |||||
| 2026-04-17 | 13F | Vermillion Wealth Management, Inc. | 2 | 0 | ||||||
| 2026-02-13 | 13F | Verition Fund Management LLC | 11.200 | -49,09 | 1.065 | -52,03 | ||||
| 2026-04-13 | 13F | True Wealth Design, LLC | 13 | 44,44 | 1 | |||||
| 2026-02-18 | 13F | State of Tennessee, Treasury Department | 10.405 | -19,52 | 1.168 | -10,43 | ||||
| 2026-01-26 | 13F | Dupont Capital Management Corp | 7.657 | 0,00 | 728 | -5,70 | ||||
| 2026-01-27 | 13F | Belpointe Asset Management LLC | 4.191 | -1,78 | 399 | -7,44 | ||||
| 2026-02-11 | 13F | Parallel Advisors, LLC | 29 | -27,50 | 3 | -50,00 | ||||
| 2025-11-14 | 13F | EAM Investors, LLC | 0 | -100,00 | 0 | |||||
| 2026-02-10 | 13F | State of Wyoming | 1.998 | -44,33 | 190 | -47,51 | ||||
| 2026-01-28 | 13F | Arizona State Retirement System | 12.236 | -5,91 | 1.164 | -11,28 | ||||
| 2026-01-21 | 13F | Flagship Harbor Advisors, Llc | 6 | 1 | ||||||
| 2026-01-27 | 13F | Hennessy Advisors Inc | 513.300 | -5,43 | 48.830 | -10,86 | ||||
| 2026-02-17 | 13F | Janus Henderson Group Plc | 48.571 | -72,36 | 4.619 | -73,96 | ||||
| 2026-02-06 | 13F | Profund Advisors Llc | 2.132 | 2,21 | 203 | -3,81 | ||||
| 2026-02-18 | 13F | Mackenzie Financial Corp | 2.878 | 1,52 | 280 | -2,10 | ||||
| 2026-02-13 | 13F | Quarry LP | 36 | 3 | ||||||
| 2026-01-28 | 13F | Salomon & Ludwin, LLC | 383 | 5,22 | 39 | 5,56 | ||||
| 2025-11-14 | 13F | Twinbeech Capital Lp | 0 | -100,00 | 0 | -100,00 | ||||
| 2026-02-02 | 13F | Truist Financial Corp | 3.526 | 335 | ||||||
| 2026-02-17 | 13F | Ameriprise Financial Inc | 1.087.427 | 15,46 | 103.447 | 8,83 | ||||
| 2026-04-14 | 13F | Bay Harbor Wealth Management, LLC | 8 | 60,00 | 1 | |||||
| 2026-01-14 | 13F | USA Financial Portformulas Corp | 0 | -100,00 | 0 | |||||
| 2026-02-02 | 13F | Horizon Investments, LLC | 22.166 | 2,64 | 2.109 | -3,26 | ||||
| 2026-02-13 | 13F | MAI Capital Management | 26 | 18,18 | 2 | 0,00 | ||||
| 2026-02-12 | 13F | MetLife Investment Management, LLC | 27.002 | 1,98 | 2.569 | -3,89 | ||||
| 2026-02-13 | 13F | Martingale Asset Management L P | 31.321 | -2,01 | 2.980 | -7,63 | ||||
| 2026-02-10 | 13F | Norges Bank | 233.020 | 22.167 | ||||||
| 2026-02-12 | 13F | Principal Securities, Inc. | 0 | -100,00 | 0 | |||||
| 2026-02-17 | 13F | Mirabella Financial Services Llp | 5.197 | 494 | ||||||
| 2026-02-26 | 13F | TD Capital Management LLC | 3 | 0 | ||||||
| 2026-02-13 | 13F | Sei Investments Co | 35.324 | 188,03 | 3.360 | 171,62 | ||||
| 2026-01-29 | 13F | Solidarilty Wealth, LLC | 3.678 | 350 | ||||||
| 2026-02-12 | 13F | Cloud Capital Management, LLC | 0 | -100,00 | 0 | |||||
| 2026-02-06 | 13F | Larson Financial Group LLC | 703 | -26,46 | 67 | -31,25 | ||||
| 2025-11-12 | 13F | Intrinsic Edge Capital Management LLC | 0 | -100,00 | 0 | |||||
| 2026-02-12 | 13F | BlackRock, Inc. | 6.993.155 | 4,91 | 665.259 | -1,11 | ||||
| 2026-02-17 | 13F | Maryland State Retirement & Pension System | 6.818 | 2,16 | 649 | -3,71 | ||||
| 2026-02-13 | 13F | Landscape Capital Management, L.l.c. | 2.235 | 0,00 | 213 | -5,78 | ||||
| 2026-04-06 | 13F | GAMMA Investing LLC | 1.893 | 69,17 | 153 | 43,40 | ||||
| 2026-02-11 | 13F | Ameritas Investment Partners, Inc. | 3.979 | 379 | ||||||
| 2026-02-17 | 13F | Zacks Investment Management | 23.345 | -10,33 | 2.221 | -15,49 | ||||
| 2026-02-12 | 13F | Colonial Trust Co / SC | 39 | 0,00 | 4 | 0,00 | ||||
| 2025-11-14 | 13F | Wellington Management Group Llp | 0 | -100,00 | 0 | -100,00 | ||||
| 2026-02-18 | 13F | GWM Advisors LLC | 0 | -100,00 | 0 | |||||
| 2026-02-17 | 13F | California State Teachers Retirement System | 41.816 | 0,47 | 3.978 | -5,31 | ||||
| 2026-02-09 | 13F | Sawgrass Asset Management Llc | 4.333 | -8,53 | 412 | -13,81 | ||||
| 2026-02-13 | 13F | Mariner, LLC | 156.037 | -4,10 | 14.839 | -9,63 | ||||
| 2026-02-10 | 13F | Belvedere Trading LLC | Call | 0 | -100,00 | 0 | ||||
| 2026-01-23 | 13F | TFC Financial Management | 1 | 0,00 | 0 | |||||
| 2026-02-17 | 13F | Susquehanna Fundamental Investments, Llc | 0 | -100,00 | 0 | |||||
| 2026-02-17 | 13F | Blair William & Co/il | 75.947 | 3,06 | 7.225 | -2,85 | ||||
| 2026-02-13 | 13F | Axim Planning & Wealth | 0 | -100,00 | 0 | |||||
| 2026-02-12 | 13F | Federated Hermes, Inc. | 352 | -34,94 | 33 | -38,89 | ||||
| 2026-02-17 | 13F | State Of Wisconsin Investment Board | 12.473 | -15,83 | 1.187 | -20,67 | ||||
| 2026-02-05 | 13F | Bessemer Group Inc | 164.249 | 1.562,10 | 16 | |||||
| 2026-02-03 | 13F | Mitsubishi UFJ Kokusai Asset Management Co., Ltd. | 238 | 0,00 | 23 | -4,17 | ||||
| 2026-02-13 | 13F | Pinnacle Wealth Planning Services, Inc. | 1.108 | 105 | ||||||
| 2026-02-13 | 13F | Segall Bryant & Hamill, Llc | 157.839 | 15.015 | ||||||
| 2026-01-13 | 13F | Norden Group Llc | 0 | -100,00 | 0 | |||||
| 2026-02-13 | 13F | Police & Firemen's Retirement System of New Jersey | 12.877 | -0,01 | 1.225 | -5,77 | ||||
| 2026-02-13 | 13F | Pathstone Holdings, LLC | 18.050 | 208,49 | 1.717 | 191,02 | ||||
| 2026-02-06 | 13F | Handelsbanken Fonder AB | 11.746 | 45,99 | 1 | |||||
| 2026-02-12 | 13F | Voya Investment Management Llc | 19.967 | 30,34 | 1.899 | 22,91 | ||||
| 2026-02-13 | 13F | Citigroup Inc | 94.082 | 11,40 | 8.950 | 5,01 | ||||
| 2026-02-17 | 13F | Signature Equity Partners, LLC | 647 | 62 | ||||||
| 2026-02-09 | 13F | Annis Gardner Whiting Capital Advisors, LLC | 18 | -73,13 | 2 | -83,33 | ||||
| 2026-02-11 | 13F | First Command Advisory Services, Inc. | 115 | 0,00 | 11 | -9,09 | ||||
| 2026-02-02 | 13F | Hussman Strategic Advisors, Inc. | 14.700 | 0,00 | 1.398 | -5,73 | ||||
| 2026-01-30 | 13F | Mitsubishi UFJ Trust & Banking Corp | 34.651 | 9,23 | 3.296 | 2,97 | ||||
| 2026-02-11 | 13F | LPL Financial LLC | 52.346 | 0,72 | 4.980 | -5,05 | ||||
| 2026-02-12 | 13F | BRYN MAWR TRUST Co | 213 | 52,14 | 20 | 42,86 | ||||
| 2026-01-27 | 13F | Evergreen Capital Management Llc | 4.106 | -16,87 | 391 | -21,69 | ||||
| 2026-02-12 | 13F | New York State Common Retirement Fund | 145.065 | -0,09 | 13.800 | -5,82 | ||||
| 2026-02-06 | 13F | Covestor Ltd | 1.663 | -30,62 | 0 | |||||
| 2026-02-10 | 13F | Bnp Paribas Arbitrage, Sa | 103.536 | -30,23 | 9.849 | -34,23 | ||||
| 2026-04-07 | 13F | Farther Finance Advisors, LLC | 3.348 | 19,87 | 270 | 1,89 | ||||
| 2026-02-10 | 13F | Belvedere Trading LLC | 0 | -100,00 | 0 | |||||
| 2026-02-13 | 13F | Kestra Advisory Services, LLC | 0 | -100,00 | 0 | |||||
| 2026-02-13 | 13F | Rhumbline Advisers | 130.966 | -5,58 | 12.460 | -11,00 | ||||
| 2026-01-29 | 13F | UBS Group AG | 183.050 | -25,47 | 17.414 | -29,75 | ||||
| 2026-02-03 | 13F | Sequoia Financial Advisors, LLC | 4.376 | 31,10 | 416 | 23,81 | ||||
| 2026-02-19 | 13F | Invesco Ltd. | 611.966 | 13,10 | 58.216 | 6,61 | ||||
| 2026-02-13 | 13F | Sterling Capital Management LLC | 320 | 188,29 | 30 | 172,73 | ||||
| 2026-01-28 | 13F | Klp Kapitalforvaltning As | 9.450 | 0,00 | 899 | -5,77 | ||||
| 2026-02-13 | 13F | Stifel Financial Corp | 11.375 | 3,17 | 1.082 | -2,70 | ||||
| 2026-02-17 | 13F | 2Xideas AG | 41.639 | 3.961 | ||||||
| 2026-01-14 | 13F | Spire Wealth Management | 0 | -100,00 | 0 | |||||
| 2026-02-11 | 13F | CSM Advisors, LLC | 64.891 | -21,09 | 6 | -25,00 | ||||
| 2025-11-14 | 13F | Susquehanna International Group, Llp | Put | 0 | -100,00 | 0 | -100,00 | |||
| 2026-02-11 | 13F | Jpmorgan Chase & Co | 735.933 | -2,96 | 70.009 | -8,53 |
Other Listings
| DE:I4F | 87,54 € |