Grundlæggende statistik
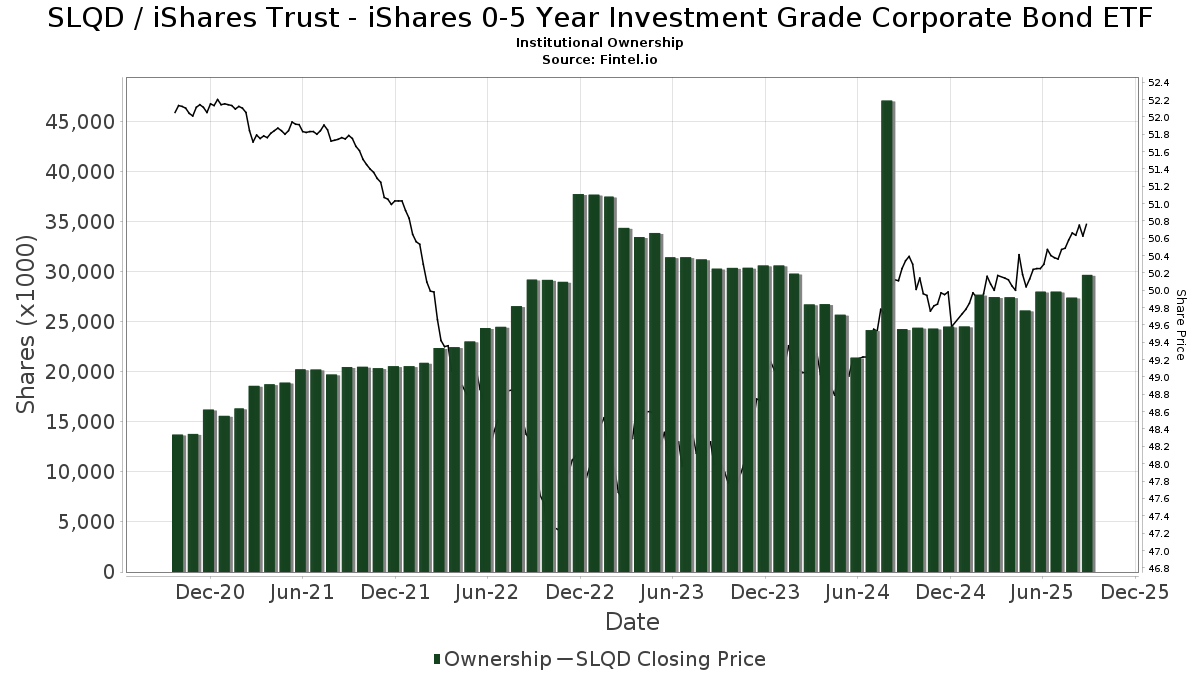
| Institutionelle ejere | 248 total, 248 long only, 0 short only, 0 long/short - change of 0,40% MRQ |
| Gennemsnitlig porteføljeallokering | 0.4027 % - change of -20,64% MRQ |
| Institutionelle aktier (lange) | 28.923.974 (ex 13D/G) - change of -1,07MM shares -3,58% MRQ |
| Institutionel værdi (lang) | $ 1.436.534 USD ($1000) |
Institutionelt ejerskab og aktionærer
iShares Trust - iShares 0-5 Year Investment Grade Corporate Bond ETF (US:SLQD) har 248 institutionelle ejere og aktionærer, der har indsendt 13D/G- eller 13F-formularer til Securities Exchange Commission (SEC). Disse institutioner har i alt 28,923,974 aktier. Største aktionærer omfatter Morgan Stanley, Allspring Global Investments Holdings, LLC, LJI Wealth Management, LLC, LPL Financial LLC, UBS Group AG, Pensionmark Financial Group, Llc, MAI Capital Management, Bramshill Investments, LLC, Farmers & Merchants Investments Inc, and Ameriprise Financial Inc .
iShares Trust - iShares 0-5 Year Investment Grade Corporate Bond ETF (NasdaqGM:SLQD) institutionel ejerskabsstruktur viser aktuelle positioner i virksomheden efter institutioner og fonde, samt seneste ændringer i positionsstørrelse. Større aktionærer kan omfatte individuelle investorer, investeringsforeninger, hedgefonde eller institutioner. Skema 13D angiver, at investoren besidder (eller besidder) mere end 5 % af virksomheden og har til hensigt (eller har til hensigt at) aktivt at forfølge en ændring i forretningsstrategi. Skema 13G indikerer en passiv investering på over 5%.
The share price as of April 27, 2026 is 50,54 / share. Previously, on April 28, 2025, the share price was 50,37 / share. This represents an increase of 0,34% over that period.
Fondens stemningsscore
Fund Sentiment Score (fka Ownership Accumulation Score) finder de aktier, der bliver mest købt af fonde. Det er resultatet af en sofistikeret, multi-faktor kvantitativ model, der identificerer virksomheder med de højeste niveauer af institutionel akkumulering. Scoringsmodellen bruger en kombination af den samlede stigning i oplyste ejere, ændringerne i porteføljeallokeringer i disse ejere og andre målinger. Tallet går fra 0 til 100, hvor højere tal indikerer et højere niveau af akkumulering for sine jævnaldrende, og 50 er gennemsnittet.
Opdateringsfrekvens: Dagligt
Se Ownership Explorer, som giver en liste over højest rangerende virksomheder.
AI+ Ask Fintel’s AI assistant about iShares Trust - iShares 0-5 Year Investment Grade Corporate Bond ETF.
Select a question to share a public post with an AI-crafted answer.
Thinking of good questions…
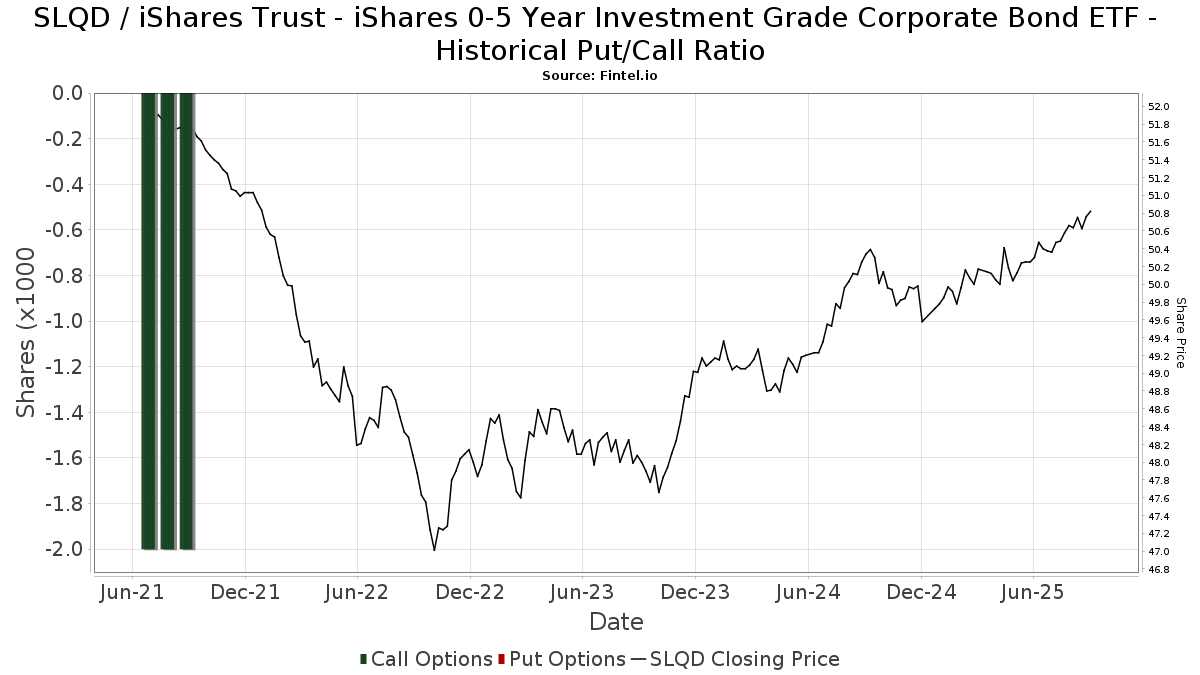
Institutionel Put/Call-forhold
Ud over at indberette standardaktie- og gældsudstedelser skal institutter med mere end 100 mill. aktiver under forvaltning også oplyse deres put- og call-optionsbeholdninger. Da salgsoptioner generelt indikerer negativ stemning, og købsoptioner indikerer positiv stemning, kan vi få en fornemmelse af den overordnede institutionelle stemning ved at plotte forholdet mellem put og kald. Diagrammet til højre viser det historiske put/call-forhold for dette instrument.
Brug af Put/Call Ratio som en indikator for investorernes stemning overvinder en af de vigtigste mangler ved at bruge totalt institutionelt ejerskab, som er, at en betydelig mængde af aktiver under forvaltning investeres passivt for at spore indekser. Passivt forvaltede fonde køber typisk ikke optioner, så indikatoren for put/call-forholdet følger mere nøje følelsen af aktivt forvaltede fonde.
13F og NPORT arkivering
Detaljer om 13F-arkivering er gratis. Detaljer om NP-ansøgninger kræver et premium-medlemskab. Grønne rækker angiver nye positioner. Røde rækker angiver lukkede positioner. Klik på linket ikon for at se den fulde transaktionshistorik.
Opgrader
for at låse premium-data op og eksportere til Excel ![]() .
.
| Fil dato | Kilde | Investor | Type | Gennemsnitlig pris (Øst) |
Aktier | Δ Aktier (%) |
Rapporteret Værdi ($1000) |
Δ Værdi (%) |
Port Alloc (%) |
|
|---|---|---|---|---|---|---|---|---|---|---|
| 2026-01-29 | 13F | UBS Group AG | 1.128.504 | 1,13 | 57.215 | 0,87 | ||||
| 2026-01-29 | 13F | Concurrent Investment Advisors, LLC | 5.887 | -3,92 | 298 | -4,18 | ||||
| 2026-02-12 | 13F | Bank Of Montreal /can/ | 40.474 | -0,79 | 2.052 | -1,01 | ||||
| 2026-01-29 | 13F | Sanctuary Advisors, LLC | 87.285 | 3,83 | 4.425 | 3,56 | ||||
| 2026-02-10 | 13F | American Money Management, LLC | 26.377 | -7,61 | 1.337 | -7,86 | ||||
| 2025-11-13 | 13F | Newbridge Financial Services Group, Inc. | 0 | -100,00 | 0 | |||||
| 2026-02-13 | 13F | Integrated Wealth Concepts LLC | 21.862 | 9,88 | 1.108 | 9,59 | ||||
| 2026-04-08 | 13F | Thompson Investment Management, Inc. | 354 | 0,00 | 18 | 0,00 | ||||
| 2026-02-12 | 13F | Principal Securities, Inc. | 106.164 | 6,14 | 5.382 | 5,86 | ||||
| 2025-11-14 | 13F | Eqis Capital Management, Inc. | 0 | -100,00 | 0 | -100,00 | ||||
| 2026-04-21 | 13F | One Wealth Advisors, LLC | 6.551 | -3,93 | 331 | -4,35 | ||||
| 2026-02-12 | 13F | Providence Capital Advisors, LLC | 88 | 0,00 | 4 | 0,00 | ||||
| 2026-01-28 | 13F | EPG Wealth Management LLC | 37 | 0,00 | 2 | 0,00 | ||||
| 2026-04-10 | 13F | Voisard Asset Management Group, Inc. | 529.983 | -37,65 | 26.759 | -37,90 | ||||
| 2026-02-12 | 13F | Colonial Trust Co / SC | 179.355 | 2,39 | 9.093 | 2,13 | ||||
| 2026-04-07 | 13F | Farther Finance Advisors, LLC | 473 | 456,47 | 24 | 475,00 | ||||
| 2026-02-03 | 13F | International Assets Investment Management, Llc | 23.821 | -31,66 | 1.208 | -31,26 | ||||
| 2026-04-17 | 13F | Hanson & Doremus Investment Management | 418 | 0,00 | 0 | |||||
| 2026-04-22 | 13F | Janney Montgomery Scott LLC | 31.185 | 25,29 | 2 | 0,00 | ||||
| 2026-02-13 | 13F | Morgan Stanley | 2.353.233 | 1,58 | 119.309 | 1,32 | ||||
| 2026-02-11 | 13F | Allianz Asset Management GmbH | 360.957 | -19,25 | 18.301 | -19,45 | ||||
| 2026-04-24 | 13F | Medallion Wealth Advisors, LLC | 1.327 | 0,00 | 67 | 0,00 | ||||
| 2026-02-02 | 13F | Mutual Advisors, LLC | 21.259 | 0,00 | 1.078 | -0,37 | ||||
| 2026-04-27 | 13F | Turn8 Private Wealth Inc. | 60.142 | 28,09 | 3.037 | 27,61 | ||||
| 2026-04-22 | 13F | Apollon Wealth Management, LLC | 7.114 | -9,13 | 359 | -9,34 | ||||
| 2026-01-27 | 13F | TD Waterhouse Canada Inc. | 54.443 | 4,57 | 2.760 | 4,55 | ||||
| 2026-04-22 | 13F | Spire Wealth Management | 6.818 | -4,55 | 344 | -4,97 | ||||
| 2026-01-30 | 13F | Sigma Planning Corp | 29.415 | 12,10 | 1.491 | 11,85 | ||||
| 2026-02-10 | 13F/A | Northwestern Mutual Wealth Management Co | 173.068 | 3,18 | 8.775 | 2,91 | ||||
| 2026-02-13 | 13F | Kestra Advisory Services, LLC | 0 | -100,00 | 0 | |||||
| 2026-02-03 | 13F | LJI Wealth Management, LLC | 1.308.304 | 13,44 | 66.331 | 13,15 | ||||
| 2026-01-26 | 13F | AE Wealth Management LLC | 1.504 | -4,20 | 76 | -3,80 | ||||
| 2026-04-13 | 13F | Chesley Taft & Associates LLC | 0 | -100,00 | 0 | |||||
| 2026-02-06 | 13F | GPS Wealth Strategies Group, LLC | 81 | -83,80 | 4 | -84,00 | ||||
| 2026-02-06 | 13F | Larson Financial Group LLC | 192 | 0,00 | 10 | 0,00 | ||||
| 2026-02-06 | 13F | Global Retirement Partners, LLC | 3.804 | -9,15 | 193 | -9,43 | ||||
| 2026-02-11 | 13F | Tiaa Trust, National Association | 280.277 | -0,01 | 14.210 | -0,27 | ||||
| 2026-01-12 | 13F | Rialto Wealth Management, LLC | 11.559 | -0,36 | 586 | -0,51 | ||||
| 2026-02-13 | 13F | Mml Investors Services, Llc | 149.203 | 8,26 | 7.565 | 7,98 | ||||
| 2026-04-08 | 13F | Wealth Enhancement Advisory Services, Llc | 71.392 | -17,55 | 3.597 | -18,14 | ||||
| 2026-02-05 | 13F | Disciplined Investments, LLC | 6.640 | -16,10 | 337 | -16,42 | ||||
| 2026-02-12 | 13F | Commonwealth Equity Services, Llc | 154.093 | 7,27 | 7.813 | 111.500,00 | ||||
| 2026-01-15 | 13F | Lodestone Wealth Management LLC | 343 | 17 | ||||||
| 2026-02-10 | 13F | Camden National Bank | 353.356 | 6,32 | 17.915 | 6,05 | ||||
| 2026-02-12 | 13F | Loomis Sayles & Co L P | 172.000 | 156,72 | 8.720 | 156,09 | ||||
| 2026-01-12 | 13F | CVA Family Office, LLC | 40 | 0,00 | 2 | 0,00 | ||||
| 2026-02-12 | 13F | Federation des caisses Desjardins du Quebec | 129.836 | 3,46 | 6.583 | 3,20 | ||||
| 2026-02-17 | 13F | Cetera Investment Advisers | 293.204 | 3,27 | 14.865 | 3,01 | ||||
| 2026-04-21 | 13F | Vise Technologies, Inc. | 14.861 | 0,00 | 753 | 0,00 | ||||
| 2026-04-17 | 13F | AdvisorNet Financial, Inc | 4.395 | -2,18 | 222 | -2,64 | ||||
| 2026-01-28 | 13F | Mowery & Schoenfeld Wealth Management, LLC | 43 | 2 | ||||||
| 2026-04-24 | 13F | Private Advisor Group, LLC | 119.580 | 6,15 | 6.038 | 5,71 | ||||
| 2025-11-10 | 13F | Siligmueller & Norvid Wealth Advisors LLC | 0 | -100,00 | 0 | |||||
| 2026-02-09 | 13F | Buckhead Capital Management Llc | 9.603 | 3,31 | 487 | 2,97 | ||||
| 2026-02-17 | 13F | Bramshill Investments, LLC | 997.815 | 3,16 | 50.589 | 2,89 | ||||
| 2026-02-12 | 13F | Scotia Capital Inc. | 136.027 | 1,90 | 6.897 | 1,64 | ||||
| 2026-02-06 | 13F | Vestmark Advisory Solutions, Inc. | 378.511 | 1,45 | 19.190 | 1,19 | ||||
| 2026-02-10 | 13F | Bnp Paribas Arbitrage, Sa | 10 | 1 | ||||||
| 2026-02-12 | 13F | Insigneo Advisory Services, Llc | 14.404 | -2,57 | 730 | -2,80 | ||||
| 2026-02-10 | 13F | Weaver Consulting Group | 4.837 | 0,00 | 245 | 0,00 | ||||
| 2026-02-17 | 13F | Vista Investment Management | 42.973 | 14,36 | 2.179 | 14,03 | ||||
| 2026-02-13 | 13F | Stifel Financial Corp | 228.232 | -0,43 | 11.571 | -0,68 | ||||
| 2026-02-03 | 13F | Harel Insurance Investments & Financial Services Ltd. | 99.882 | 0,61 | 5 | 0,00 | ||||
| 2026-02-09 | 13F | MRP Capital Investments, LLC | 885 | -3,28 | 45 | -4,35 | ||||
| 2026-02-17 | 13F | LaSalle St. Investment Advisors, LLC | 156.820 | 15,85 | 8 | 16,67 | ||||
| 2026-04-14 | 13F | Prospera Financial Services Inc | 0 | -100,00 | 0 | |||||
| 2026-02-06 | 13F | Envestnet Portfolio Solutions, Inc. | 12.927 | -0,12 | 655 | -0,30 | ||||
| 2025-11-14 | 13F | Ancora Advisors, LLC | 0 | -100,00 | 0 | -100,00 | ||||
| 2026-02-11 | 13F | Cedar Point Capital Partners, LLC | 10.818 | -1,21 | 548 | -1,44 | ||||
| 2026-04-09 | 13F | Kelly Financial Group Llc | 11.815 | -3,32 | 597 | -3,72 | ||||
| 2026-01-27 | 13F | Probity Advisors, Inc. | 12.656 | 0,00 | 642 | -0,31 | ||||
| 2026-01-20 | 13F | Stratos Wealth Partners, LTD. | 31.470 | -16,66 | 1.596 | -16,88 | ||||
| 2026-01-27 | 13F | Belpointe Asset Management LLC | 64.378 | -18,54 | 3.264 | -18,77 | ||||
| 2026-02-10 | 13F | Savant Capital, LLC | 25.801 | -0,03 | 1.308 | -0,23 | ||||
| 2026-02-17 | 13F | Warren Averett Asset Management, LLC | 103.375 | 0,11 | 5.241 | -0,13 | ||||
| 2026-02-10 | 13F | Envestnet Asset Management Inc | 189.318 | 5,30 | 9.598 | 5,03 | ||||
| 2026-03-04 | 13F | Rehmann Capital Advisory Group | 20.826 | 4,87 | 1.056 | 4,56 | ||||
| 2026-02-18 | 13F | Sierra Capital LLC | 181.639 | -0,03 | 9 | 0,00 | ||||
| 2026-04-14 | 13F | Nbc Securities, Inc. | 394 | 0,25 | 20 | 0,00 | ||||
| 2026-02-17 | 13F | GeoWealth Management, LLC | 16.156 | -6,43 | 819 | -6,61 | ||||
| 2026-04-13 | 13F | Creative Financial Designs Inc /adv | 469.587 | -3,88 | 23.709 | -4,28 | ||||
| 2026-01-30 | 13F | Cosner Financial Group, LLC | 32.565 | -6,27 | 1.651 | -6,51 | ||||
| 2026-02-19 | 13F | Invesco Ltd. | 0 | -100,00 | 0 | |||||
| 2026-02-20 | 13F | Sunbelt Securities, Inc. | 2.671 | 0,00 | 135 | 0,00 | ||||
| 2026-01-30 | 13F | Pure Portfolios Holdings Llc | 3.951 | 200 | ||||||
| 2026-02-17 | 13F | Delaware Management Holdings, Inc. | 30.605 | 1.552 | ||||||
| 2026-04-15 | 13F | Wolff Financial Management Llc | 11.119 | -1,23 | 561 | -1,58 | ||||
| 2026-02-12 | 13F | Wescott Financial Advisory Group, LLC | 22.520 | 0,30 | 1.142 | 0,00 | ||||
| 2026-01-29 | 13F | Comerica Bank | 24.965 | -40,99 | 1.266 | -41,16 | ||||
| 2026-02-06 | 13F | Integral Investment Advisors, Inc. | 210.207 | 5,16 | 10.657 | 4,89 | ||||
| 2026-04-14 | 13F | FC Advisory LLC | 19.475 | -2,02 | 983 | -2,38 | ||||
| 2026-03-24 | 13F | Armis Advisers, LLC | 5.349 | -39,08 | 269 | -39,41 | ||||
| 2026-02-12 | 13F | Jane Street Group, Llc | 7.544 | -96,19 | 382 | -96,20 | ||||
| 2026-02-18 | 13F | GWM Advisors LLC | 477.814 | 3,32 | 24.225 | 3,05 | ||||
| 2026-02-11 | 13F | Franklin Resources Inc | 3.550 | 7,58 | 180 | 7,19 | ||||
| 2026-02-05 | 13F | Cambridge Investment Research Advisors, Inc. | 46.907 | 11,27 | 2 | 0,00 | ||||
| 2026-02-12 | 13F | StoneX Group Inc. | 25.310 | 1.283 | ||||||
| 2025-11-14 | 13F | Imprint Wealth LLC | 0 | -100,00 | 0 | |||||
| 2026-02-04 | 13F | Global Wealth Management Investment Advisory, Inc. | 258.597 | 8,61 | 13.111 | 8,33 | ||||
| 2026-02-12 | 13F | Financial Engines Advisors L.L.C. | 135.240 | 11,73 | 6.857 | 11,44 | ||||
| 2026-02-13 | 13F | Fortis Capital Management LLC | 17.804 | 0,69 | 903 | 0,45 | ||||
| 2026-02-13 | 13F | Gts Securities Llc | 0 | -100,00 | 0 | |||||
| 2026-02-17 | 13F | Stokes Family Office, LLC | 16.559 | -7,56 | 840 | -7,80 | ||||
| 2026-01-29 | 13F | DecisionPoint Financial, LLC | 93.546 | -3,61 | 4.743 | -3,66 | ||||
| 2026-02-05 | 13F | Bank Julius Baer & Co. Ltd, Zurich | 32.059 | 0,04 | 1.625 | -0,18 | ||||
| 2026-01-15 | 13F | 4J Wealth Management LLC | 13.671 | -3,05 | 693 | -3,21 | ||||
| 2026-02-17 | 13F | Bank Of America Corp /de/ | 589.218 | -6,44 | 29.873 | -6,68 | ||||
| 2026-02-06 | 13F | Advisory Alpha, LLC | 13.044 | 0,00 | 661 | 0,00 | ||||
| 2026-01-21 | 13F | Capital Investment Advisory Services, LLC | 375 | 0,00 | 19 | 0,00 | ||||
| 2026-01-26 | 13F | Private Trust Co Na | 8.066 | 0,01 | 409 | -0,24 | ||||
| 2026-02-11 | 13F | Pettyjohn, Wood & White, Inc | 8.490 | 4,94 | 430 | 4,62 | ||||
| 2026-02-12 | 13F | Pitcairn Co | 0 | -100,00 | 0 | |||||
| 2026-02-13 | 13F | Biondo Investment Advisors, LLC | 32.460 | 3,81 | 1.646 | 3,52 | ||||
| 2026-02-13 | 13F | National Bank Of Canada /fi/ | 2.160 | 43,24 | 110 | 43,42 | ||||
| 2026-04-22 | 13F | Ifrah Financial Services, Inc. | 133.118 | -20,05 | 6.721 | -20,38 | ||||
| 2025-11-06 | 13F | RFG Advisory, LLC | 0 | -100,00 | 0 | |||||
| 2026-04-22 | 13F | Investment Advisory Group, LLC | 10.676 | 7,02 | 539 | 6,73 | ||||
| 2026-04-13 | 13F | IFP Advisors, Inc | 59.654 | 8,25 | 3.012 | 7,81 | ||||
| 2026-02-13 | 13F | Mariner, LLC | 49.109 | -9,51 | 2.490 | -9,75 | ||||
| 2025-10-31 | 13F | National Asset Management, Inc. | 0 | -100,00 | 0 | |||||
| 2025-11-12 | 13F | Ameriflex Group, Inc. | 0 | -100,00 | 0 | |||||
| 2026-04-09 | 13F | Secure Asset Management, LLC | 4.661 | 0,39 | 235 | 0,00 | ||||
| 2026-04-27 | 13F | Capital Financial Group Inc\co\ /adv | 32.055 | -11,41 | 1.618 | -11,78 | ||||
| 2026-02-14 | 13F | Adalta Capital Management LLC | 7.800 | 0,00 | 395 | -0,25 | ||||
| 2026-01-29 | 13F | Camelot Portfolios, LLC | 108 | 5 | ||||||
| 2026-04-24 | 13F | Argent Advisors, Inc. | 41.908 | -0,20 | 2.116 | -0,66 | ||||
| 2026-02-17 | 13F | Royal Bank Of Canada | 687.598 | 3,29 | 34.861 | 3,02 | ||||
| 2026-02-04 | 13F | Ameritas Advisory Services, LLC | 0 | -100,00 | 0 | |||||
| 2026-04-03 | 13F | Investors Research Corp | 92 | 0,00 | 5 | 0,00 | ||||
| 2026-02-11 | 13F | Buckingham Strategic Partners | 54.006 | -41,02 | 2.738 | -41,00 | ||||
| 2025-11-04 | 13F | L.m. Kohn & Company | 4.815 | -15,75 | 245 | -15,57 | ||||
| 2026-01-16 | 13F | Life Planning Partners, Inc | 47.297 | 31,43 | 2.398 | 31,06 | ||||
| 2026-02-17 | 13F | Fairview Capital Investment Management, Llc | 81.026 | -0,12 | 4.108 | -0,36 | ||||
| 2026-02-17 | 13F | Equitable Holdings, Inc. | 24.193 | -4,58 | 1.227 | -4,81 | ||||
| 2026-02-09 | 13F | Cary Street Partners Financial Llc | 26.867 | 1,47 | 1.362 | 1,26 | ||||
| 2026-02-12 | 13F | Summit Financial, LLC | 138.510 | -1,59 | 7.022 | -1,83 | ||||
| 2026-02-10 | 13F | Godfrey Financial Associates, Inc. | 1.450 | 74 | ||||||
| 2026-01-30 | 13F | Caldwell Securities, Inc | 75 | 0,00 | 4 | 0,00 | ||||
| 2026-04-20 | 13F | Fonville Wealth Management LLC | 55.530 | -4,76 | 2.804 | -5,14 | ||||
| 2026-01-21 | 13F | Seed Wealth Management, Inc. | 0 | -100,00 | 0 | |||||
| 2026-02-17 | 13F | Tower Research Capital LLC (TRC) | 165 | -99,76 | 8 | -99,77 | ||||
| 2026-02-13 | 13F | Arkadios Wealth Advisors | 18.571 | 22,11 | 942 | 21,73 | ||||
| 2026-04-20 | 13F | Hoxton Planning & Management, LLC | 6.505 | -5,96 | 328 | -6,29 | ||||
| 2026-04-27 | 13F | Meramec Financial Planners, LLC | 1.022 | 0,00 | 52 | 0,00 | ||||
| 2026-02-17 | 13F | Advisor Group Holdings, Inc. | 86.998 | -19,60 | 4.412 | -19,74 | ||||
| 2026-04-20 | 13F | Greenup Street Wealth Management Llc | 458.289 | -1,70 | 23.139 | -2,11 | ||||
| 2026-02-03 | 13F | Strengthening Families & Communities, LLC | 63 | 1,61 | 3 | 0,00 | ||||
| 2026-02-09 | 13F | IPG Investment Advisors LLC | 20.545 | 3,60 | 1.042 | 3,27 | ||||
| 2026-02-11 | 13F | Parallel Advisors, LLC | 9.945 | 0,00 | 504 | -0,20 | ||||
| 2026-04-27 | 13F | Pensionmark Financial Group, Llc | 1.032.454 | 3,82 | 52.129 | 3,39 | ||||
| 2026-02-12 | 13F | Triumph Capital Management | 2.427 | 84,14 | 123 | 86,36 | ||||
| 2026-01-28 | 13F | Geneos Wealth Management Inc. | 100 | 0,00 | 5 | 0,00 | ||||
| 2026-04-13 | 13F | Hm Payson & Co | 0 | -100,00 | 0 | |||||
| 2026-02-13 | 13F | Baird Financial Group, Inc. | 27.455 | -30,13 | 1.392 | -30,35 | ||||
| 2026-04-27 | 13F | Sound Income Strategies, LLC | 296 | 0,00 | 15 | -6,67 | ||||
| 2025-10-31 | 13F | Partners Capital Investment Group, Llp | 0 | -100,00 | 0 | |||||
| 2026-02-10 | 13F | Alpha Financial Partners, LLC | 9.899 | -65,20 | 502 | -65,35 | ||||
| 2026-04-20 | 13F | Clune & Associates, Ltd. | 21.093 | -13,49 | 1.065 | -13,83 | ||||
| 2026-02-05 | 13F | Atria Investments Llc | 32.278 | 14,09 | 1.636 | 13,77 | ||||
| 2026-02-13 | 13F | Atlas Capital Advisors Llc | 0 | -100,00 | 0 | |||||
| 2026-02-17 | 13F | Jones Financial Companies Lllp | 59.611 | 21,34 | 3.022 | 21,22 | ||||
| 2026-02-17 | 13F/A | Sentinus, LLC | 19.914 | 1.010 | ||||||
| 2026-03-06 | 13F | Hsbc Holdings Plc | 6.641 | -1,70 | 337 | -2,04 | ||||
| 2026-04-23 | 13F/A | Private Wealth Group, LLC | 22.395 | 0,00 | 1.131 | -0,44 | ||||
| 2026-01-30 | 13F | Laurel Wealth Advisors LLC | 40.161 | -0,68 | 2.036 | -0,92 | ||||
| 2026-02-10 | 13F/A | LVZ Advisors, Inc. | 4.155 | -17,89 | 211 | -18,29 | ||||
| 2025-11-06 | 13F | Fundamentun, Llc | 0 | -100,00 | 0 | |||||
| 2026-02-06 | 13F | EverSource Wealth Advisors, LLC | 2 | 0,00 | 0 | |||||
| 2026-02-17 | 13F | Snowden Capital Advisors LLC | 3.964 | -18,03 | 201 | -18,37 | ||||
| 2025-10-30 | 13F | Traub Capital Management LLC | 0 | -100,00 | 0 | -100,00 | ||||
| 2026-02-11 | 13F | Cerity Partners LLC | 0 | -100,00 | 0 | |||||
| 2026-02-17 | 13F/A | Kovack Advisors, Inc. | 4.469 | 227 | ||||||
| 2026-04-07 | 13F | City Center Advisors, LLC | 20.779 | -17,65 | 1.049 | -17,98 | ||||
| 2026-04-24 | 13F | Ndwm Llc | 128.722 | 258,57 | 6.499 | 257,09 | ||||
| 2025-11-05 | 13F | Prime Capital Investment Advisors, LLC | 0 | -100,00 | 0 | |||||
| 2025-11-10 | 13F | Cary Street Partner Investment Advisory Llc | 0 | -100,00 | 0 | |||||
| 2026-02-12 | 13F | BlackRock, Inc. | 3.323 | 1,28 | 168 | 1,20 | ||||
| 2026-04-07 | 13F | U.S. Capital Wealth Advisors, LLC | 4.164 | 210 | ||||||
| 2026-02-13 | 13F | Citigroup Inc | 1.942 | -0,31 | 98 | -1,01 | ||||
| 2026-02-17 | 13F | Edmond De Rothschild Holding S.a. | 6.250 | 0,00 | 317 | -0,32 | ||||
| 2026-02-13 | 13F | Pinnacle Wealth Planning Services, Inc. | 2.072 | 105 | ||||||
| 2026-01-30 | 13F | Kiker Wealth Management, LLC | 0 | -100,00 | 0 | |||||
| 2026-02-10 | 13F | MidAtlantic Capital Management, Inc. | 6.907 | 0,00 | 350 | -0,28 | ||||
| 2026-02-17 | 13F | RMB Capital Management, LLC | 32.584 | 0,33 | 1.652 | 0,12 | ||||
| 2026-04-22 | 13F | Atlantic Edge Private Wealth Management, LLC | 1.300 | 0,00 | 66 | 0,00 | ||||
| 2026-02-11 | 13F | Financiere des Professionnels - Fonds d,investissement inc. | 434.400 | -22,46 | 22.024 | -22,65 | ||||
| 2026-02-17 | 13F | Bank Hapoalim Bm | 0 | |||||||
| 2026-02-02 | 13F | Pittenger & Anderson Inc | 2.100 | 0,00 | 106 | 0,00 | ||||
| 2026-01-29 | 13F | Advisors Capital Management, LLC | 11.253 | 151,63 | 571 | 151,10 | ||||
| 2026-02-13 | 13F | Colony Group, LLC | 4.488 | 228 | ||||||
| 2026-04-13 | 13F | Wiser Wealth Management, Inc | 491.388 | 6,14 | 24.810 | 5,70 | ||||
| 2026-02-17 | 13F | Garden State Investment Advisory Services LLC | 24.183 | -3,89 | 1.227 | -4,07 | ||||
| 2026-02-17 | 13F | Ameriprise Financial Inc | 810.737 | -13,47 | 41.107 | -13,67 | ||||
| 2026-04-13 | 13F | LexAurum Advisors, LLC | 4.361 | -18,93 | 220 | -19,41 | ||||
| 2026-02-17 | 13F | Susquehanna International Group, Llp | 12.428 | 630 | ||||||
| 2026-02-13 | 13F | SRS Capital Advisors, Inc. | 873 | 44 | ||||||
| 2026-02-19 | 13F | Atomi Financial Group, Inc. | 12.365 | 0,03 | 627 | -0,32 | ||||
| 2026-02-02 | 13F | Oppenheimer & Co Inc | 0 | -100,00 | 0 | -100,00 | ||||
| 2026-04-27 | 13F | Actinver Wealth Management, Inc. | 147.022 | -1,40 | 7.423 | -1,80 | ||||
| 2026-01-13 | 13F | Kathmere Capital Management, LLC | 93.911 | -4,04 | 4.761 | -4,28 | ||||
| 2026-02-06 | 13F | BOK Financial Private Wealth, Inc. | 0 | -100,00 | 0 | |||||
| 2026-02-10 | 13F | Waterloo Capital, L.P. | 207.052 | -6,50 | 10.498 | -6,74 | ||||
| 2026-04-22 | 13F | Portus Wealth Advisors, LLC | 49.834 | 10,34 | 2.516 | 9,92 | ||||
| 2026-04-22 | 13F | Tru Independence Asset Management 2, Llc | 6.552 | 0,00 | 331 | -0,60 | ||||
| 2026-02-04 | 13F | Ofc Financial Planning, Llc | 31.674 | -3,43 | 1.606 | -3,72 | ||||
| 2026-02-12 | 13F | JT Stratford LLC | 100.312 | -2,44 | 5.086 | -2,70 | ||||
| 2026-03-16 | 13F/A | Rockefeller Capital Management L.P. | 6.560 | 415,72 | 333 | 418,75 | ||||
| 2026-02-02 | 13F | Headinvest, Llc | 4.372 | 0,00 | 222 | -0,45 | ||||
| 2026-02-11 | 13F | Strategic Advocates LLC | 9 | 0,00 | 0 | |||||
| 2026-02-11 | 13F | Montis Financial, LLC | 16.300 | -27,16 | 826 | -27,35 | ||||
| 2026-01-28 | 13F | Trail Ridge Investment Advisors, LLC | 80.396 | 5,77 | 4.076 | 5,51 | ||||
| 2026-02-05 | 13F | Allworth Financial LP | 6.182 | 23,17 | 313 | 22,75 | ||||
| 2026-02-19 | 13F | CI Private Wealth, LLC | 414.681 | -0,70 | 21.024 | 2.155,79 | ||||
| 2026-04-08 | 13F | JGP Wealth Management, LLC | 60.692 | 8,24 | 3.064 | 7,81 | ||||
| 2026-01-20 | 13F | Whalen Wealth Management Inc. | 0 | -100,00 | 0 | |||||
| 2026-04-15 | 13F | Alhambra Investment Partners LLC | 4.381 | 0,00 | 221 | -0,45 | ||||
| 2026-01-26 | 13F | Valmark Advisers, Inc. | 6.668 | -5,45 | 338 | -5,59 | ||||
| 2026-02-12 | 13F | Saiph Capital, LLC | 0 | -100,00 | 0 | |||||
| 2026-02-05 | 13F | Bessemer Group Inc | 8.507 | 0 | ||||||
| 2026-02-17 | 13F | Townsend Financial Planning, LLC | 67.715 | 3.433 | ||||||
| 2026-01-15 | 13F | Allspring Global Investments Holdings, LLC | 2.077.168 | 18,63 | 105.312 | 18,33 | ||||
| 2026-04-22 | 13F | Semitam Bonam Llc | 4.941 | 0,00 | 249 | -0,40 | ||||
| 2026-02-13 | 13F | MAI Capital Management | 1.030.751 | 8,35 | 52.259 | 8,08 | ||||
| 2025-11-14 | 13F | NorthRock Partners, LLC | 0 | -100,00 | 0 | -100,00 | ||||
| 2026-01-30 | 13F | Citizens Financial Group Inc/ri | 13.722 | 142,18 | 696 | 141,32 | ||||
| 2026-02-17 | 13F | London & Capital Asset Management Ltd | 26.900 | 1.364 | ||||||
| 2026-01-21 | 13F | Summa Corp. | 14.800 | 0,00 | 750 | -0,27 | ||||
| 2026-01-23 | 13F | Nbt Bank N A /ny | 51 | 0,00 | 58 | 0,00 | ||||
| 2026-02-13 | 13F | Macquarie Group Ltd | 0 | -100,00 | 0 | |||||
| 2026-02-17 | 13F | Boreal Capital Management LLC | 5.060 | 0,00 | 257 | -0,39 | ||||
| 2026-02-04 | 13F | Hallmark Capital Management Inc | 1.618 | 0,00 | 82 | 0,00 | ||||
| 2026-01-29 | 13F | Ashton Thomas Private Wealth, LLC | 6.208 | 8,02 | 315 | 7,53 | ||||
| 2026-04-21 | 13F | Sugar Maple Asset Management, LLC | 56.459 | -17,69 | 2.851 | -18,03 | ||||
| 2026-01-26 | 13F | American Wealth Advisors, LLC | 42.283 | 3,33 | 2.144 | 3,03 | ||||
| 2026-01-30 | 13F | Archer Investment Corp | 2.908 | 0,00 | 147 | 0,00 | ||||
| 2026-02-10 | 13F | CIBC World Markets Inc. | 13.335 | 0,46 | 676 | 0,30 | ||||
| 2026-02-11 | 13F | O'shaughnessy Asset Management, Llc | 12 | 0,00 | 1 | |||||
| 2026-04-06 | 13F | Rosenberg Matthew Hamilton | 88.871 | -1,11 | 4.487 | -1,51 | ||||
| 2026-01-23 | 13F | Assetmark, Inc | 13.864 | -87,30 | 703 | -87,34 | ||||
| 2026-02-13 | 13F | Wells Fargo & Company/mn | 227.270 | 3,72 | 11.523 | 3,45 | ||||
| 2026-04-24 | 13F | Charter Oak Capital Management, LLC | 39.852 | -31,15 | 2.012 | -31,42 | ||||
| 2026-02-13 | 13F | Level Four Advisory Services, Llc | 6.980 | 0,00 | 354 | -0,28 | ||||
| 2026-02-18 | 13F | EP Wealth Advisors, Inc. | 0 | -100,00 | 0 | -100,00 | ||||
| 2026-02-14 | 13F | Berkshire Asset Management Llc/pa | 0 | -100,00 | 0 | |||||
| 2026-02-09 | 13F | Harbour Investments, Inc. | 2.978 | -2,71 | 151 | -3,23 | ||||
| 2026-02-09 | 13F | Huntington National Bank | 0 | |||||||
| 2026-04-23 | 13F | Private Wealth Management Group, LLC | 20.958 | 6,92 | 1.058 | 6,55 | ||||
| 2026-02-25 | 13F | Topor & Co. Korea | 42.131 | 2 | ||||||
| 2026-04-09 | 13F | Nelson, Van Denburg & Campbell Wealth Management Group, LLC | 4.199 | 0,00 | 212 | 0,00 | ||||
| 2026-04-07 | 13F | Central Pacific Bank - Trust Division | 10.494 | -56,18 | 530 | -56,43 | ||||
| 2026-02-12 | 13F | CIBC Private Wealth Group, LLC | 269 | 0,00 | 14 | 0,00 | ||||
| 2026-04-22 | 13F | Harbor Asset Planning, Inc. | 229 | 0,88 | 12 | 0,00 | ||||
| 2026-02-13 | 13F | Bay Colony Advisory Group, Inc d/b/a Bay Colony Advisors | 0 | -100,00 | 0 | -100,00 | ||||
| 2026-04-10 | 13F | Novem Group | 4.401 | 0,00 | 222 | -0,45 | ||||
| 2026-02-10 | 13F | Measured Wealth Private Client Group, LLC | 0 | -100,00 | 0 | |||||
| 2026-04-15 | 13F | WESPAC Advisors SoCal, LLC | 3.968 | -44,23 | 200 | -44,44 | ||||
| 2026-04-27 | 13F | Truist Financial Corp | 6.175 | 3,73 | 312 | 3,32 | ||||
| 2025-11-07 | 13F | Addison Advisors LLC | 0 | -100,00 | 0 | |||||
| 2026-02-13 | 13F | River Wealth Advisors LLC | 108.095 | -6,65 | 5.480 | -6,88 | ||||
| 2026-02-13 | 13F | Resources Investment Advisors, LLC. | 4.909 | 249 | ||||||
| 2026-02-11 | 13F | Jpmorgan Chase & Co | 139.066 | -4,18 | 7.051 | -4,42 | ||||
| 2026-02-12 | 13F | Barings Llc | 18.271 | -16,61 | 926 | -16,80 | ||||
| 2026-02-12 | 13F | Colonial Trust Advisors | 292.855 | 2,34 | 14.848 | 2,08 | ||||
| 2026-02-10 | 13F | Lido Advisors, LLC | 103.130 | -0,03 | 5.242 | -0,02 | ||||
| 2026-02-04 | 13F | LRI Investments, LLC | 1.960 | 0,00 | 99 | 0,00 | ||||
| 2026-02-17 | 13F | Citadel Advisors Llc | 0 | -100,00 | 0 | |||||
| 2026-04-23 | 13F | Farmers & Merchants Investments Inc | 970.988 | 0,28 | 49.025 | -0,14 | ||||
| 2026-02-12 | 13F | Steward Partners Investment Advisory, Llc | 163 | -80,07 | 8 | -80,49 | ||||
| 2026-01-21 | 13F | Crews Bank & Trust | 736.390 | 7,61 | 37.335 | 7,33 | ||||
| 2026-01-30 | 13F | Catalytic Wealth RIA, LLC | 16.156 | -6,43 | 819 | -6,61 | ||||
| 2026-02-06 | 13F | HighTower Advisors, LLC | 199.468 | -1,50 | 10.113 | -1,75 | ||||
| 2026-02-11 | 13F | LPL Financial LLC | 1.151.880 | 3,41 | 58.400 | 3,14 | ||||
| 2026-02-17 | 13F | Davis Wealth Advisors, LLC | 6.110 | 310 | ||||||
| 2026-02-13 | 13F | Aptus Capital Advisors, LLC | 102 | -62,50 | 5 | -61,54 | ||||
| 2026-02-17 | 13F | Mercer Global Advisors Inc /adv | 4.746 | -0,06 | 241 | -0,41 | ||||
| 2026-02-17 | 13F | Obsido Oy | 55.650 | -10,33 | 2.821 | -10,56 | ||||
| 2026-01-14 | 13F | Jfs Wealth Advisors, Llc | 0 | 0 | ||||||
| 2026-02-17 | 13F | Raymond James Financial Inc | 678.490 | -1,84 | 34.399 | -2,09 | ||||
| 2026-02-04 | 13F | Rockbridge Investment Management, LCC | 60.874 | -0,40 | 3.086 | -0,64 | ||||
| 2026-02-12 | 13F | Renaissance Technologies Llc | 31.582 | -85,05 | 1.601 | -85,09 | ||||
| 2026-02-17 | 13F | New England Asset Management Inc | 100 | 0,00 | 5 | 0,00 | ||||
| 2026-02-17 | 13F | Fmr Llc | 987 | -62,47 | 50 | -62,41 | ||||
| 2026-02-09 | 13F | Mmbg Investment Advisors Co. | 16.964 | 0,00 | 860 | -0,23 | ||||
| 2026-02-17 | 13F | Advisory Services Network, LLC | 5.683 | 0,09 | 288 | 0,00 | ||||
| 2026-02-10 | 13F | Goldman Sachs Group Inc | 61.829 | -7,67 | 3.135 | -7,90 | ||||
| 2026-02-17 | 13F | Quantinno Capital Management LP | 94.511 | -4,13 | 4.792 | -4,37 | ||||
| 2026-02-10 | 13F | Meitav Dash Investments Ltd | 4.775 | -5,54 | 241 | -5,88 | ||||
| 2025-11-14 | 13F | Two Sigma Securities, Llc | 0 | -100,00 | 0 | -100,00 | ||||
| 2026-02-13 | 13F | Pitcairn Wealth Advisors LLC | 11.680 | 592 |